
Market Overview
| Study Period | 2020 - 2031 |
|---|---|
| Market Size (2026) | USD 19.81 Billion |
| Market Size (2031) | USD 28.57 Billion |
| Growth Rate (2026 - 2031) | 7.60 % |
| Fastest Growing Market | Asia Pacific |
| Largest Market | North America |
| Market Concentration | Medium |
Major Players *Disclaimer: Major Players sorted in no particular order Image © Mordor Intelligence. Reuse requires attribution under CC BY 4.0. | |
Anesthesia Devices Market Analysis by Mordor Intelligence
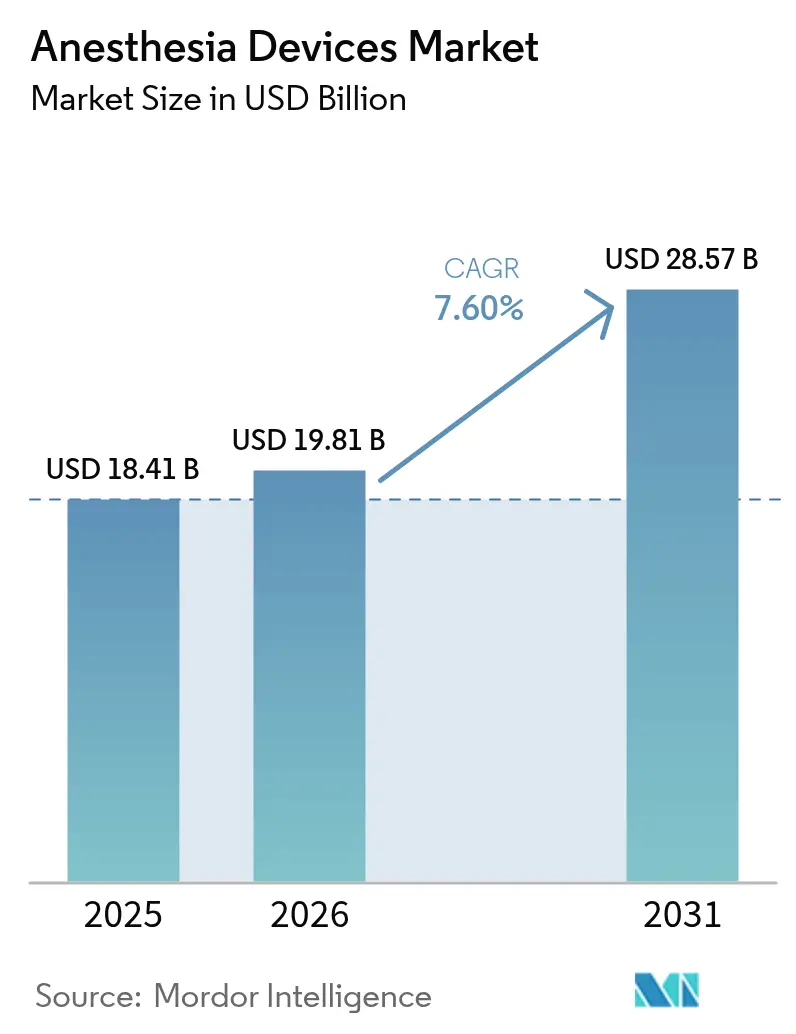
The anesthesia devices market size was valued at USD 18.41 billion in 2025 and estimated to grow from USD 19.81 billion in 2026 to reach USD 28.57 billion by 2031, at a CAGR of 7.6% during the forecast period (2026-2031). Growth is propelled by artificial-intelligence-enabled monitoring platforms that cut anesthetic agent use by up to 50%, the rapid shift of surgical volumes to ambulatory settings, and surging demand for portable workstations that match the efficiency requirements of outpatient theaters. North America continues to anchor global revenues, yet Asia-Pacific is expanding faster as governments fund new operating suites and local manufacturers scale up. Environmental regulations that target high-global-warming-potential anesthetic gases are reshaping product design priorities toward low-flow delivery and volatile capture systems. Competitive intensity is greatest in integrated platforms that bring delivery, ventilation, and analytics into a single workflow.
Key Report Takeaways
- By product type, anesthesia machines led with a 41.88% anesthesia devices market share in 2025, while disposables and accessories are projected to expand at a 9.18% CAGR through 2031.
- By end user, hospitals commanded 67.76% share of the anesthesia devices market size in 2025, whereas ambulatory surgery centers are pacing ahead at a 10.05% CAGR to 2031.
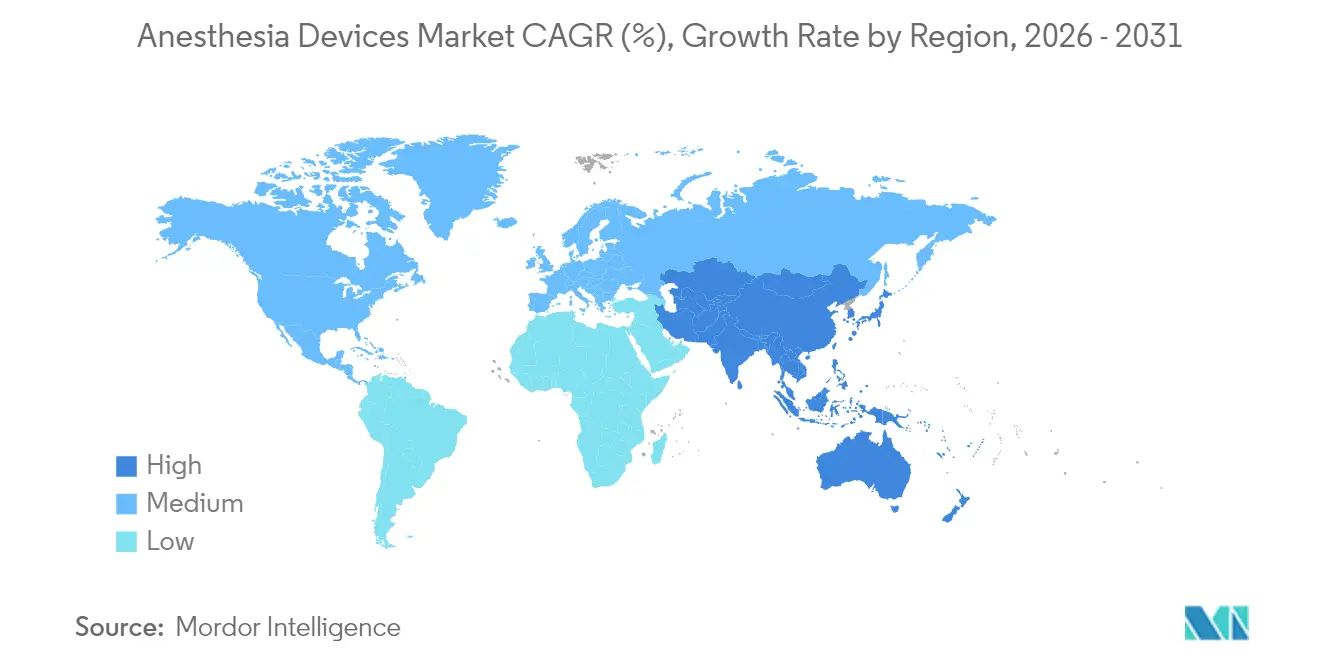
- By geography, North America contributed 39.85% revenue in 2025, yet Asia-Pacific is set to post the fastest 8.12% CAGR over the forecast period.
Note: Market size and forecast figures in this report are generated using Mordor Intelligence’s proprietary estimation framework, updated with the latest available data and insights as of 2026.
Market Trends and Insights
Drivers Impact Analysis of Anesthesia Devices Market*
| Driver | % Impact on CAGR Forecast | Geographic Relevance | Impact Timeline |
|---|---|---|---|
| Technological advancements in anesthesia delivery and monitoring | +2.1% | Global; strongest in North America and Europe | Medium term (2-4 years) |
| Rising volume of surgical procedures globally | +1.8% | Highest impact in Asia-Pacific | Long term (≥ 4 years) |
| Increasing burden of chronic diseases and aging population | +1.5% | Concentrated in developed markets | Long term (≥ 4 years) |
| Expansion of ambulatory and day-care surgery centers | +1.2% | North America & Europe; expanding in Asia-Pacific | Short term (≤ 2 years) |
| Growing healthcare investments in emerging economies | +0.9% | Asia-Pacific, Middle East & Africa | Medium term (2-4 years) |
| Integration of digital health and data analytics in operating rooms | +0.6% | Global; led by North America | Medium term (2-4 years) |
| Source: Mordor Intelligence | |||
Technological Advancements in Anesthesia Delivery and Monitoring
Closed-loop systems that titrate hypnotics and inhalational agents in real time are trimming drug consumption by up to 50%, producing measurable cost savings for providers. FDA-cleared nociception indices that harness machine-learning algorithms now personalize analgesic depth and reduce racial bias in pain assessment. Brain-function monitors have cut awareness with recall by 64%, strengthening the value proposition of advanced monitoring. Vendors are embedding touchscreen interfaces, HL7-ready data ports, and cloud gateways that channel intraoperative data into the electronic medical record. Competitive differentiation hinges on demonstrating faster recovery, fewer complications, and lower total cost of ownership. Smaller firms face capital and regulatory hurdles because high-performance compute resources, clinical data sets, and post-market surveillance teams are compulsory for algorithmic devices.
Rising Volume of Surgical Procedures Globally
Ambulatory centers are projected to lift annual case throughput by 21%, reaching 44 million procedures by 2034, with orthopedic, spine, and gastroenterology cases at the forefront[1]ASC Focus, “2025 Ambulatory Surgery Center Procedure Outlook,” ascfocus.org. Asia-Pacific’s population aged 60+ will represent 22.2% of residents by 2050, accelerating demand for general anesthesia in cardiovascular and oncologic interventions. Migration toward minimally invasive techniques enables outpatient cardiac ablations and spine fusions that traditionally remained inpatient. Capacity constraints in hospital operating rooms are triggering multibillion-dollar investments in standalone surgical hubs. Device makers benefit from higher disposable turnover and the need for compact machines that roll easily between theaters, yet they must also address cost pressures stemming from bundled reimbursement rates.
Increasing Burden of Chronic Diseases and Aging Population
Medicare treated 3.4 million beneficiaries in ambulatory centers during 2023, and payments rose 15.4% to USD 6.8 billion, underscoring the financial weight of older, multi-morbid patients. Complex comorbidity profiles demand integrated monitors that display hemodynamics, gas exchange, and depth of anesthesia on a single screen, allowing clinicians to optimize dosages minute-to-minute. Chronic disease prevalence remains acute in emerging markets where critical-care capacity is still scaling, prompting large tenders for modular workstations with built-in tele-service diagnostics. Vendors offering ecosystem bundles—delivery unit, monitors, consumables, service contracts—are positioned to embed themselves deeply within hospital infrastructure.
Expansion of Ambulatory and Day-Care Surgery Centers
The global ASC sector was worth USD 87.7 billion in 2022 and is on course to reach USD 165 billion by 2032 at a 6.6% CAGR, validating its role as the fastest outlet for the anesthesia devices market. Centers deliver 25-50% cost savings versus hospital outpatient departments, driving payer endorsement and investor inflows. For-profit ownership exceeds 90%, and most facilities cluster in urban corridors that reward high case density. Workflow efficiency is paramount; machines with automated pre-checks and “turn-over” modes shorten idle time between cases. Although access gaps persist for dual-eligible or disabled patients, ASCs continue to siphon elective volumes, posing revenue risk to hospital chains that delay strategy realignment.
Restraints Impact Analysis of Anesthesia Devices Market*
| Restraints Impact Analysis | (~) % Impact on CAGR Forecast | Geographic Relevance | Impact Timeline |
|---|---|---|---|
| High acquisition and maintenance costs of advanced systems | -1.4% | Global; most acute in emerging markets | Short term (≤ 2 years) |
| Stringent regulatory and approval requirements | -0.8% | Varies by jurisdiction | Medium term (2-4 years) |
| Shortage of skilled anesthesiology professionals | -0.7% | Global; pronounced in rural and emerging regions | Long term (≥ 4 years) |
| Environmental and sustainability concerns over anesthetic gases | -0.6% | Global; policy focus in Europe & North America | Medium term (2-4 years) |
| Source: Mordor Intelligence | |||
High Acquisition and Maintenance Costs of Advanced Systems
Capital budgets in low-resource hospitals rarely stretch to premium workstations whose list prices can surpass USD 200,000, and service contracts often add 10-15% of purchase price annually. Break-fix delays are widespread because biomedical engineers lack training and manufacturers’ field teams cover large territories. Managed-equipment-service contracts that combine financing, training, and uptime guarantees are gaining traction, yet they lock buyers into decade-long commitments that strain fiscal flexibility. AI-enabled units impose further costs for cloud subscriptions and security updates. An uneven adoption curve risks splitting the anesthesia devices market into high-tech and basic-care tiers.
Stringent Regulatory and Approval Requirements
The FDA framework now asks developers of machine-learning devices to submit change-control protocols that outline how algorithms will evolve post-clearance, adding documentation burdens and review cycles. Device classifications span Class I to Class III, and advanced electroanesthesia apparatus require pre-market approval, a path that can exceed 180 days even for well-resourced firms[2]U.S. Food and Drug Administration, “Device Classification Panels,” fda.gov. Global manufacturers must also address divergent European MDR rules and country-specific dossiers in Asia, inflating cost-to-launch. Start-ups that lack in-house regulatory affairs teams often pivot to licensing agreements with incumbents, reinforcing consolidation trends in the anesthesia devices industry.
*Our forecasts treat driver/restraint impacts as directional, not additive. The impact forecasts reflect baseline growth, mix effects, and variable interactions.
Anesthesia Devices Market Segment Analysis
By Product Type:
Machines Drive Revenue, Disposables Accelerate GrowthAnesthesia machines produced 41.88% of the anesthesia devices market revenue in 2025, underscoring their status as the capital cornerstone of every operating suite. Replacement cycles favor premium units with high-speed piston ventilators, volumetric agent delivery, and real-time gas analysis that feed into the hospital data backbone. Next-generation workstations, such as models equipped with 15-inch capacitive touchscreens and HL7 interoperability, appeal to facilities pursuing fully digital operating rooms. Larger hospitals upgrade every seven to nine years, creating lumpy but sizeable orders that shape quarterly earnings for leading vendors. Environmental imperatives are leading engineers to incorporate volatile-agent capture modules that cut greenhouse emissions by up to 65%.
Disposables and accessories are set to grow at a 9.18% CAGR, the fastest pace in the anesthesia devices market. Single-use breathing circuits, supraglottic airways, and depth-of-anesthesia electrodes deliver recurring revenues tightly aligned with procedure counts. Heightened infection-control protocols post-pandemic and the convenience of ready-to-use sterile kits continue to displace reusable equivalents. The anesthesia devices market size attributed to disposables is expected to outpace machine revenues by the end of the decade, though sustainability initiatives are prompting early pilots of compostable or reusable circuits that could reshape demand patterns. Vendors that package proprietary disposables with hardware platforms strengthen lock-in and stabilize margins.




By End User:
Hospital Dominance Challenged by ASC MomentumHospitals captured 67.76% anesthesia devices market share in 2025 thanks to complex surgeries that need advanced ventilation modes, invasive pressure monitoring, and integrated decision support. Academic medical centers often lead early adoption of closed-loop algorithms and AI-driven advisory systems because they balance teaching, research, and clinical care in one environment. High-acuity trauma and transplant cases remain almost exclusively hospital-based, sustaining demand for high-end workstations. Budget constraints, however, push many facilities to extend lifecycles of legacy devices beyond recommended years, creating a retrofit market for upgraded monitors and software modules.
Ambulatory surgery centers are advancing at a 10.05% CAGR and stand as the most dynamic buyer cluster within the anesthesia devices market. Their business model rewards rapid case turnover and minimal unplanned admissions. Consequently, they favor compact machines that combine gas delivery, ventilation, and patient monitoring into a single cart. ASC leadership teams negotiate multi-site procurement contracts that prioritize reliability and low per-case consumable costs. Anesthesia devices market size allocated to ASCs is projected to nearly double by 2031 as orthopedic, spine, and cardiovascular procedures continue migrating out of hospital walls.

Geography Analysis
North America Anesthesia Devices Market
North America generated 39.85% of 2025 revenue in the anesthesia devices market, buoyed by high surgical volumes, established reimbursement for outpatient procedures, and early uptake of AI-enabled platforms. U.S. payers reimbursed ambulatory centers USD 6.8 billion in 2023, a 15.4% year-on-year rise, validating sustained procedural migration. Federal initiatives that encourage interoperability also accelerate upgrades to network-ready workstations. Canada follows a single-payer model that somewhat tempers capital spending, but simulation-based anesthesia education drives demand for integrated training solutions. Mexico benefits from medical tourism, prompting private hospitals to invest in premium delivery systems to attract foreign patients seeking cost-effective elective surgeries.
APAC Anesthesia Devices Market
Asia-Pacific represents the fastest growing territory at an 8.12% CAGR. China and India channel public budgets into tertiary hospitals and mass-procurement schemes that favor domestic vendors offering cost-competitive devices. Indonesia secured a USD 12 million IFC cornerstone investment during a 2025 IPO to enlarge local production capacity. Japanese aid agencies have financed cross-border technology transfers, reflecting the region’s outward focus on global health equity. Venture funding dipped relative to 2021 highs, but still underwrites AI start-ups tailoring closed-loop solutions for low-resource settings. The anesthesia devices market size in the region benefits from rising cardiovascular and oncology workloads linked to aging demographics and lifestyle shifts.
EMEA Anesthesia Devices Market
Europe retains a significant stake, driven by national mandates to phase out desflurane and cut hospital carbon footprints. Hospitals in the United Kingdom and Scandinavia have re-engineered pipelines to support low-flow sevoflurane and intravenous protocols, spurring demand for volatile capture cartridges that attach to existing workstations. Germany and France impose stringent post-market surveillance, pushing manufacturers to allocate resources for real-world performance monitoring. Meanwhile, the Middle East and Africa see accelerating uptake under managed-equipment-service models that bundle devices, service, and training into multiyear agreements. Kenya’s national referral hospitals, for example, run turnkey contracts with global vendors that guarantee uptime and training, easing traditional maintenance hurdles.

Regulatory Landscape
Regulatory requirements for anesthesia devices continue to tighten around software-enabled monitoring, quality systems, and consensus standards that support safety and interoperability. In the United States, FDA oversight spans Class I to Class III devices, and in June 2026 the agency issued a final order placing adjunctive pain measurement devices for anesthesiology into Class II with special controls. This order clarifies expectations for performance testing, labeling, and post-market controls for this monitoring category. FDA also transitioned quality system expectations through the Quality Management System Regulation (QMSR), effective February 2, 2026, aligning quality management more closely with ISO-based frameworks and increasing the compliance workload for global manufacturers shipping to the US market.
In Europe, Regulation (EU) 2017/745 (EU MDR) remains the central framework for CE marking, with ongoing updates and reliance on strengthened clinical evaluation and post-market surveillance processes, including access to expert panel scientific advice for higher-risk devices. The European Commission published Commission Delegated Regulation (EU) 2026/1451, which amends aspects of MDR clinical investigation requirements for certain implantable and Class III devices, shaping how manufacturers plan evidence generation and timelines. Standards updates also influence market access, including publication of ISO 80601-2-69:2026 (relevant to oxygen concentrator equipment used in medical and anaesthetic systems) and FDA-recognized standard transitions for anesthesia-related electrical medical equipment, which guide design verification and premarket submission readiness.
Competitive Landscape
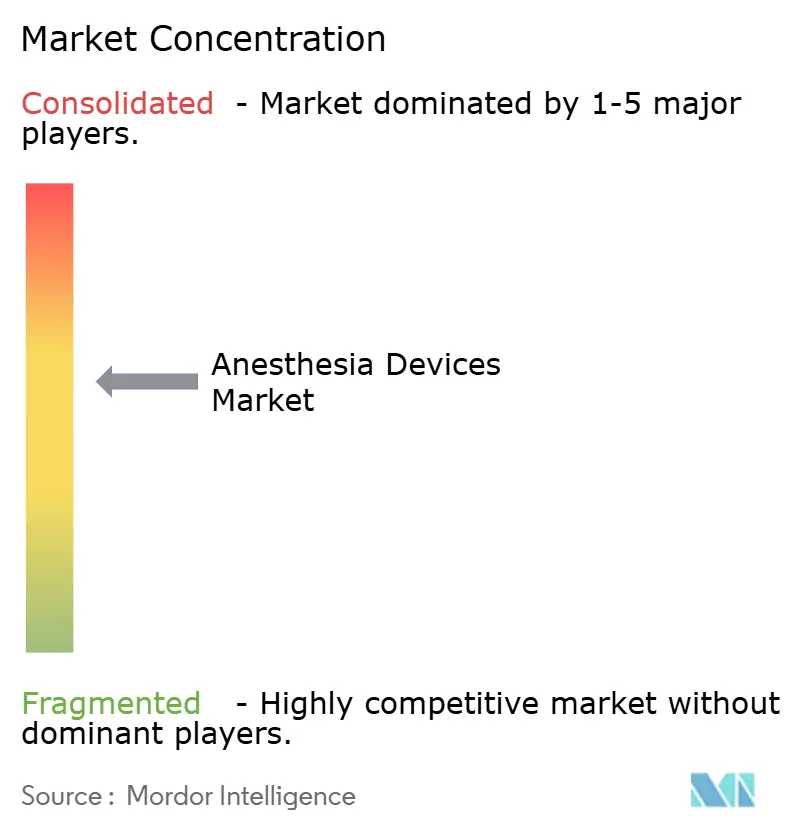
The anesthesia devices market features moderate consolidation anchored by diversified conglomerates that pair hardware, software, and disposables. These incumbents leverage robust regulatory affairs teams and global distribution to block late entrants. Strategic technology alliances are central: one leading vendor partnered with a hyperscale cloud provider to embed generative AI that automates documentation, while another allied with a GPU specialist to co-develop edge-based imaging and autonomous positioning solutions. Recalls, such as a 2025 ventilation failure warning covering select workstations, highlight the reputational stakes and spur investment in predictive maintenance analytics.
Emerging players carve niches in pediatric, MRI-compatible, and portable segments. Closed-loop innovators pioneer algorithms that modulate hypnotic and analgesic dosing simultaneously, targeting faster extubation and reduced post-op nausea. Start-ups often license core technology to majors who integrate the software within existing platforms, accelerating commercialization but reinforcing incumbent control.
Environmental credentials are shaping procurement, with tenders awarding points for devices that document greenhouse-gas reductions verified through independent testing. Price pressure remains intense in low- and middle-income countries, pushing suppliers to offer financing, consumable credit lines, and cloud-enabled remote diagnostics to win multiyear contracts.
Anesthesia Devices Industry Leaders
Medtronic PLC
Draegerwerk AG
Koninklijke Philips NV
Fisher & Paykel Healthcare
B. Braun SE
- *Disclaimer: Major Players sorted in no particular order
Anesthesia Devices Market Companies Covered in this Report
- GE Healthcare
- Dragerwerk
- Medtronic
- Koninklijke Philips
- Mindray
- Smiths Group
- B. Braun
- Fisher & Paykel Healthcare
- Ambu
- Teleflex
- Nihon Kohden
- Shenzhen Comen Medical
- Allied Medical
- BPL
- Masimo
- MindChild Medical
- Aeonmed Co. Ltd.
- L�wenstein Medical
- Spacelabs Healthcare
- Penlon Ltd.

Market Opportunities and Future Outlook
A whitespace opportunity centers on connected anesthesia ecosystems that combine delivery, ventilation, and monitoring with validated analytics, as providers standardize on interoperable platforms to reduce documentation burden and support ambulatory throughput. The June 2026 FDA final order classifying adjunctive pain measurement devices for anesthesiology into Class II (special controls) creates a clearer regulatory route for nociception and pain-index monitoring add-ons that feed closed-loop dosing and decision support, aligning with the market shift toward AI-enabled monitoring reflected in current product roadmaps. Similar Class II (special controls) classification activity around real-time ultrasound anatomy visualization and labeling tools for regional anesthesia reinforces opportunities for perioperative workflows that link imaging guidance, monitoring, and anesthesia records.
A second opportunity set is anchored in compliance-led upgrades and sustainability-oriented redesign, where hospitals and ASCs refresh installed bases to meet quality-system documentation expectations under FDA QMSR (effective February 2026) while also pursuing low-flow delivery and volatile capture capabilities cited as an active procurement consideration. Partnerships that emphasize interoperability, such as Philips and Getinge integration of Flow Family anesthesia delivery systems with Philips IntelliVue monitoring, highlight an industry direction toward multi-vendor connectivity rather than standalone devices. In emerging markets, manufacturing capacity programs, including the International Finance Corporation USD 12 million investment (April 2025) tied to Indonesian medical device production expansion, support localized sourcing and tender participation for cost-competitive workstations, disposables, and service models.
Recent Industry Developments in Anesthesia Devices Market
- June 2026: Medtronic launched the McGRATH MAC+ video laryngoscope with enhanced visualization and retrospective recording capabilities across multiple markets, including the United States and key international geographies. The update strengthens premium airway management portfolios that increasingly emphasize data capture and usability in high-throughput operating rooms and ambulatory settings.
- October 2025: Ascom, Drager, and B. Braun introduced a "Silent ICU" solution built on the ISO/IEEE 11073 SDC connectivity standard to enable vendor-neutral device interoperability and streamlined alarm delegation. The development reinforces the shift toward integrated perioperative and critical care ecosystems where anesthesia workstations, monitors, and adjacent devices exchange data with less manual coordination.
- June 2025: GE HealthCare initiated a recall of specific Carestation anesthesia devices due to a ventilation failure risk. The action raised the profile of reliability engineering, preventive maintenance, and service responsiveness as differentiators in anesthesia workstations, and it increased buyer scrutiny of lifecycle service commitments during capital refresh decisions.


Anesthesia Devices Market Report Scope and Research Methodology
Market Definition and Coverage
For this methodology, the anesthesia devices market covers the revenues generated from devices used to deliver anesthesia and to monitor patients during anesthesia across surgical and procedural care settings.
Scope exclusions: We exclude anesthesia drugs and routine clinical services that are billed as professional fees rather than sold as device revenues.
Segments Covered in This Report
- By Product Type
- Anesthesia Machines
- Anesthesia Workstations
- Anesthesia Delivery Machines
- Portable
- Stand-Alone
- Anesthesia Ventilators
- Anesthesia Monitors
- Disposables & Accessories
- Anesthesia Circuits
- Anesthesia Masks
- Endotracheal Tubes (ETTs)
- Laryngeal Mask Airways (LMAs)
- Other Disposables And Accessories
- Anesthesia Machines
- By End User
- Hospitals
- Clinics & Nursing Facilities
- Geography
- North America
- United States
- Canada
- Mexico
- Europe
- Germany
- United Kingdom
- France
- Italy
- Spain
- Rest of Europe
- Asia-Pacific
- China
- Japan
- India
- Australia
- South Korea
- Rest of Asia-Pacific
- Middle East & Africa
- GCC
- South Africa
- Rest of Middle East & Africa
- South America
- Brazil
- Argentina
- Rest of South America
- North America
Data Sources, Market Sizing, and Validation
Desk Research
Desk research was used to set the factual base of the model and to align definitions across regions. We referred to public health statistics and procedure trends from sources such as the World Health Organization, the World Bank, and the OECD, which help explain where demand for anesthesia delivery and monitoring concentrates.
To keep the device scope practical, we also reviewed product standards and safety signals from sources such as the US FDA databases and peer-reviewed clinical journals that discuss anesthesia monitoring and airway practice. Along with this, company annual reports, investor presentations, customs and trade summaries, and reputed press were used to cross-check pricing direction and shipment signals, and then company financials plus intelligence and patent databases were used selectively for confirmation. The sources listed above are illustrative, and many other public and internal references were also reviewed for data collection, validation, and clarification.
Primary Interviews and Surveys
Primary work focused on validating the real-world split between anesthesia machines, monitoring, and disposables, and on understanding what buyers replace and when. We spoke with hospital procurement stakeholders, clinical users, distributors, and device-focused executives across major geographies so gaps from desk research could be closed and key assumptions checked.
Feedback was also used to confirm how pricing moves with feature sets, service bundling practices, and tender cycles, and these inputs were then reflected in the final market totals and growth path.
Distribution of primary research fieldwork respondents
| Company type | Respondent position | Region |
|---|---|---|
| Top tier: 29% | CXOs: 14% | APAC: 41% |
| Mid tier: 53% | Functional/Unit leaders: 42% | EMEA: 35% |
| Smaller Players: 18% | Managers: 44% | Americas: 24% |
Market-Sizing & Forecasting
Sizing started with a top-down build that reconstructs the demand pool using procedure volume and operating room activity as the anchor, and then allocates spend across core anesthesia delivery, monitoring, and high-run disposables based on usage patterns. Once this structure was in place, we cross-checked totals using selective bottom-up approximations, such as sampled average selling prices multiplied by estimated unit demand for key device groups, followed by distributor channel checks to adjust outliers.
Inputs that mattered most included surgical procedure trends by region, installed base replacement cycles for anesthesia workstations, attach rates of monitoring modules, utilization patterns in ambulatory centers, and broad pricing direction for disposables and accessories. Where country-level data was thin, proxy indicators were used (for example, hospital bed growth and perioperative capacity additions), and we tested the impact through sensitivity checks so totals did not swing on a single assumption.
For forecasting, scenario analysis was applied and then refined with primary feedback on capital purchasing intentions and tender timing, which helped separate steady replacement demand from step changes tied to capacity expansions. The final path was reviewed to ensure growth stays consistent with observed healthcare spending signals and the pace of technology adoption in anesthesia care.
Data Validation & Update Cycle
Outputs were validated through triangulation across multiple signals, including procedure trends, regional spending direction, and observed shifts in product mix between capital equipment and disposables. When a country or segment result looked inconsistent with an independent indicator, the assumptions were reopened and the checks were repeated before internal sign-off.
Reviews happen in multiple steps so calculation logic, unit conversions, and currency handling are consistently applied across regions. Reports are refreshed annually, and interim updates are made when material events change demand or supply, followed by a final pre-delivery review so clients receive the latest updated view.
Mordor Intelligence's Global Anesthesia Devices Market Size Versus Other Published Estimates
Published market sizes for anesthesia devices often do not match because each study draws the line differently on what counts as an anesthesia device, and because base years and pricing assumptions are not always aligned. Differences also come from how fast pricing is assumed to move, whether disposables are fully counted, and how often the dataset is refreshed.
Some external estimates include wider perioperative and respiratory equipment buckets, and they may also start from an older base year that is then inflated forward. In Mordor Intelligence, totals are limited to anesthesia delivery, anesthesia monitoring, and the related disposables and accessories that are directly tied to those workflows, and currencies are normalized to a consistent year so cross-region sums do not drift.
Benchmark comparison
| Source | Market Size | Gaps in Research Methodology |
|---|---|---|
| Mordor Intelligence | USD 19.81 B (2026) | |
| Global Research Publisher A | USD 24.40 B (2025) | Uses a different base year and can apply broader equipment inclusions under anesthesia devices, and that combination can lift the reported total even before growth is applied. |
| Research Publisher B | USD 17.50 B (2024) | Anchors the model to an earlier year and emphasizes a faster growth arc, and the market total can differ depending on how capital equipment and consumables are valued and converted across regions. |
The table shows that most of the spread is explained by year alignment and the practical choice of which adjacent equipment categories are counted. By keeping the scope tied to the anesthesia delivery and monitoring workflow and checking key assumptions with interviews, the estimate stays traceable to clear drivers and repeatable steps.


Key Questions Answered in the Report
What is the current valuation of the anesthesia devices market?
The anesthesia devices market size stands at USD 19.81 billion in 2026 and is projected to rise to USD 28.57 billion by 2031.
Which segment is expanding fastest within the anesthesia devices market?
Disposables and accessories exhibit the highest growth at a 9.18% CAGR, driven by single-use circuits, airways, and sensors aligned with rising procedure volumes.
Why are ambulatory surgery centers critical to future demand?
Ambulatory centers already perform 72% of U.S. surgeries and save 25-50% versus hospital outpatient departments, pushing procurement of compact, automated anesthesia systems that fit high-throughput workflows.
Which region is growing fastest in the anesthesia devices market?
Asia-Pacific is forecast to advance at an 8.12% CAGR thanks to healthcare infrastructure investments and expanding domestic manufacturing capabilities.
How are environmental regulations influencing device design?
Mandates to reduce anesthetic-gas emissions favor low-flow delivery systems and volatile capture technologies, prompting manufacturers to integrate emission-reduction modules into new workstations.
What are the main barriers to adopting AI-enabled anesthesia platforms?
High acquisition costs, ongoing software-maintenance fees, and complex regulatory pathways for machine-learning algorithms limit uptake, especially in resource-constrained healthcare settings.
Page last updated on:





