Phosphatic Fertilizer Market Size
Market Overview
| Study Period | 2017 - 2030 |
| Base Year For Estimation | 2024 |
| Forecast Data Period | 2025 - 2030 |
| Market Size (2025) | USD 57.91 Billion |
| Market Size (2030) | USD 82.33 Billion |
| Growth Rate (2025 - 2030) | 7.29% CAGR |
| Market Concentration | Low |
Major Players*Disclaimer: Major Players sorted in no particular order Image © Mordor Intelligence. Reuse requires attribution under CC BY 4.0. |
|

Phosphatic Fertilizer Market Analysis
The Phosphatic Fertilizer Market size is estimated at 57.91 billion USD in 2025, and is expected to reach 82.33 billion USD by 2030, growing at a CAGR of 7.29% during the forecast period (2025-2030).
The phosphate fertilizer industry is experiencing significant transformation amid global geopolitical tensions and supply chain restructuring. The ongoing Russia-Ukraine conflict has particularly disrupted traditional supply channels, prompting countries to diversify their sourcing strategies. This has led to the emergence of new trade partnerships and domestic production initiatives, with countries like Brazil setting ambitious targets for phosphate rock exploration, aiming for a 3% annual increase until 2030. The industry is witnessing a fundamental shift in global trade dynamics, with traditional exporters facing competition from emerging market players.
Technological advancements and sustainability initiatives are reshaping production methods and application techniques in the phosphatic fertilizers sector. Manufacturers are increasingly focusing on developing enhanced efficiency fertilizers, with innovations in coating technologies and controlled-release mechanisms. The industry has witnessed significant improvements in fertilizer composition, as evidenced by products like diammonium phosphate (DAP), which maintains a precise nutrient ratio of 46% phosphate and 18% ammonium, ensuring optimal nutrient delivery. These technological developments are driving the industry towards more sustainable and efficient fertilizer solutions.
The industry is witnessing a notable shift towards specialty phosphatic fertilizers, particularly in developed markets. This trend is characterized by the increasing adoption of water-soluble phosphatic fertilizers, with products like monoammonium phosphate (MAP) achieving approximately 90% water-soluble phosphorus content. The move towards specialty products reflects growing awareness of environmental concerns and the need for more precise nutrient management systems. Manufacturers are responding by developing innovative formulations that offer improved nutrient uptake efficiency while minimizing environmental impact.
Supply chain optimization and raw material security have become critical focus areas for industry stakeholders. China's dominant position in global exports, accounting for 25.3% of world exports in 2022, has prompted other countries to develop alternative supply sources. This has led to increased investments in domestic production capabilities and the exploration of new phosphate rock deposits. The industry is also witnessing significant developments in logistics and distribution networks, with companies implementing advanced tracking systems and digital solutions to ensure reliable supply chains. These initiatives are reshaping traditional business models and creating new opportunities for market participants.
Global Phosphatic Fertilizer Market Trends
The rising pressure on the agriculture industry to meet the growing food demand is expected to increase the area under field crop cultivation
- The global agricultural sector grapples with numerous challenges. The United Nations projects a world population surpassing 9 billion by 2050, potentially straining an agricultural industry already struggling with labor shortages and shrinking fields due to urbanization. The Food and Agriculture Organization predicts that by 2050, 70% of the global population will reside in urban areas. With arable land dwindling worldwide, farmers are increasingly relying on fertilizers to bolster crop yields in an effort to meet the rising demand for food.
- The Asia-Pacific region stands as the leading global agricultural producer, with agriculture employing roughly 20% of its workforce. Field crop cultivation dominates, encompassing over 95% of the region's crop area. Rice, wheat, and corn, collectively occupying 24.3% of the crop area in 2022, are the primary field crops in the region, which is a testament to the region's agricultural diversity and productivity.
- North America ranks as the second-largest arable region globally, boasting a diverse crop portfolio with a focus on field crops. Notably, corn, cotton, rice, soybean, and wheat take center stage, as highlighted by the USDA. In 2022, the United States commanded 46.2% of North America's crop cultivation area. However, adverse environmental conditions, including severe flooding in regions like Texas and Houston, led to a significant drop in the country's crop acreage between 2017 and 2019, underscoring the vulnerability of agricultural production to climate change.

Canola has the highest application rate of potassic fertilizers globally, with an average application rate of 248.6 kg/ha
- Corn, rapeseed, cotton, sorghum, rice, wheat, and soybean are prominent crops globally, known for their high nutrient requirements. The average primary nutrient application rates for these crops in 2022 were as follows: corn (230.57 kg/ha), rapeseed (255.75 kg/ha), cotton (172.70 kg/ha), sorghum (158.46 kg/ha), rice (154.49 kg/ha), wheat (135.35 kg/ha), and soybean (120.97 kg/ha). Primary nutrients are vital for crops, facilitating metabolic processes and contributing to the formation of essential plant tissues, including cells, cell membranes, and chlorophyll. Notably, phosphorus is crucial for cultivating high-quality crops, while potassium plays a pivotal role in activating enzymes necessary for plant growth.
- On a global scale, field crops have an average nutrient application rate of 164.31 kg/ha for nitrogen, potassium, and phosphorus. Nitrogen takes the lead as the most widely used primary nutrient, with an application rate of 224.6 kg/ha, followed by potassium at 150.3 kg/ha. Phosphorus ranks third, with a consumption rate of 117.9 kg/ha in 2022.
- In 2022, rapeseed had the highest nitrogen application rate at 347.4 kg/ha. Corn led in phosphorus application at 156.3 kg/ha, and canola topped in potassium application at 248.6 kg/ha.
- Field crop cultivation is rising globally, with notable growth in South America and Asia-Pacific. These regions are emerging as key markets for fertilizers. Developed regions like Europe and North America, along with areas grappling with nutrient deficiencies, are increasingly turning to specialty fertilizers for their efficacy. These dynamics are poised to fuel the primary nutrient fertilizers market in the coming years.

OTHER KEY INDUSTRY TRENDS COVERED IN THE REPORT
- The growing demand for fruits and vegetables drives the expansion of horticulture crop cultivation
- Asia-Pacific occupies the majority of the irrigation area globally, accounting for 66.8% in 2022
- Phosphorus plays a vital role in cultivating premium-grade fruit and vegetable crops, with an application rate of 297.3 kg/ha
Segment Analysis: Type
DAP Segment in Global Phosphatic Fertilizer Market
Diammonium phosphate (DAP fertilizer) maintains its position as the dominant segment in the global phosphatic fertilizer market, commanding approximately 41% market share in 2024. This leadership position can be attributed to DAP's robust composition, which features 46.0% phosphate and 18.0% ammonium, serving as both a phosphorus and nitrogen source for crops. The Asia-Pacific region emerges as the primary market for DAP fertilizer, commanding a substantial share of global consumption, with China and India collectively accounting for over three-quarters of regional DAP usage. The segment's dominance is further reinforced by its proven efficacy in bolstering crop yields and its pivotal role in addressing the escalating need for enhanced food output and agricultural productivity.
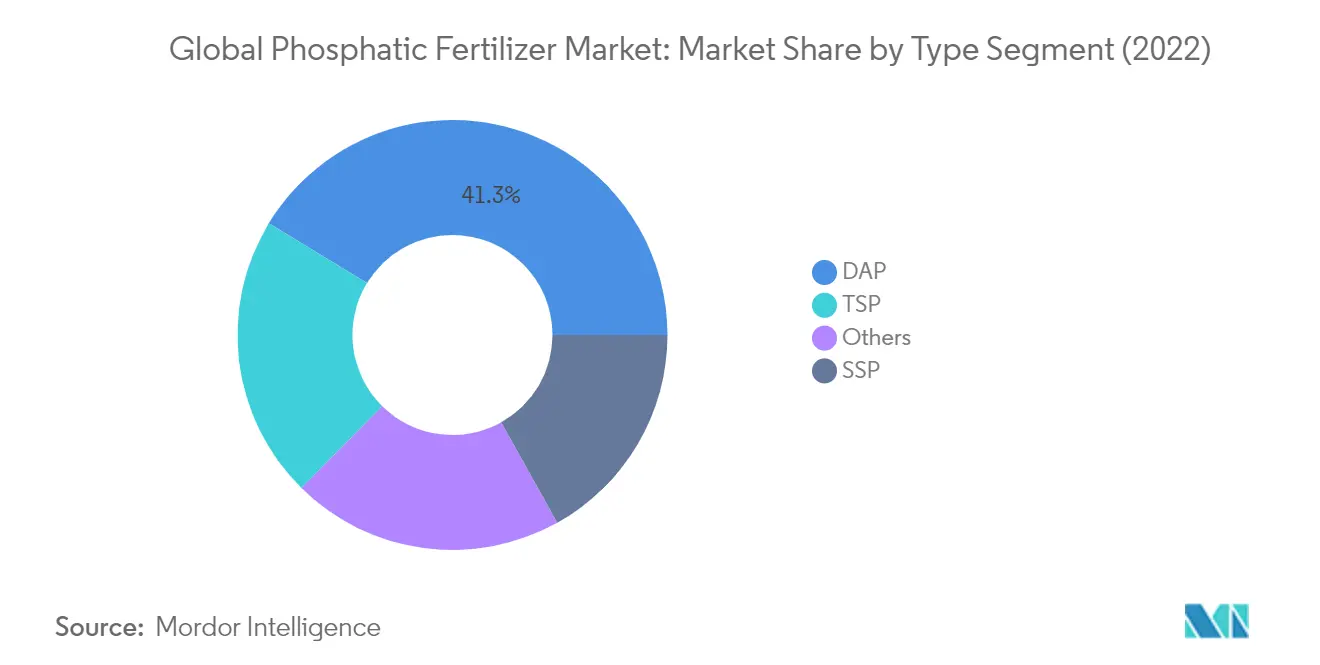
TSP Segment in Global Phosphatic Fertilizer Market
Triple superphosphate (TSP fertilizer) is experiencing remarkable growth momentum in the global phosphatic fertilizer market, with projections indicating an annual growth rate of approximately 9% during 2024-2029. This accelerated growth is primarily driven by TSP's superior phosphate content of 46%, the highest among pure phosphate fertilizers, making it particularly effective for crops with high phosphorus requirements. The segment's expansion is further supported by its heightened solubility, ensuring swift nutrient availability to crops upon application. Additionally, TSP's increasing adoption in leguminous crop cultivation, where natural biological fixation of nitrogen eliminates the need for additional nitrogen supplements, is contributing to its market growth trajectory.
Remaining Segments in Phosphatic Fertilizer Type Market
The phosphatic fertilizer market encompasses other significant segments including Monoammonium Phosphate (MAP fertilizer) and Single Superphosphate (SSP fertilizer), each serving distinct agricultural needs. MAP fertilizer has gained traction due to its balanced nutrient composition and versatility in application methods, making it particularly suitable for precision farming practices. Single superphosphate, while containing a lower phosphate concentration, maintains its relevance in the market due to its cost-effectiveness and additional benefits of containing essential secondary nutrients like sulfur and calcium. These segments continue to play vital roles in meeting diverse crop nutrition requirements across different geographical regions and farming practices.
Segment Analysis: Application Mode
Soil Application Segment in Phosphatic Fertilizer Market
The soil application method continues to dominate the global phosphatic fertilizer market, commanding approximately 94% of the total market value in 2024. This overwhelming market share can be attributed to several factors, including its cost-effectiveness, ease of application, and widespread familiarity among farmers worldwide. Soil application encompasses various techniques such as broadcasting, band or ring placement, and drill application, making it highly versatile for different farming contexts. The segment's dominance is particularly pronounced in field crops, where it accounts for nearly 87% of the application methods. Despite some challenges like soil pollution and uneven distribution, modern soil-based fertilizers, including controlled-release and slow-release variants, have helped address these concerns while maintaining the segment's market leadership.
Fertigation Segment in Phosphatic Fertilizer Market
The fertigation segment represents an innovative approach in the phosphatic fertilizer market, combining irrigation with fertilizer application. This method demonstrates significant advantages in terms of nutrient distribution efficiency and water conservation, potentially enabling 25% to 50% higher crop yields compared to traditional methods. The segment's growth is driven by increasing adoption of precision farming techniques, particularly in regions facing water scarcity and those focusing on high-value horticultural crops. Water-soluble fertilizers dominate the fertigation segment with approximately 52% share, followed closely by liquid fertilizers at 48%. The rising emphasis on sustainable agriculture practices and the growing implementation of advanced irrigation systems are expected to further boost the adoption of fertigation methods in the coming years.
Remaining Segments in Application Mode
The foliar application segment, while smaller in market share, plays a crucial role in the phosphatic fertilizer market by offering unique advantages in nutrient delivery. This method is particularly effective for addressing acute nutrient deficiencies and providing supplemental nutrition during critical growth stages. Foliar application is especially valuable when root functions are compromised or when rapid nutrient uptake is required. The method has gained particular traction in the specialty crops sector and in situations where soil conditions might limit nutrient availability through conventional application methods. However, careful application is necessary as concentrated nutrients in foliar sprays can potentially cause leaf burn during evaporation.
Segment Analysis: Crop Type
Field Crops Segment in Phosphatic Fertilizer Market
Field crops dominate the global phosphatic fertilizer market, commanding approximately 90% market share in 2024, driven by extensive cultivation areas and high nutrient requirements. This segment's prominence is particularly evident in major agricultural regions like Asia-Pacific, where field crops occupy over 95% of the total crop area. The segment's dominance is reinforced by the crucial role of phosphorus in leguminous crops, which require higher phosphorus levels for biological nitrogen fixation. Field crops like corn, rapeseed, cotton, sorghum, rice, wheat, and soybean demonstrate significant phosphorus demands, with average nutrient application rates ranging from 120 to 255 kg per hectare. The segment's substantial market share is further supported by government initiatives and subsidies aimed at ensuring food security and agricultural sustainability across various regions.
Horticultural Crops Segment in Phosphatic Fertilizer Market
The horticultural crops segment is experiencing robust growth in the phosphatic fertilizer market, driven by increasing demand for fruits and vegetables globally. This segment's growth is supported by technological advancements in crop production, including precision farming, greenhouse techniques, and vertical farming, which are enabling farmers to optimize nutrient usage and enhance productivity. The segment's expansion is particularly notable in regions like Asia-Pacific, where countries like China and India are witnessing significant increases in horticultural cultivation areas. The adoption of advanced agricultural practices, coupled with rising consumer demand for high-quality fruits and vegetables, is expected to maintain this segment's growth trajectory. Additionally, the segment benefits from increasing investments in protected cultivation systems and the rising adoption of water-soluble phosphatic fertilizers specifically designed for horticultural applications.
Remaining Segments in Crop Type
The turf and ornamental segment, while smaller in market share, plays a significant role in the phosphatic fertilizer market, particularly in developed regions with extensive landscaping and recreational facilities. This segment caters to diverse applications including golf courses, sports fields, public parks, and ornamental gardens. The segment's importance is growing with increasing urbanization and the expansion of the tourism industry, which drives demand for well-maintained recreational spaces. The specialized nature of turf and ornamental applications often requires premium phosphatic fertilizer products, contributing to the segment's value proposition despite its smaller volume share. The segment also benefits from the growing trend of urban greening initiatives and the increasing focus on aesthetic landscaping in commercial and residential developments.
Phosphatic Fertilizer Market Geography Segment Analysis
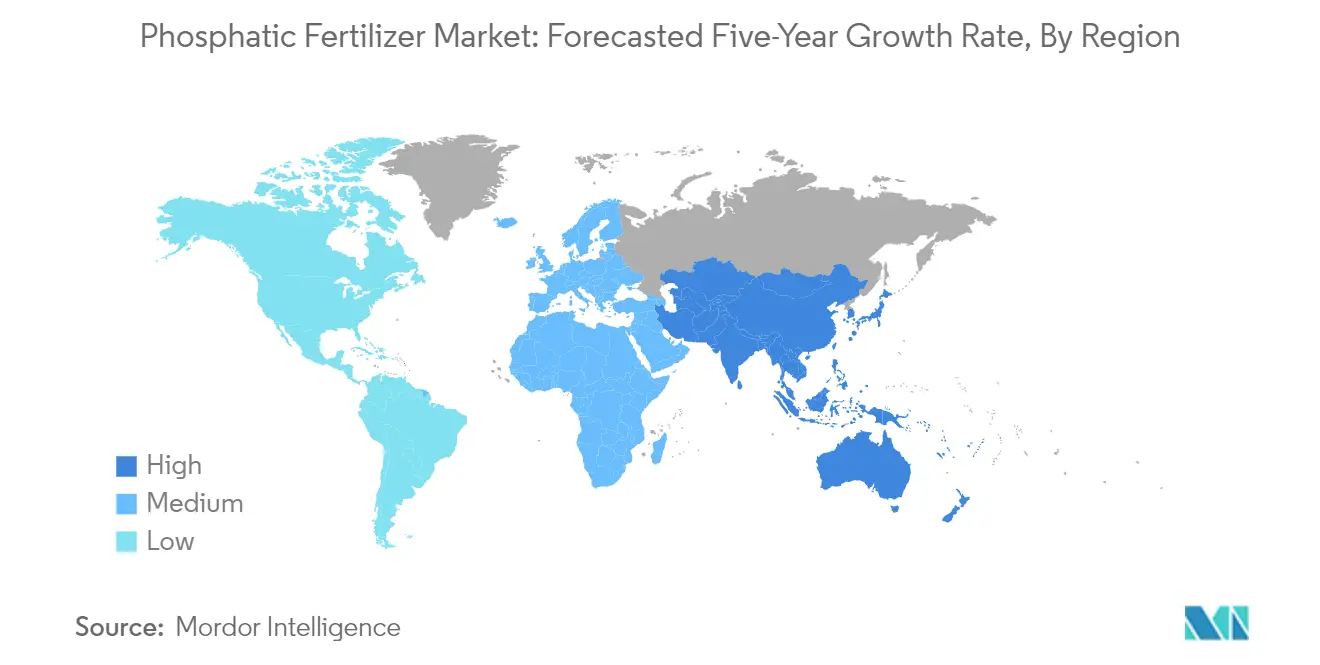
Phosphatic Fertilizer Market in Asia-Pacific
The Asia-Pacific region stands as the cornerstone of the global phosphate fertilizer market, with its vast agricultural landscapes spanning from Australia to Vietnam. The region's dominance is underpinned by its extensive field crop cultivation, particularly in major agricultural nations like China, India, and Indonesia. The market dynamics are shaped by diverse agricultural practices, ranging from traditional farming in rural areas to advanced precision agriculture in more developed nations like Japan and Australia. The region's agricultural sector faces unique challenges, including varying soil conditions, climate patterns, and the need to feed a rapidly growing population.
Phosphatic Fertilizer Market in China
China emerges as the powerhouse in the Asia-Pacific phosphate market, commanding approximately 10% of the global market share in 2024. The country's dominance is reinforced by its position as the world's leading producer of phosphorus fertilizers, with its exports representing about a quarter of global exports. China's market leadership is supported by its extensive agricultural infrastructure, comprehensive distribution networks, and strategic focus on food security. The country's fertilizer industry benefits from significant government support, robust domestic production capabilities, and strong trade relationships with key importing nations like Indonesia, Australia, and Iran. As the largest producer of fertilizer in the world, China plays a pivotal role in the global phosphates market.
Phosphatic Fertilizer Market in India
India represents the fastest-growing market in the Asia-Pacific region, with a projected growth rate of approximately 7% from 2024 to 2029. The country's growth trajectory is driven by its massive agricultural sector, which contributes significantly to its GDP. India's phosphate fertilizer market is characterized by increasing farmer awareness, government support through subsidies, and the adoption of modern farming practices. The country's focus on achieving fertilizer self-sufficiency, coupled with initiatives to promote balanced nutrient application, positions it as a key growth driver in the regional market.
Phosphatic Fertilizer Industry Overview
Top Companies in Phosphatic Fertilizer Market
The global phosphate fertilizer companies market is characterized by companies focusing on strategic innovation and operational excellence to maintain their competitive edge. Leading players are investing heavily in research and development to create enhanced fertilizer formulations that offer improved nutrient absorption and environmental sustainability. Companies are also strengthening their distribution networks through strategic partnerships and acquisitions, particularly in emerging agricultural markets. Operational agility has become crucial, with manufacturers optimizing their production processes and supply chains to manage raw material costs and ensure consistent product availability. Many players are expanding their geographical presence through greenfield investments and joint ventures, while simultaneously diversifying their product portfolios to include specialty and premium fertilizer variants. Digital transformation initiatives are being undertaken to improve customer service and operational efficiency.
Market Structure Shows Regional Leadership Patterns
The phosphate fertilizer industry exhibits a mix of global conglomerates and regional specialists, with varying degrees of market concentration across different geographical regions. Major global players maintain their dominance through vertical integration, controlling everything from raw material extraction to distribution networks, while regional players leverage their local market knowledge and established farmer relationships. The industry is experiencing ongoing consolidation, particularly in mature markets, as larger companies acquire smaller, specialized producers to expand their product portfolios and geographical reach.
The competitive dynamics are influenced by the presence of state-owned enterprises in key markets, particularly in Asia-Pacific and Eastern Europe, which often receive government support and preferential access to raw materials. Market entry barriers are substantial due to high capital requirements and the need for specialized technical expertise. The industry has witnessed strategic alliances and joint ventures, especially in emerging markets, as companies seek to share risks and leverage complementary strengths in production and distribution.
Innovation and Sustainability Drive Future Success
Success in the phosphatic fertilizer market increasingly depends on companies' ability to develop environmentally sustainable products while maintaining cost competitiveness. Market leaders are investing in advanced production technologies to reduce environmental impact and improve product efficiency. Companies are also focusing on developing specialized products for specific crops and soil conditions, while building stronger relationships with farmers through technical support and digital farming solutions. The ability to manage raw material supply chains and maintain price competitiveness while meeting stringent environmental regulations will be crucial for long-term success.
For new entrants and smaller players, success will depend on identifying and serving niche markets with specialized products and superior customer service. Companies must focus on building strong distribution networks and establishing partnerships with local agricultural organizations. The development of innovative application methods and precision farming solutions presents opportunities for differentiation. Additionally, companies need to prepare for potential regulatory changes regarding environmental protection and fertilizer application standards, while maintaining flexibility in their production processes to adapt to changing market conditions and customer preferences.
Phosphatic Fertilizer Market Leaders
-
Coromandel International Ltd.
-
EuroChem Group
-
Indian Farmers Fertiliser Cooperative Limited
-
Nutrien Ltd.
-
PhosAgro Group of Companies
- *Disclaimer: Major Players sorted in no particular order

Phosphatic Fertilizer Market News
- April 2023: SABIC Agri-Nutrients Company acquired the ETC Group (ETG) with a 49% stake in the ETG Inputs Holdco Limited for a transaction value of USD 320 million. The agreement is part of SABIC Agri-Nutrients Company's strategy to integrate the value chain and distribution of agri-nutrients markets.
- April 2023: K+S acquired a 75% share of the fertilizer business of a South African trading company, Industrial Commodities Holdings (Pty) Ltd (ICH). In addition to expanding the core business, K+S is strengthening its operations in southern and eastern Africa as a result of this acquisition. The newly acquired fertilizer business in the future is to be operated in a joint venture under the name of FertivPty Ltd.
- November 2021: Coromandel International announced a new sulfur acid plant at Visakhapatnam. The plant will have a 1,650 metric ton per day production capacity.
Free With This Report
Along with the report, We also offer a comprehensive and exhaustive data pack with 25+ graphs on area under cultivation and average application rate per hectare. The data pack includes Globe, North America, Europe, Asia-Pacific, South America, and Africa.


List of Tables & Figures
- Figure 1:
- CULTIVATION OF FIELD CROPS IN HECTARE, GLOBAL, 2017 - 2022
- Figure 2:
- CULTIVATION OF HORTICULTURAL CROPS IN HECTARE, GLOBAL, 2017 - 2022
- Figure 3:
- CONSUMPTION OF PRIMARY NUTRIENTS BY FIELD CROPS IN KG/HECTARE, GLOBAL, 2022
- Figure 4:
- CONSUMPTION OF PRIMARY NUTRIENTS BY HORTICULTURAL CROPS IN KG/HECTARE, GLOBAL, 2022
- Figure 5:
- AGRICULTURAL LAND EQUIPPED FOR IRRIGATION IN HECTARE, GLOBAL, 2022
- Figure 6:
- PHOSPHATIC FERTILIZER CONSUMPTION IN METRIC TON, GLOBAL, 2017 - 2030
- Figure 7:
- PHOSPHATIC FERTILIZER CONSUMPTION IN USD, GLOBAL, 2017 - 2030
- Figure 8:
- PHOSPHATIC FERTILIZER CONSUMPTION BY PRODUCT IN METRIC TON, GLOBAL, 2017 - 2030
- Figure 9:
- PHOSPHATIC FERTILIZER CONSUMPTION BY PRODUCT IN USD, GLOBAL, 2017 - 2030
- Figure 10:
- PHOSPHATIC FERTILIZER CONSUMPTION VOLUME BY PRODUCT IN %, GLOBAL, 2017 VS 2023 VS 2030
- Figure 11:
- PHOSPHATIC FERTILIZER CONSUMPTION VALUE BY PRODUCT IN %, GLOBAL, 2017 VS 2023 VS 2030
- Figure 12:
- DAP FERTILIZER CONSUMPTION IN METRIC TON, GLOBAL, 2017 - 2030
- Figure 13:
- DAP FERTILIZER CONSUMPTION IN USD, GLOBAL, 2017 - 2030
- Figure 14:
- DAP FERTILIZER CONSUMPTION VALUE BY CROP TYPE IN %, GLOBAL, 2023 VS 2030
- Figure 15:
- MAP FERTILIZER CONSUMPTION IN METRIC TON, GLOBAL, 2017 - 2030
- Figure 16:
- MAP FERTILIZER CONSUMPTION IN USD, GLOBAL, 2017 - 2030
- Figure 17:
- MAP FERTILIZER CONSUMPTION VALUE BY CROP TYPE IN %, GLOBAL, 2023 VS 2030
- Figure 18:
- SSP FERTILIZER CONSUMPTION IN METRIC TON, GLOBAL, 2017 - 2030
- Figure 19:
- SSP FERTILIZER CONSUMPTION IN USD, GLOBAL, 2017 - 2030
- Figure 20:
- SSP FERTILIZER CONSUMPTION VALUE BY CROP TYPE IN %, GLOBAL, 2023 VS 2030
- Figure 21:
- TSP FERTILIZER CONSUMPTION IN METRIC TON, GLOBAL, 2017 - 2030
- Figure 22:
- TSP FERTILIZER CONSUMPTION IN USD, GLOBAL, 2017 - 2030
- Figure 23:
- TSP FERTILIZER CONSUMPTION VALUE BY CROP TYPE IN %, GLOBAL, 2023 VS 2030
- Figure 24:
- OTHERS FERTILIZER CONSUMPTION IN METRIC TON, GLOBAL, 2017 - 2030
- Figure 25:
- OTHERS FERTILIZER CONSUMPTION IN USD, GLOBAL, 2017 - 2030
- Figure 26:
- OTHERS FERTILIZER CONSUMPTION VALUE BY CROP TYPE IN %, GLOBAL, 2023 VS 2030
- Figure 27:
- PHOSPHATIC PHOSPHATIC FERTILIZER CONSUMPTION BY APPLICATION MODE IN METRIC TON, GLOBAL, 2017 - 2030
- Figure 28:
- PHOSPHATIC PHOSPHATIC FERTILIZER CONSUMPTION BY APPLICATION MODE IN USD, GLOBAL, 2017 - 2030
- Figure 29:
- PHOSPHATIC PHOSPHATIC FERTILIZER CONSUMPTION VOLUME BY APPLICATION MODE IN %, GLOBAL, 2017 VS 2023 VS 2030
- Figure 30:
- PHOSPHATIC PHOSPHATIC FERTILIZER CONSUMPTION VALUE BY APPLICATION MODE IN %, GLOBAL, 2017 VS 2023 VS 2030
- Figure 31:
- FERTIGATION APPLICATION OF PHOSPHATIC FERTILIZER IN METRIC TON, GLOBAL, 2017 - 2030
- Figure 32:
- FERTIGATION APPLICATION OF PHOSPHATIC FERTILIZER IN USD, GLOBAL, 2017 - 2030
- Figure 33:
- FERTIGATION APPLICATION OF PHOSPHATIC FERTILIZER IN VALUE BY CROP TYPE IN %, GLOBAL, 2023 VS 2030
- Figure 34:
- FOLIAR APPLICATION OF PHOSPHATIC FERTILIZER IN METRIC TON, GLOBAL, 2017 - 2030
- Figure 35:
- FOLIAR APPLICATION OF PHOSPHATIC FERTILIZER IN USD, GLOBAL, 2017 - 2030
- Figure 36:
- FOLIAR APPLICATION OF PHOSPHATIC FERTILIZER IN VALUE BY CROP TYPE IN %, GLOBAL, 2023 VS 2030
- Figure 37:
- SOIL APPLICATION OF PHOSPHATIC FERTILIZER IN METRIC TON, GLOBAL, 2017 - 2030
- Figure 38:
- SOIL APPLICATION OF PHOSPHATIC FERTILIZER IN USD, GLOBAL, 2017 - 2030
- Figure 39:
- SOIL APPLICATION OF PHOSPHATIC FERTILIZER IN VALUE BY CROP TYPE IN %, GLOBAL, 2023 VS 2030
- Figure 40:
- PHOSPHATIC PHOSPHATIC FERTILIZER CONSUMPTION BY CROP TYPE IN METRIC TON, GLOBAL, 2017 - 2030
- Figure 41:
- PHOSPHATIC PHOSPHATIC FERTILIZER CONSUMPTION BY CROP TYPE IN USD, GLOBAL, 2017 - 2030
- Figure 42:
- PHOSPHATIC PHOSPHATIC FERTILIZER CONSUMPTION VOLUME BY CROP TYPE IN %, GLOBAL, 2017 VS 2023 VS 2030
- Figure 43:
- PHOSPHATIC PHOSPHATIC FERTILIZER CONSUMPTION VALUE BY CROP TYPE IN %, GLOBAL, 2017 VS 2023 VS 2030
- Figure 44:
- PHOSPHATIC FERTILIZER CONSUMPTION BY FIELD CROPS IN METRIC TON, GLOBAL, 2017 - 2030
- Figure 45:
- PHOSPHATIC FERTILIZER CONSUMPTION BY FIELD CROPS IN USD, GLOBAL, 2017 - 2030
- Figure 46:
- PHOSPHATIC FERTILIZER CONSUMPTION VALUE BY PRODUCT IN %, GLOBAL, 2023 VS 2030
- Figure 47:
- PHOSPHATIC FERTILIZER CONSUMPTION BY HORTICULTURAL CROPS IN METRIC TON, GLOBAL, 2017 - 2030
- Figure 48:
- PHOSPHATIC FERTILIZER CONSUMPTION BY HORTICULTURAL CROPS IN USD, GLOBAL, 2017 - 2030
- Figure 49:
- PHOSPHATIC FERTILIZER CONSUMPTION VALUE BY PRODUCT IN %, GLOBAL, 2023 VS 2030
- Figure 50:
- PHOSPHATIC FERTILIZER CONSUMPTION BY TURF & ORNAMENTAL IN METRIC TON, GLOBAL, 2017 - 2030
- Figure 51:
- PHOSPHATIC FERTILIZER CONSUMPTION BY TURF & ORNAMENTAL IN USD, GLOBAL, 2017 - 2030
- Figure 52:
- PHOSPHATIC FERTILIZER CONSUMPTION VALUE BY PRODUCT IN %, GLOBAL, 2023 VS 2030
- Figure 53:
- PHOSPHATIC PHOSPHATIC FERTILIZER CONSUMPTION BY REGION IN METRIC TON, GLOBAL, 2017 - 2030
- Figure 54:
- PHOSPHATIC PHOSPHATIC FERTILIZER CONSUMPTION BY REGION IN USD, GLOBAL, 2017 - 2030
- Figure 55:
- PHOSPHATIC PHOSPHATIC FERTILIZER CONSUMPTION VOLUME BY REGION IN %, GLOBAL, 2017 VS 2023 VS 2030
- Figure 56:
- PHOSPHATIC PHOSPHATIC FERTILIZER CONSUMPTION VALUE BY REGION IN %, GLOBAL, 2017 VS 2023 VS 2030
- Figure 57:
- PHOSPHATIC PHOSPHATIC FERTILIZER CONSUMPTION BY COUNTRY IN METRIC TON, ASIA-PACIFIC, 2017 - 2030
- Figure 58:
- PHOSPHATIC PHOSPHATIC FERTILIZER CONSUMPTION BY COUNTRY IN USD, ASIA-PACIFIC, 2017 - 2030
- Figure 59:
- PHOSPHATIC PHOSPHATIC FERTILIZER CONSUMPTION VOLUME BY COUNTRY IN %, ASIA-PACIFIC, 2017 VS 2023 VS 2030
- Figure 60:
- PHOSPHATIC PHOSPHATIC FERTILIZER CONSUMPTION VALUE BY COUNTRY IN %, ASIA-PACIFIC, 2017 VS 2023 VS 2030
- Figure 61:
- PHOSPHATIC FERTILIZER CONSUMPTION IN METRIC TON, AUSTRALIA, 2017 - 2030
- Figure 62:
- PHOSPHATIC FERTILIZER CONSUMPTION IN USD, AUSTRALIA, 2017 - 2030
- Figure 63:
- PHOSPHATIC FERTILIZER CONSUMPTION VALUE BY CROP TYPE IN %, AUSTRALIA, 2023 VS 2030
- Figure 64:
- PHOSPHATIC FERTILIZER CONSUMPTION IN METRIC TON, BANGLADESH, 2017 - 2030
- Figure 65:
- PHOSPHATIC FERTILIZER CONSUMPTION IN USD, BANGLADESH, 2017 - 2030
- Figure 66:
- PHOSPHATIC FERTILIZER CONSUMPTION VALUE BY CROP TYPE IN %, BANGLADESH, 2023 VS 2030
- Figure 67:
- PHOSPHATIC FERTILIZER CONSUMPTION IN METRIC TON, CHINA, 2017 - 2030
- Figure 68:
- PHOSPHATIC FERTILIZER CONSUMPTION IN USD, CHINA, 2017 - 2030
- Figure 69:
- PHOSPHATIC FERTILIZER CONSUMPTION VALUE BY CROP TYPE IN %, CHINA, 2023 VS 2030
- Figure 70:
- PHOSPHATIC FERTILIZER CONSUMPTION IN METRIC TON, INDIA, 2017 - 2030
- Figure 71:
- PHOSPHATIC FERTILIZER CONSUMPTION IN USD, INDIA, 2017 - 2030
- Figure 72:
- PHOSPHATIC FERTILIZER CONSUMPTION VALUE BY CROP TYPE IN %, INDIA, 2023 VS 2030
- Figure 73:
- PHOSPHATIC FERTILIZER CONSUMPTION IN METRIC TON, INDONESIA, 2017 - 2030
- Figure 74:
- PHOSPHATIC FERTILIZER CONSUMPTION IN USD, INDONESIA, 2017 - 2030
- Figure 75:
- PHOSPHATIC FERTILIZER CONSUMPTION VALUE BY CROP TYPE IN %, INDONESIA, 2023 VS 2030
- Figure 76:
- PHOSPHATIC FERTILIZER CONSUMPTION IN METRIC TON, JAPAN, 2017 - 2030
- Figure 77:
- PHOSPHATIC FERTILIZER CONSUMPTION IN USD, JAPAN, 2017 - 2030
- Figure 78:
- PHOSPHATIC FERTILIZER CONSUMPTION VALUE BY CROP TYPE IN %, JAPAN, 2023 VS 2030
- Figure 79:
- PHOSPHATIC FERTILIZER CONSUMPTION IN METRIC TON, PAKISTAN, 2017 - 2030
- Figure 80:
- PHOSPHATIC FERTILIZER CONSUMPTION IN USD, PAKISTAN, 2017 - 2030
- Figure 81:
- PHOSPHATIC FERTILIZER CONSUMPTION VALUE BY CROP TYPE IN %, PAKISTAN, 2023 VS 2030
- Figure 82:
- PHOSPHATIC FERTILIZER CONSUMPTION IN METRIC TON, PHILIPPINES, 2017 - 2030
- Figure 83:
- PHOSPHATIC FERTILIZER CONSUMPTION IN USD, PHILIPPINES, 2017 - 2030
- Figure 84:
- PHOSPHATIC FERTILIZER CONSUMPTION VALUE BY CROP TYPE IN %, PHILIPPINES, 2023 VS 2030
- Figure 85:
- PHOSPHATIC FERTILIZER CONSUMPTION IN METRIC TON, THAILAND, 2017 - 2030
- Figure 86:
- PHOSPHATIC FERTILIZER CONSUMPTION IN USD, THAILAND, 2017 - 2030
- Figure 87:
- PHOSPHATIC FERTILIZER CONSUMPTION VALUE BY CROP TYPE IN %, THAILAND, 2023 VS 2030
- Figure 88:
- PHOSPHATIC FERTILIZER CONSUMPTION IN METRIC TON, VIETNAM, 2017 - 2030
- Figure 89:
- PHOSPHATIC FERTILIZER CONSUMPTION IN USD, VIETNAM, 2017 - 2030
- Figure 90:
- PHOSPHATIC FERTILIZER CONSUMPTION VALUE BY CROP TYPE IN %, VIETNAM, 2023 VS 2030
- Figure 91:
- PHOSPHATIC FERTILIZER CONSUMPTION IN METRIC TON, REST OF ASIA-PACIFIC, 2017 - 2030
- Figure 92:
- PHOSPHATIC FERTILIZER CONSUMPTION IN USD, REST OF ASIA-PACIFIC, 2017 - 2030
- Figure 93:
- PHOSPHATIC FERTILIZER CONSUMPTION VALUE BY CROP TYPE IN %, REST OF ASIA-PACIFIC, 2023 VS 2030
- Figure 94:
- PHOSPHATIC PHOSPHATIC FERTILIZER CONSUMPTION BY COUNTRY IN METRIC TON, EUROPE, 2017 - 2030
- Figure 95:
- PHOSPHATIC PHOSPHATIC FERTILIZER CONSUMPTION BY COUNTRY IN USD, EUROPE, 2017 - 2030
- Figure 96:
- PHOSPHATIC PHOSPHATIC FERTILIZER CONSUMPTION VOLUME BY COUNTRY IN %, EUROPE, 2017 VS 2023 VS 2030
- Figure 97:
- PHOSPHATIC PHOSPHATIC FERTILIZER CONSUMPTION VALUE BY COUNTRY IN %, EUROPE, 2017 VS 2023 VS 2030
- Figure 98:
- PHOSPHATIC FERTILIZER CONSUMPTION IN METRIC TON, FRANCE, 2017 - 2030
- Figure 99:
- PHOSPHATIC FERTILIZER CONSUMPTION IN USD, FRANCE, 2017 - 2030
- Figure 100:
- PHOSPHATIC FERTILIZER CONSUMPTION VALUE BY CROP TYPE IN %, FRANCE, 2023 VS 2030
- Figure 101:
- PHOSPHATIC FERTILIZER CONSUMPTION IN METRIC TON, GERMANY, 2017 - 2030
- Figure 102:
- PHOSPHATIC FERTILIZER CONSUMPTION IN USD, GERMANY, 2017 - 2030
- Figure 103:
- PHOSPHATIC FERTILIZER CONSUMPTION VALUE BY CROP TYPE IN %, GERMANY, 2023 VS 2030
- Figure 104:
- PHOSPHATIC FERTILIZER CONSUMPTION IN METRIC TON, ITALY, 2017 - 2030
- Figure 105:
- PHOSPHATIC FERTILIZER CONSUMPTION IN USD, ITALY, 2017 - 2030
- Figure 106:
- PHOSPHATIC FERTILIZER CONSUMPTION VALUE BY CROP TYPE IN %, ITALY, 2023 VS 2030
- Figure 107:
- PHOSPHATIC FERTILIZER CONSUMPTION IN METRIC TON, NETHERLANDS, 2017 - 2030
- Figure 108:
- PHOSPHATIC FERTILIZER CONSUMPTION IN USD, NETHERLANDS, 2017 - 2030
- Figure 109:
- PHOSPHATIC FERTILIZER CONSUMPTION VALUE BY CROP TYPE IN %, NETHERLANDS, 2023 VS 2030
- Figure 110:
- PHOSPHATIC FERTILIZER CONSUMPTION IN METRIC TON, RUSSIA, 2017 - 2030
- Figure 111:
- PHOSPHATIC FERTILIZER CONSUMPTION IN USD, RUSSIA, 2017 - 2030
- Figure 112:
- PHOSPHATIC FERTILIZER CONSUMPTION VALUE BY CROP TYPE IN %, RUSSIA, 2023 VS 2030
- Figure 113:
- PHOSPHATIC FERTILIZER CONSUMPTION IN METRIC TON, SPAIN, 2017 - 2030
- Figure 114:
- PHOSPHATIC FERTILIZER CONSUMPTION IN USD, SPAIN, 2017 - 2030
- Figure 115:
- PHOSPHATIC FERTILIZER CONSUMPTION VALUE BY CROP TYPE IN %, SPAIN, 2023 VS 2030
- Figure 116:
- PHOSPHATIC FERTILIZER CONSUMPTION IN METRIC TON, UKRAINE, 2017 - 2030
- Figure 117:
- PHOSPHATIC FERTILIZER CONSUMPTION IN USD, UKRAINE, 2017 - 2030
- Figure 118:
- PHOSPHATIC FERTILIZER CONSUMPTION VALUE BY CROP TYPE IN %, UKRAINE, 2023 VS 2030
- Figure 119:
- PHOSPHATIC FERTILIZER CONSUMPTION IN METRIC TON, UNITED KINGDOM, 2017 - 2030
- Figure 120:
- PHOSPHATIC FERTILIZER CONSUMPTION IN USD, UNITED KINGDOM, 2017 - 2030
- Figure 121:
- PHOSPHATIC FERTILIZER CONSUMPTION VALUE BY CROP TYPE IN %, UNITED KINGDOM, 2023 VS 2030
- Figure 122:
- PHOSPHATIC FERTILIZER CONSUMPTION IN METRIC TON, REST OF EUROPE, 2017 - 2030
- Figure 123:
- PHOSPHATIC FERTILIZER CONSUMPTION IN USD, REST OF EUROPE, 2017 - 2030
- Figure 124:
- PHOSPHATIC FERTILIZER CONSUMPTION VALUE BY CROP TYPE IN %, REST OF EUROPE, 2023 VS 2030
- Figure 125:
- PHOSPHATIC PHOSPHATIC FERTILIZER CONSUMPTION BY COUNTRY IN METRIC TON, MIDDLE EAST & AFRICA, 2017 - 2030
- Figure 126:
- PHOSPHATIC PHOSPHATIC FERTILIZER CONSUMPTION BY COUNTRY IN USD, MIDDLE EAST & AFRICA, 2017 - 2030
- Figure 127:
- PHOSPHATIC PHOSPHATIC FERTILIZER CONSUMPTION VOLUME BY COUNTRY IN %, MIDDLE EAST & AFRICA, 2017 VS 2023 VS 2030
- Figure 128:
- PHOSPHATIC PHOSPHATIC FERTILIZER CONSUMPTION VALUE BY COUNTRY IN %, MIDDLE EAST & AFRICA, 2017 VS 2023 VS 2030
- Figure 129:
- PHOSPHATIC FERTILIZER CONSUMPTION IN METRIC TON, NIGERIA, 2017 - 2030
- Figure 130:
- PHOSPHATIC FERTILIZER CONSUMPTION IN USD, NIGERIA, 2017 - 2030
- Figure 131:
- PHOSPHATIC FERTILIZER CONSUMPTION VALUE BY CROP TYPE IN %, NIGERIA, 2023 VS 2030
- Figure 132:
- PHOSPHATIC FERTILIZER CONSUMPTION IN METRIC TON, SAUDI ARABIA, 2017 - 2030
- Figure 133:
- PHOSPHATIC FERTILIZER CONSUMPTION IN USD, SAUDI ARABIA, 2017 - 2030
- Figure 134:
- PHOSPHATIC FERTILIZER CONSUMPTION VALUE BY CROP TYPE IN %, SAUDI ARABIA, 2023 VS 2030
- Figure 135:
- PHOSPHATIC FERTILIZER CONSUMPTION IN METRIC TON, SOUTH AFRICA, 2017 - 2030
- Figure 136:
- PHOSPHATIC FERTILIZER CONSUMPTION IN USD, SOUTH AFRICA, 2017 - 2030
- Figure 137:
- PHOSPHATIC FERTILIZER CONSUMPTION VALUE BY CROP TYPE IN %, SOUTH AFRICA, 2023 VS 2030
- Figure 138:
- PHOSPHATIC FERTILIZER CONSUMPTION IN METRIC TON, TURKEY, 2017 - 2030
- Figure 139:
- PHOSPHATIC FERTILIZER CONSUMPTION IN USD, TURKEY, 2017 - 2030
- Figure 140:
- PHOSPHATIC FERTILIZER CONSUMPTION VALUE BY CROP TYPE IN %, TURKEY, 2023 VS 2030
- Figure 141:
- PHOSPHATIC FERTILIZER CONSUMPTION IN METRIC TON, REST OF MIDDLE EAST & AFRICA, 2017 - 2030
- Figure 142:
- PHOSPHATIC FERTILIZER CONSUMPTION IN USD, REST OF MIDDLE EAST & AFRICA, 2017 - 2030
- Figure 143:
- PHOSPHATIC FERTILIZER CONSUMPTION VALUE BY CROP TYPE IN %, REST OF MIDDLE EAST & AFRICA, 2023 VS 2030
- Figure 144:
- PHOSPHATIC PHOSPHATIC FERTILIZER CONSUMPTION BY COUNTRY IN METRIC TON, NORTH AMERICA, 2017 - 2030
- Figure 145:
- PHOSPHATIC PHOSPHATIC FERTILIZER CONSUMPTION BY COUNTRY IN USD, NORTH AMERICA, 2017 - 2030
- Figure 146:
- PHOSPHATIC PHOSPHATIC FERTILIZER CONSUMPTION VOLUME BY COUNTRY IN %, NORTH AMERICA, 2017 VS 2023 VS 2030
- Figure 147:
- PHOSPHATIC PHOSPHATIC FERTILIZER CONSUMPTION VALUE BY COUNTRY IN %, NORTH AMERICA, 2017 VS 2023 VS 2030
- Figure 148:
- PHOSPHATIC FERTILIZER CONSUMPTION IN METRIC TON, CANADA, 2017 - 2030
- Figure 149:
- PHOSPHATIC FERTILIZER CONSUMPTION IN USD, CANADA, 2017 - 2030
- Figure 150:
- PHOSPHATIC FERTILIZER CONSUMPTION VALUE BY CROP TYPE IN %, CANADA, 2023 VS 2030
- Figure 151:
- PHOSPHATIC FERTILIZER CONSUMPTION IN METRIC TON, MEXICO, 2017 - 2030
- Figure 152:
- PHOSPHATIC FERTILIZER CONSUMPTION IN USD, MEXICO, 2017 - 2030
- Figure 153:
- PHOSPHATIC FERTILIZER CONSUMPTION VALUE BY CROP TYPE IN %, MEXICO, 2023 VS 2030
- Figure 154:
- PHOSPHATIC FERTILIZER CONSUMPTION IN METRIC TON, UNITED STATES, 2017 - 2030
- Figure 155:
- PHOSPHATIC FERTILIZER CONSUMPTION IN USD, UNITED STATES, 2017 - 2030
- Figure 156:
- PHOSPHATIC FERTILIZER CONSUMPTION VALUE BY CROP TYPE IN %, UNITED STATES, 2023 VS 2030
- Figure 157:
- PHOSPHATIC FERTILIZER CONSUMPTION IN METRIC TON, REST OF NORTH AMERICA, 2017 - 2030
- Figure 158:
- PHOSPHATIC FERTILIZER CONSUMPTION IN USD, REST OF NORTH AMERICA, 2017 - 2030
- Figure 159:
- PHOSPHATIC FERTILIZER CONSUMPTION VALUE BY CROP TYPE IN %, REST OF NORTH AMERICA, 2023 VS 2030
- Figure 160:
- PHOSPHATIC PHOSPHATIC FERTILIZER CONSUMPTION BY COUNTRY IN METRIC TON, SOUTH AMERICA, 2017 - 2030
- Figure 161:
- PHOSPHATIC PHOSPHATIC FERTILIZER CONSUMPTION BY COUNTRY IN USD, SOUTH AMERICA, 2017 - 2030
- Figure 162:
- PHOSPHATIC PHOSPHATIC FERTILIZER CONSUMPTION VOLUME BY COUNTRY IN %, SOUTH AMERICA, 2017 VS 2023 VS 2030
- Figure 163:
- PHOSPHATIC PHOSPHATIC FERTILIZER CONSUMPTION VALUE BY COUNTRY IN %, SOUTH AMERICA, 2017 VS 2023 VS 2030
- Figure 164:
- PHOSPHATIC FERTILIZER CONSUMPTION IN METRIC TON, ARGENTINA, 2017 - 2030
- Figure 165:
- PHOSPHATIC FERTILIZER CONSUMPTION IN USD, ARGENTINA, 2017 - 2030
- Figure 166:
- PHOSPHATIC FERTILIZER CONSUMPTION VALUE BY CROP TYPE IN %, ARGENTINA, 2023 VS 2030
- Figure 167:
- PHOSPHATIC FERTILIZER CONSUMPTION IN METRIC TON, BRAZIL, 2017 - 2030
- Figure 168:
- PHOSPHATIC FERTILIZER CONSUMPTION IN USD, BRAZIL, 2017 - 2030
- Figure 169:
- PHOSPHATIC FERTILIZER CONSUMPTION VALUE BY CROP TYPE IN %, BRAZIL, 2023 VS 2030
- Figure 170:
- PHOSPHATIC FERTILIZER CONSUMPTION IN METRIC TON, REST OF SOUTH AMERICA, 2017 - 2030
- Figure 171:
- PHOSPHATIC FERTILIZER CONSUMPTION IN USD, REST OF SOUTH AMERICA, 2017 - 2030
- Figure 172:
- PHOSPHATIC FERTILIZER CONSUMPTION VALUE BY CROP TYPE IN %, REST OF SOUTH AMERICA, 2023 VS 2030
- Figure 173:
- MOST ACTIVE COMPANIES BY NUMBER OF STRATEGIC MOVES, GLOBAL, 2017 - 2030
- Figure 174:
- GLOBAL PHOSPHATIC FERTILIZER MARKET, MOST ADOPTED STRATEGIES, 2018 - 2021
- Figure 175:
- MARKET SHARE OF MAJOR PLAYERS IN %, GLOBAL
Phosphatic Fertilizer Industry Segmentation
Straight are covered as segments by Type. Fertigation, Foliar, Soil are covered as segments by Application Mode. Field Crops, Horticultural Crops, Turf & Ornamental are covered as segments by Crop Type. Asia-Pacific, Europe, Middle East & Africa, North America, South America are covered as segments by Region.| Type | Straight | Phosphatic | DAP |
| MAP | |||
| SSP | |||
| TSP | |||
| Others | |||
| Application Mode | Fertigation | ||
| Foliar | |||
| Soil | |||
| Crop Type | Field Crops | ||
| Horticultural Crops | |||
| Turf & Ornamental | |||
| Region | Asia-Pacific | Australia | |
| Bangladesh | |||
| China | |||
| India | |||
| Indonesia | |||
| Japan | |||
| Pakistan | |||
| Philippines | |||
| Thailand | |||
| Vietnam | |||
| Rest of Asia-Pacific | |||
| Europe | France | ||
| Germany | |||
| Italy | |||
| Netherlands | |||
| Russia | |||
| Spain | |||
| Ukraine | |||
| United Kingdom | |||
| Rest of Europe | |||
| Middle East & Africa | Nigeria | ||
| Saudi Arabia | |||
| South Africa | |||
| Turkey | |||
| Rest of Middle East & Africa | |||
| North America | Canada | ||
| Mexico | |||
| United States | |||
| Rest of North America | |||
| South America | Argentina | ||
| Brazil | |||
| Rest of South America | |||
| Straight | Phosphatic | DAP |
| MAP | ||
| SSP | ||
| TSP | ||
| Others |
| Fertigation |
| Foliar |
| Soil |
| Field Crops |
| Horticultural Crops |
| Turf & Ornamental |
| Asia-Pacific | Australia |
| Bangladesh | |
| China | |
| India | |
| Indonesia | |
| Japan | |
| Pakistan | |
| Philippines | |
| Thailand | |
| Vietnam | |
| Rest of Asia-Pacific | |
| Europe | France |
| Germany | |
| Italy | |
| Netherlands | |
| Russia | |
| Spain | |
| Ukraine | |
| United Kingdom | |
| Rest of Europe | |
| Middle East & Africa | Nigeria |
| Saudi Arabia | |
| South Africa | |
| Turkey | |
| Rest of Middle East & Africa | |
| North America | Canada |
| Mexico | |
| United States | |
| Rest of North America | |
| South America | Argentina |
| Brazil | |
| Rest of South America |
Market Definition
- MARKET ESTIMATION LEVEL - Market Estimations for various types of fertilizers has been done at the product-level and not at the nutrient-level.
- NUTRIENT TYPES COVERED - All Phosphorus Fertilizers
- AVERAGE NUTRIENT APPLICATION RATE - This refers to the average volume of nutrient consumed per hectare of farmland in each country.
- CROP TYPES COVERED - Field Crops: Cereals, Pulses, Oilseeds, and Fiber Crops Horticulture: Fruits, Vegetables, Plantation Crops and Spices, Turf Grass and Ornamentals
| Keyword | Definition |
|---|---|
| Fertilizer | Chemical substance applied to crops to ensure nutritional requirements, available in various forms such as granules, powders, liquid, water soluble, etc. |
| Specialty Fertilizer | Used for enhanced efficiency and nutrient availability applied through soil, foliar, and fertigation. Includes CRF, SRF, liquid fertilizer, and water soluble fertilizers. |
| Controlled-Release Fertilizers (CRF) | Coated with materials such as polymer, polymer-sulfur, and other materials such as resins to ensure nutrient availability to the crop for its entire life cycle. |
| Slow-Release Fertilizers (SRF) | Coated with materials such as sulfur, neem, etc., to ensure nutrient availability to the crop for a longer period. |
| Foliar Fertilizers | Consist of both liquid and water soluble fertilizers applied through foliar application. |
| Water-Soluble Fertilizers | Available in various forms including liquid, powder, etc., used in foliar and fertigation mode of fertilizer application. |
| Fertigation | Fertilizers applied through different irrigation systems such as drip irrigation, micro irrigation, sprinkler irrigation, etc. |
| Anhydrous Ammonia | Used as fertilizer, directly injected into the soil, available in gaseous liquid form. |
| Single Super Phosphate (SSP) | Phosphorus fertilizer containing only phosphorus which has lesser than or equal to 35%. |
| Triple Super Phosphate (TSP) | Phosphorus fertilizer containing only phosphorus greater than 35%. |
| Enhanced Efficiency Fertilizers | Fertilizers coated or treated with additional layers of various ingredients to make it more efficient compared to other fertilizers. |
| Conventional Fertilizer | Fertilizers applied to crops through traditional methods including broadcasting, row placement, ploughing soil placement, etc. |
| Chelated Micronutrients | Micronutrient fertilizers coated with chelating agents such as EDTA, EDDHA, DTPA, HEDTA, etc. |
| Liquid Fertilizers | Available in liquid form, majorly used for application of fertilizers to crops through foliar and fertigation. |
Research Methodology
Mordor Intelligence follows a four-step methodology in all our reports.
- Step-1: IDENTIFY KEY VARIABLES: In order to build a robust forecasting methodology, the variables and factors identified in Step-1 are tested against available historical market numbers. Through an iterative process, the variables required for market forecast are set and the model is built on the basis of these variables.
- Step-2: Build a Market Model: Market-size estimations for the forecast years are in nominal terms. Inflation is not a part of the pricing, and the average selling price (ASP) is kept constant throughout the forecast period for each country.
- Step-3: Validate and Finalize: In this important step, all market numbers, variables and analyst calls are validated through an extensive network of primary research experts from the market studied. The respondents are selected across levels and functions to generate a holistic picture of the market studied.
- Step-4: Research Outputs: Syndicated Reports, Custom Consulting Assignments, Databases & Subscription Platforms


