
3D Sensor Market Size and Share
Market Overview
| Study Period | 2020 - 2031 |
|---|---|
| Market Size (2026) | USD 7.84 Billion |
| Market Size (2031) | USD 12.87 Billion |
| Growth Rate (2026 - 2031) | 10.41 % |
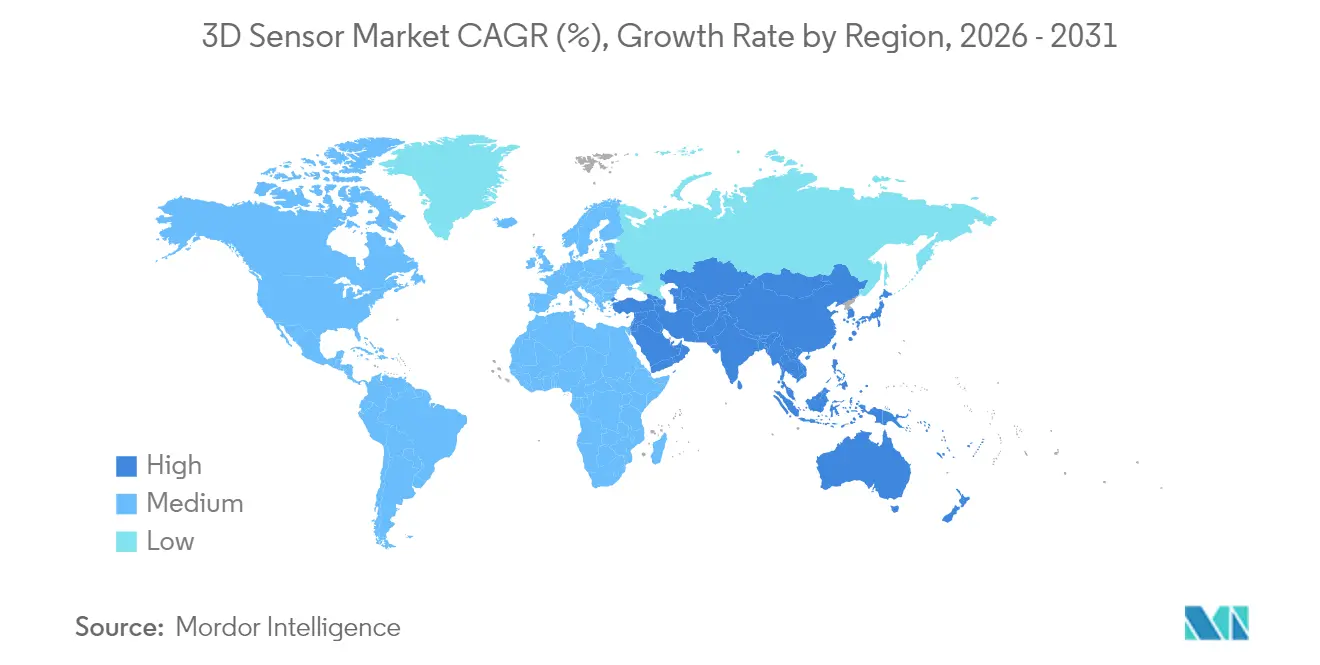
| Fastest Growing Market | Asia-Pacific |
| Largest Market | North America |
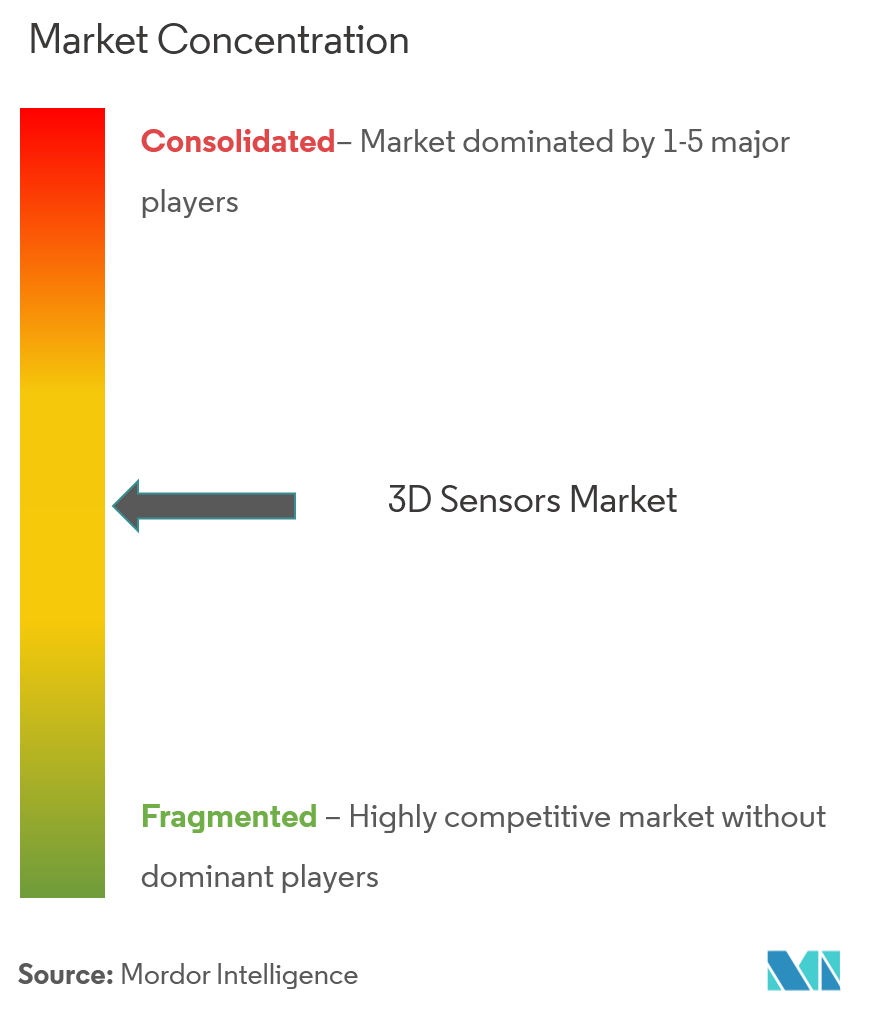
| Market Concentration | Medium |
Major Players *Disclaimer: Major Players sorted in no particular order Image © Mordor Intelligence. Reuse requires attribution under CC BY 4.0. | |
3D Sensor Market Analysis by Mordor Intelligence
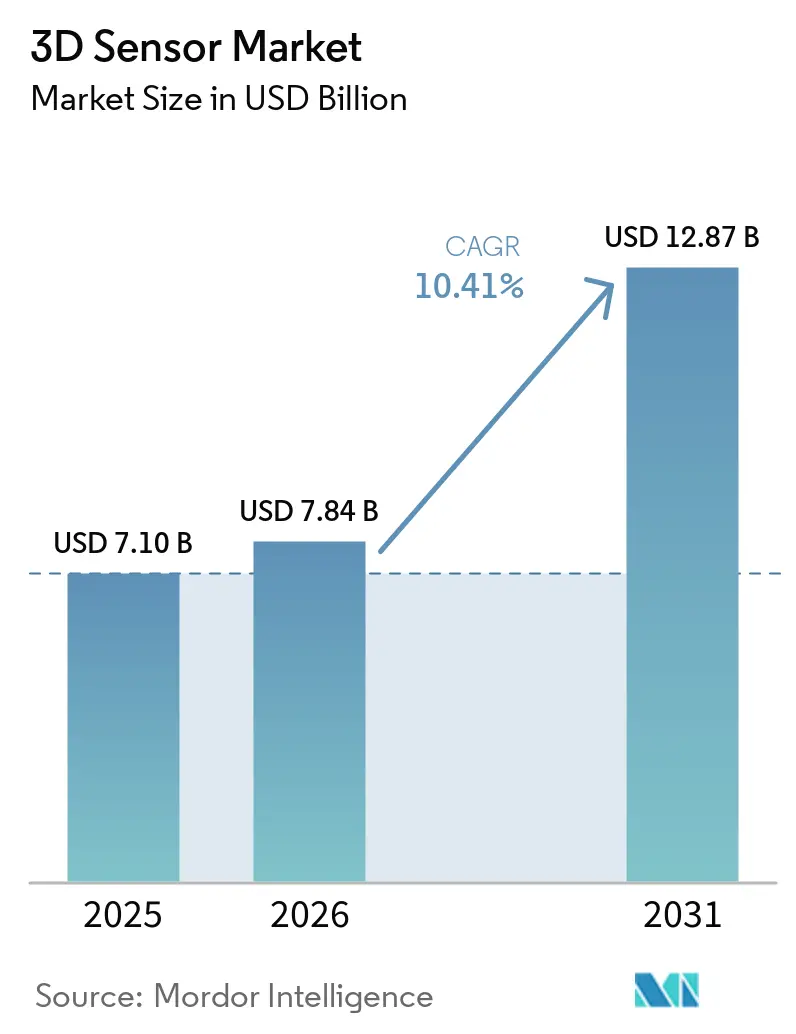
The 3D Sensor Market size is expected to grow from USD 7.10 billion in 2025 to USD 7.84 billion in 2026 and is forecast to reach USD 12.87 billion by 2031 at 10.41% CAGR over 2026-2031. Growth is anchored in rising demand for spatial awareness across consumer electronics, automotive safety, industrial automation, and emerging mixed-reality platforms. Miniaturization of optical components, integration of on-sensor edge processing, and falling unit costs are enlarging the addressable base of applications. Regional momentum is strongest in Asia-Pacific, where deep electronics manufacturing capacity shortens design-to-production cycles, while government-backed smart-city spending is accelerating adoption in the Middle East. Competitive differentiation is now moving from discrete hardware specifications toward complete sensing-plus-software stacks that reduce latency and power consumption in embedded environments.
Key Report Takeaways
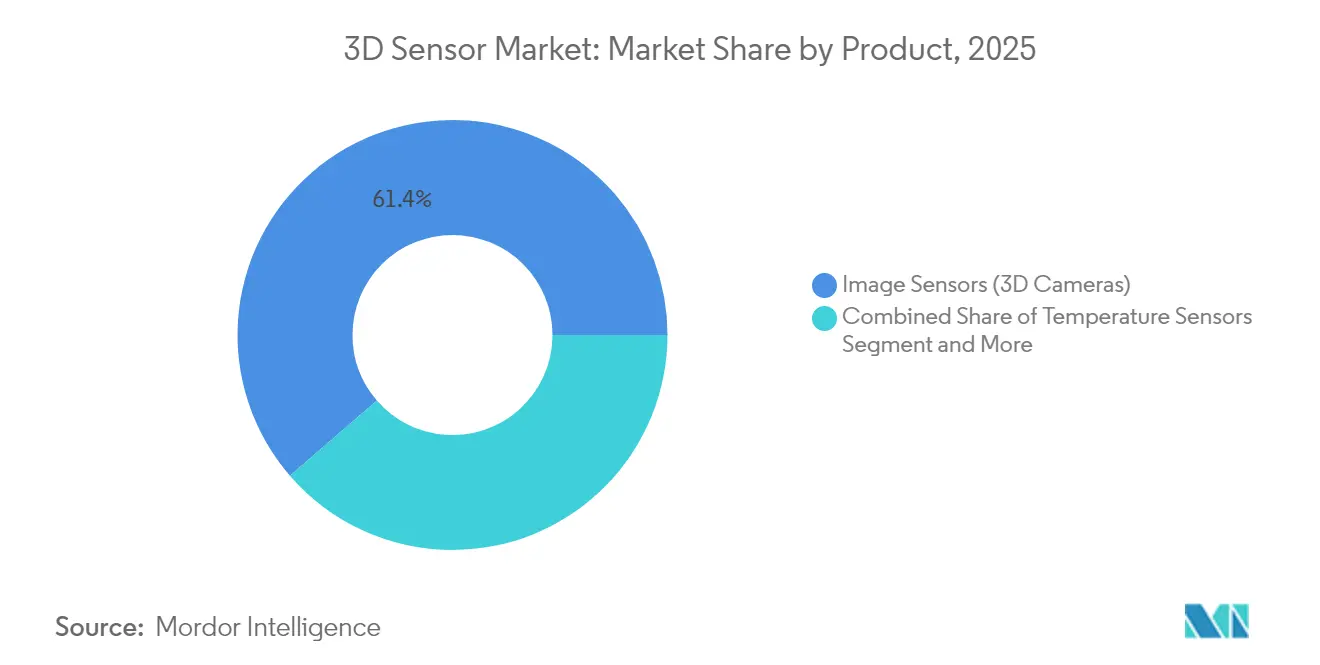
- By product type, Image Sensors captured 61.35% of the 3D sensor market share in 2025; Gesture-Recognition Sensors are on track for a 14.21% CAGR through 2031.
- By technology, Time-of-Flight devices led with 45.55% revenue share in 2025; LiDAR is projected to expand at a 13.22% CAGR to 2031.
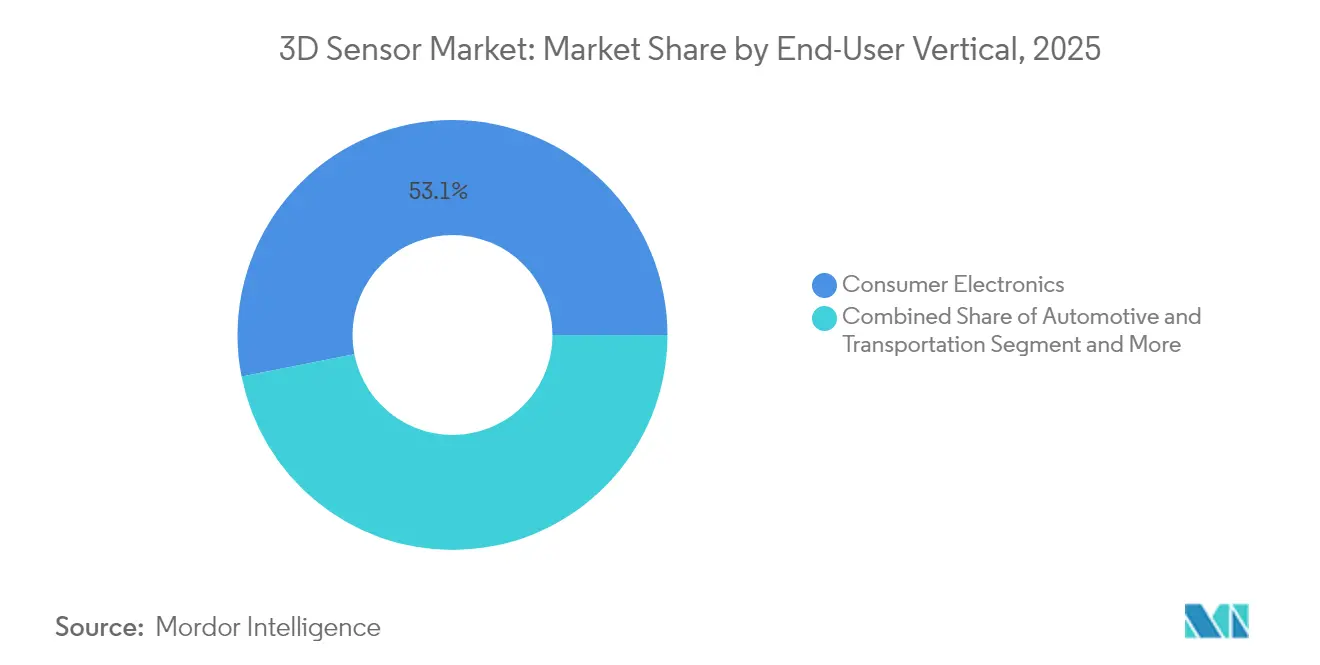
- By end-user vertical, Consumer Electronics held 53.10% of the 3D sensor market size in 2025, while Automotive and Transportation is advancing at a 15.02% CAGR to 2031.
- By component, depth image sensors captured 23.65% of 2025 component revenue, the highest 3D sensor market share among individual parts of the sensing stack, Optics and filters form the fastest-growing component group, advancing at a 11.62% CAGR through 2031.
- By geography, Asia-Pacific accounted for 37.40% of total revenue in 2025; the Middle East is forecast to post a 12.48% CAGR between 2026-2031.
- The top five suppliers—Intel, Sony, STMicroelectronics, Lumentum, and ams OSRAM—collectively generated nearly 45% of global revenue in 2024.
Note: Market size and forecast figures in this report are generated using Mordor Intelligence’s proprietary estimation framework, updated with the latest available data and insights as of 2026.
Market Trends and Insights
Drivers Impact Analysis of 3D Sensor Market*
| DRIVER | (~) % IMPACT ON CAGR FORECAST | GEOGRAPHIC RELEVANCE | IMPACT TIMELINE |
|---|---|---|---|
| Smartphone Facial Recognition Adoption (Asia) | +2.3% | Asia-Pacific, with spillover to North America | Medium term (2–4 years) |
| Automotive LiDAR-Assisted ADAS Roll-outs (Europe) | +2.8% | Europe, North America, expanding to Asia | Long term (≥ 4 years) |
| Proliferation of Depth-Sensing Cameras in AR/VR Headsets (US) | +1.9% | North America, expanding globally | Medium term (2–4 years) |
| Deployment of Collaborative Robots in Electronics Assembly (South Korea, Taiwan) | +1.6% | East Asia, expanding to Southeast Asia | Medium term (2–4 years) |
| Edge-AI Powered 3D Vision for Smart Retail (GCC) | +1.2% | Middle East, expanding to Europe and Asia | Short term (≤ 2 years) |
| Integration of 3D Sensors in Security and Surveillance Systems | +1.5% | Global, with strong adoption in urban infrastructure | Short term (≤ 2 years) |
| Source: Mordor Intelligence | |||
Smartphone facial recognition adoption fuels regional leadership
Premium handsets in Asia are expected to pass a 65% attachment rate for 3D facial recognition by 2026, consolidating the 3D sensor market’s largest single application base. Structured-light and Time-of-Flight modules now generate sub-millimeter depth maps reliable under varied lighting, enabling secure payments, avatar creation, and personalized UI.[1]Apple Inc., “Under-Display Depth-Sensing Patent Application,” patents.apple.com Asian OEMs have moved sensors beneath the display to save frontage without sacrificing robustness. Volume scaling in handset production is lowering component costs for adjacent sectors such as wearables and smart-home devices, reinforcing a virtuous demand cycle.
Automotive LiDAR transforms vehicle-safety benchmarks
European automakers are installing LiDAR-based ADAS ahead of the 2026 NCAP mandate for pedestrian automatic emergency braking.[2]Hesai Technologies, “Hesai Technologies Reports Record LiDAR Shipments,” hesai.com Solid-state designs deliver centimeter-level accuracy at up to 200 m, meeting stringent automotive reliability tests while shrinking bill-of-materials. The regulatory push in Europe is echoed by voluntary commitments in North America, creating a homogeneous requirements profile that benefits global tier-one sensor suppliers. As cost curves decline, LiDAR uptake is expected to cascade from premium models into mid-segment vehicles, enlarging the 3D sensor market addressable volume.
Proliferation of depth-sensing cameras in mixed-reality headsets
Latest head-mounted displays integrate as many as six synchronized depth cameras to power room-scale mapping, hand tracking, and scene reconstruction. The resulting real-time point clouds allow developers to overlay digital content that respects physical occlusion and user movement. Miniaturized optics and power-optimized VCSEL emitters have made all-day-wearable designs feasible, expanding demand beyond entertainment into medical training, remote collaboration, and field services.[3] IEEE Photonics Society, “IEEE Photonics Society Announces Breakthrough in High Resolution Dynamic 3D Vision Technology,” ieeephotonics.org North American device makers continue to prioritize in-house silicon and optics to secure supply and protect IP.
Collaborative robots advance precision electronics assembly
Cobots equipped with 3D vision are taking over board-mounting, screw-driving, and inspection tasks in South Korean and Taiwanese factories. Vision-guided manipulation reduces setup time and compensates for placement tolerances at sub-millimeter scale, cutting defect rates and enabling small-batch customization. Local integrators bundle sensors with intuitive programming interfaces, broadening adoption among mid-sized contract manufacturers. As labor availability tightens, cobot deployments create a recurring pull on the 3D sensor market for both new installations and retrofits.
Restraints Impact Analysis of 3D Sensor Market*
| RESTRAINTS | (~) % IMPACT ON CAGR FORECAST | GEOGRAPHIC RELEVANCE | IMPACT TIMELINE |
|---|---|---|---|
| Thermal Management Challenges in Miniaturised VCSEL Arrays | -1.3% | Global, particularly affecting consumer electronics | Medium term (2-4 years) |
| Privacy-Led Regulatory Scrutiny on Depth Cameras (EU AI Act) | -1.1% | Europe, with potential global spillover | Short term (≤ 2 years) |
| High Power Consumption in Continuous Time-of-Flight Modules | -0.9% | Global, particularly affecting mobile applications | Medium term (2-4 years) |
| Semiconductor Supply-Chain Tightness for Gallium-Nitride Lasers | -0.7% | Global, with concentrated impact in Asia | Short term (≤ 2 years) |
| Source: Mordor Intelligence | |||
Thermal challenges hinder VCSEL array miniaturization
As VCSEL emitters are packed closer to achieve higher optical power in ever-smaller footprints, central elements in an array can run 50 °C hotter than ambient. Elevated junction temperatures degrade efficiency and risk catastrophic failure. Device makers are experimenting with segmented drive circuits and advanced packaging that routes heat laterally to copper layers before it reaches sensitive optics. Adoption of these innovations will moderate the current drag on the 3D sensor market by preserving performance inside compact consumer devices.
EU AI Act creates compliance burdens for biometric sensing
Europe’s classification of facial recognition as “high risk” obliges vendors to conduct extensive impact assessments, implement strong consent flows, and provide algorithmic transparency. Rollout timelines for mall analytics, stadium access control, and public-sector surveillance have lengthened as system integrators audit data pathways. Smaller firms face disproportionate overhead, potentially narrowing the supplier landscape. Nonetheless, the push for privacy has accelerated RandD into on-device anonymization and data-sparing architectures that could later unlock demand in other regulated markets.
*Our forecasts treat driver/restraint impacts as directional, not additive. The impact forecasts reflect baseline growth, mix effects, and variable interactions.
3D Sensor Market Segment Analysis
By Product:
Image Sensors Remain Core while Gesture-Recognition AcceleratesImage Sensors accounted for 61.35% of 2025 revenue, confirming their foundational role in the 3D sensor market. Robust demand arises from smartphones, industrial inspection, and robotics that depend on high-resolution depth maps spanning 5 m ranges with sub-millimeter precision. Multi-stack backside-illuminated architectures and on-chip HDR pipelines continue to improve signal-to-noise ratios. Leading suppliers have shifted to 300 mm wafer lines, driving yield improvements that lower cost per megapixel. Gesture-Recognition Sensors record the fastest expansion, advancing at a 14.21% CAGR to 2031 as touchless interfaces penetrate infotainment consoles, interactive kiosks, and healthcare devices. New modules fuse ToF depth, millimeter-wave radar, and AI inference on a single substrate, enabling recognition of complex hand poses under variable lighting. Upskilled OEM design teams in Asia-Pacific further shorten development cycles, helping this segment accumulate a higher share of the 3D sensor market.
Position Sensors, Inertial Measurement Units, and Thermopile elements round out the portfolio, each addressing specific accuracy or environmental requirements where optical methods face limits. Cross-licensing among suppliers is consolidating IP, ensuring multi-vendor availability for system designers.The image-sensor subcategory represents the largest at USD 4.36 billion in 2025 and is on course for a mid-single-digit CAGR through 2031. Within this category, back-illuminated stacked CMOS architectures commanded roughly 50% of shipments, underscoring the move toward higher dynamic range at lower power. Gesture-recognition modules, despite a smaller base, are set to contribute USD 1.72 billion incremental revenue by 2031 as public and private spaces look to minimize shared-surface contact. This surge illustrates how diversified form factors collectively reinforce growth momentum across the 3D sensor market.



By Technology:
ToF Dominates, LiDAR Gains SpeedTime-of-Flight sensors generated 45.55% of total revenue in 2025, reflecting their favorable cost-to-accuracy balance. Indirect ToF dominates consumer devices thanks to mature VCSEL emitters and simple single-photon avalanche diode (SPAD) receivers. Direct ToF variants, with picosecond timing resolution, lead in robotics and industrial automation requiring longer working distances. Integration of capacitive depth-computation engines on the same die as photodiodes slashes latency, feeding edge-AI models without round-trips to host processors.
LiDAR solutions, though smaller in today’s shipment volumes, are growing at a 13.22% CAGR through 2031, propelled by automotive autonomy programs and infrastructure digital-twin projects. Solid-state scanning, micro-electro-mechanical beam steering, and frequency-modulated continuous-wave architectures are improving range while lowering moving-part counts. These advances reduce cost per point cloud and, by extension, broaden the 3D sensor market beyond premium vehicles.
Structured-light remains a preferred choice for close-range, high-detail capture such as facial unlocking and industrial metrology. Stereo vision and ultrasound maintain footholds in specific niches—stereo offers a lens-based alternative without active illumination, while ultrasound succeeds where optical paths are obstructed by dust or fluid.
By End-User Vertical:
Consumer Electronics Leads, Automotive AcceleratesConsumer Electronics held 53.10% of 2025 revenue, driven by smartphones, tablets, and wearables embedding depth cameras for authentication, portrait photography, and spatial computing. Under-display emitters are now shipping in pilot volumes, signaling a coming wave of uninterrupted screen designs. Low-power always-on sensing also enables hands-free control in smart-home hubs, broadening the use cases for depth perception.
Automotive and Transportation shows the fastest rise, advancing at a 15.02% CAGR as vehicles transition from Level 2 driver assistance to Level 3 autonomy. Carmakers are standardizing forward-facing LiDAR and cabin-monitoring ToF modules, integrating sensor fusion stacks that combine radar, cameras, and depth maps. Volume milestone deals between European OEMs and sensor start-ups demonstrate how the 3D sensor market is becoming integral to future vehicle platforms.
Healthcare increasingly exploits real-time 3D data for orthopedics planning, wound measurement, and patient-tracking systems that reduce fall risk. Industrial automation maintains steady demand for line-guiding, bin-picking, and quality inspection functions. Security and surveillance adopt depth cameras to reduce false positives, while aerospace programs commission custom high-g tolerances that later cascade into commercial offerings.
By Component:
Depth Image Sensors Lead while Optics & Filters Accelerate InnovationDepth image sensors captured 23.65% of 2025 component revenue, the highest 3D sensor market share among individual parts of the sensing stack. Their dominance stems from integrating traditional imaging with depth perception in a single silicon package, enabling reliable facial authentication, quality inspection, and robotics guidance. Current devices achieve sub-pixel resolution while consuming up to 30% less power than the prior generation, a gain attributable to backside-illuminated architectures and more efficient SPAD arrays. Leading suppliers such as Sony and OmniVision are now qualifying sensors that sustain performance in low-light scenes, widening deployment in automotive interiors and warehouse automation. These advances reinforce the centrality of depth image sensors within the broader 3D sensor market by lowering bill-of-materials and shortening design cycles for OEMs.
Optics and filters form the fastest-growing component group, advancing at a 11.62% CAGR through 2031 as miniaturized depth modules demand tighter control over light paths. Diffractive optical elements, multi-spectral interference coatings, and molded aspherical lenses shape structured-light and ToF beams, preserving measurement accuracy in bright sunlight, fog, or swirling dust. Automotive programs in particular push optical suppliers to guarantee temperature stability from −40 °C to 125 °C and to resist stone-chip abrasion on vehicle fronts. Innovation now centers on filters that pass selected near-infrared bands while blocking stray visible wavelengths, boosting signal-to-noise ratios without enlarging the module footprint. As component makers bundle alignment fixtures and calibration metadata with their optics, they raise the overall performance ceiling and accelerate system time-to-market, cementing optics and filters as essential enablers of the next phase of 3D sensor industry growth.
Geography Analysis
APAC 3D Sensor Market
Asia-Pacific commanded 37.40% of global revenue in 2025, reflecting the region’s dense semiconductor fabs, skilled optics workforce, and vertically integrated supply chains. China accounts for about 40% of regional sales, bolstered by domestic smartphone OEMs that are aggressively adopting in-house depth modules. Japan excels in precision glass molding and wafer-level optics, feeding high-accuracy sensors for industrial robotics. South Korea leverages advanced packaging know-how to integrate logic and sensing into single substrates, improving thermal performance in compact modules.
GCC 3D Sensor Market
The Middle East, though starting from a low base, is on course for a 12.48% CAGR through 2031. National smart-city roadmaps fund installations of depth-sensing street furniture, automated retail kiosks, and AI-enabled healthcare imaging suites. Domestic system integrators in the Gulf Cooperation Council are forging partnerships with European and Asian component vendors to localize solutions that meet climatic and linguistic requirements. Rapid procurement cycles in the retail sector are accelerating pilot-to-production timelines, providing near-term upside for the 3D sensor market.
The Americas, Europe and Africa 3D Sensor Market
North America remains the epicenter of LiDAR RandD, supported by a vibrant venture ecosystem and defense-driven research grants. Tier-one automotive suppliers here lead the push toward chip-scale beam steering. Europe sustains demand in automotive and industrial automation despite rigorous data-protection laws, spurring sensor designs that process personal data at the edge. South America shows early adoption in security and agritech, while Africa’s deployments are mainly confined to logistics hubs and mining operations that require rugged sensing solutions.

Regulatory Landscape
3D sensors face safety, automotive, and data-governance requirements that vary by application. Active optical depth systems and LiDAR are commonly engineered to laser-safety expectations anchored in IEC 60825-1 (Ed. 3), with US market access also tied to FDA laser product rules under 21 CFR 1040.10/1040.11 and the FDA position on conformance to IEC 60825-1. In automotive, LiDAR and related 3D sensing stacks must also clear EMC and vehicle integration constraints, with standards such as ISO 34510 referenced for vehicle LiDAR EMC emissions testing.
Beyond product compliance, trade and public-procurement rules increasingly shape supply-chain decisions. In the United States, BIS export controls (including ECCN-based controls and FDPR-related obligations) tightened again via Federal Register actions in September 2024 covering semiconductor-related items, raising diligence requirements for globally shipped sensing components and manufacturing toolchains. For government-related demand, NDAA Section 164 introduces procurement-driven requirements for LiDAR in 2026, pushing vendors toward clearer country-of-origin documentation and compliant sourcing paths when targeting US public-sector programs and contractors.
Value Chain Analysis
The 3D sensor value chain spans core silicon and photonics (CMOS/SPAD imagers, VCSELs/laser sources, receivers such as APD/SPAD), optical elements (lenses, diffractive optics, filters), packaging and module assembly, calibration and software, and downstream integration into devices (smartphones, vehicles, robots, security systems). The chain also depends on modality: ToF modules require tight emitter-receiver co-design and optical stack alignment, LiDAR adds scanning or beam-steering along with higher-reliability packaging, and ultrasonic 3D sensing uses piezoelectric elements with different qualification pathways. Wafer fabrication is heavily concentrated in Asia, while system integration, calibration, and qualification tend to take place closer to automotive and industrial customers in North America and Europe.
Bottlenecks show up upstream and in qualification. 1550 nm LiDAR supply can be constrained by specialized receiver materials such as InGaAs APDs and associated processing infrastructure, while risks to material availability have increased due to controls on key inputs (including gallium in 2023 and indium in 2025), affecting both 905 nm and 1550 nm photonics ecosystems. For automotive and industrial automation, safety and reliability validation (for example, ISO 26262, IEC 61508, ISO 13849) extends development timelines and increases barriers to entry, which raises the value of established module makers and platform partners able to deliver calibrated, safety-aligned reference designs rather than discrete components alone.
Competitive Landscape
The 3D sensor market exhibits moderate concentration; the top five vendors capture close to 45% of revenue while a second tier of specialists addresses niche requirements. Intel’s RealSense line couples high-resolution depth cameras with open-source middleware, easing integration in robotics and drones. Sony builds on its imaging dominance, adding depth-capture pipelines that deliver low-latency spatial data for smartphones and XR devices. STMicroelectronics leverages 300 mm wafer fabs in Europe and Asia to supply ToF sensors at scale, offering pin-compatible upgrades that shorten device redesign cycles.
Lumentum and ams OSRAM focus on VCSEL illumination, a critical component for facial recognition, automotive LiDAR, and industrial scanners. Each is investing in epitaxy and wafer-bonding techniques to raise power conversion efficiency. New entrants such as Hesai supply automotive-grade LiDAR units that combine proprietary ASICs with optics, targeting cost leaders among OEMs. Meanwhile, fab-less innovators like Acconeer exploit ultra-wideband radar to address applications where optical methods face dust or rain interference.
Strategic alliances are intensifying as customers seek turnkey depth-sensing systems rather than discrete parts. Automotive OEMs co-develop reference designs that combine LiDAR with camera, radar, and inertial data in unified perception stacks. Consumer device makers partner with optics houses to shrink modules under the display. Software value capture is rising: vendors now bundle depth-data compression, object-tracking, and privacy-preserving analytics, providing differentiation beyond raw point-cloud density.
3D Sensor Industry Leaders
Sony Group Corp
OSRAM AG
STMicroelectronics N.V.
Infineon Technologies
Intel Corporation
- *Disclaimer: Major Players sorted in no particular order
3D Sensor Market Companies Covered in this Report
- Intel Corp.
- Sony Group Corp.
- ams OSRAM AG
- STMicroelectronics N.V.
- Infineon Technologies AG
- Lumentum Holdings Inc.
- Apple Inc. (PrimeSense)
- Samsung Electronics Co. Ltd.
- OmniVision Technologies Inc.
- Panasonic Holdings Corp.
- Cognex Corp.
- Sick AG
- LMI Technologies Inc.
- Teledyne e2v
- Qualcomm Inc.
- SoftKinetic (Sony DepthSense)
- Melexis N.V.
- Himax Technologies Inc.
- Velodyne Lidar Inc.
- XYZ Interactive Technologies

Market Opportunities and Future Outlook
Whitespace is opening in compact, edge-AI-ready spatial sensing for robotics and factory automation, where buyers increasingly want modules that pair higher-resolution depth capture with onboard processing. This shift is visible in 2026 product activity, including STMicroelectronics launching the VL53L9 compact direct ToF 3D LiDAR module with 2,268 zones and on-chip processing, and Intel RealSense introducing the D585 Pro depth camera positioned as AI-native with IP65 protection for robotics environments. Orbbec also used Automate 2026 to show industrial stereo and customizable structured-light offerings, reinforcing a move toward application-tuned 3D vision portfolios rather than one-size-fits-all depth cameras.
Industrial safety and human-robot collaboration represent a more specific opportunity for compliance-ready 3D sensing that can reduce integration friction for robot OEMs and system integrators. The publication of EN IEC 61496-3:2025 (active opto-electronic protective devices responsive to diffuse reflection) gives an updated anchor for safety-rated sensing concepts, and safety-certified 3D ultrasonic sensing announcements (for example, SIL 2 and PL d positioning for human-robot collaboration) point to commercial demand for protective and proximity functions beyond conventional imaging. In parallel, harmonization steps such as the EU Commission Implementing Decision (EU) 2026/883 on the 116-260 GHz band for radiodetermination applications support clearer deployment conditions for certain industrial sensing modalities, which encourages multi-sensor fusion stacks pairing optical depth with radar-like ranging for robustness in dust, glare, or cluttered scenes.
Recent Industry Developments in 3D Sensor Market
- June 2026: STMicroelectronics launched the VL53L9 compact direct Time-of-Flight 3D LiDAR all-in-one module with 2,268 zones (54x42) and on-chip processing, with mass production scheduled for early July 2026. The release targets compact edge-AI systems that need higher-resolution spatial awareness without external compute overhead, strengthening dToF positioning in robotics and industrial automation design-ins.
- April 2026: Sony Electronics made the AS-DT1 miniature LiDAR depth sensor available for purchase through authorized distributors, using direct Time-of-Flight and SPAD technology in a compact form factor. Commercial availability through distribution channels lowers integration barriers for drones, robotics, and space-constrained sensing nodes that need off-the-shelf depth capability.
- June 2025: Sony Semiconductor Solutions announced the upcoming release of the IMX479 stacked SPAD depth sensor for automotive LiDAR, positioned for high-resolution and high-speed performance (up to 20 fps). The move extends SPAD-based depth sensing deeper into automotive-grade roadmaps, aligning component development with vehicle perception stacks that demand faster point-cloud generation.


3D Sensor Market Report Scope and Research Methodology
Market Definition and Coverage
This market counts revenue from 3D sensing components used to capture depth or spatial information. We cover major end uses such as consumer electronics, automotive, and industrial applications, and we present the results on a global basis in USD.
Scope exclusions: For sizing, we do not count full device revenue (for example, complete phones or cars) and we also do not treat general 2D imaging sensors as part of the 3D sensor total.
Segments Covered in This Report
- By Product
- Position Sensors
- Image Sensors (3D Cameras)
- Temperature Sensors
- Accelerometer and IMU Sensors
- Ambient-Light and Proximity Sensors
- Gesture-Recognition Sensors
- By Technology
- Structured Light
- Time-of-Flight (dToF and iToF)
- Stereo Vision
- LiDAR (Flash and FMCW)
- Ultrasound
- By End-User Vertical
- Consumer Electronics
- Automotive and Transportation
- Healthcare and Medical Devices
- Industrial Automation and Robotics
- Security and Surveillance
- Aerospace and Defence
- By Component
- IR VCSEL Emitters
- Depth Image Sensors
- System-on-Chip Processors
- Optics and Filters
- Illumination Modules
- Software and Algorithms
- By Geography
- North America
- United States
- Canada
- South America
- Brazil
- Argentina
- Europe
- United Kingdom
- Germany
- France
- Nordics (Sweden, Norway, Denmark, Finland)
- Middle East
- GCC
- Turkey
- Africa
- South Africa
- Nigeria
- Asia-Pacific
- China
- Japan
- South Korea
- India
- North America
Data Sources, Market Sizing, and Validation
Desk Research
We started by mapping the overall demand pool for 3D sensing using public, repeatable signals, then linked it to how 3D sensors are adopted by each end use. For external reference points, we relied on sources like U.S. International Trade Commission updates on electronics supply chains, UN Comtrade trade statistics for relevant component flows, and OECD industry indicators that help explain electronics production cycles.
To keep assumptions grounded, we also reviewed sources such as IEEE and other peer reviewed publications to confirm technology direction. Patent databases were used to see where innovation is concentrating. For momentum and rollout timing, we cross checked product launches and shipment signals using company filings, investor presentations, and credible press. In a few cases, we used paid subscriptions for company financials and intelligence, news and financials, and patents to speed up cross checks, even though the core logic can be reproduced with public information. The sources listed here are illustrative and not exhaustive, and many other public references were used for data collection, validation, and clarification.
Primary Interviews and Surveys
Primary discussions were used to validate adoption rates, pricing direction, and the pace at which key 3D sensing technologies are being designed into devices and systems. We spoke with a mix of component focused participants, channel side experts, and end user facing roles, and we balanced inputs across APAC, EMEA, and the Americas so regional manufacturing and demand patterns were not over weighted. Where desk sources were thinner (for example, on realistic ASP movement and attach rates by use case), we tightened assumptions through follow up questions and simple consistency checks against shipment and production signals.
Distribution of primary research fieldwork respondents
| Company type | Respondent position | Region |
|---|---|---|
| Top tier: 29% | CXOs: 21% | APAC: 46% |
| Mid tier: 49% | Functional/Unit leaders: 28% | EMEA: 32% |
| Smaller Players: 22% | Managers: 51% | Americas: 22% |
Market-Sizing & Forecasting
The sizing model begins with a top-down reconstruction of demand, where electronics and automotive production trends, trade flows, and technology penetration are used to build a realistic volume pool by region and major end use. After that structure is set, we corroborate results with selective bottom-up approximations, such as sampled ASP times unit volumes for key 3D sensing technologies and limited supplier roll ups, then adjust when the two views do not line up.
In this market, the variables that mattered most included: estimated attach rates of depth sensing in consumer devices, automotive sensing content per vehicle (especially for driver and cabin sensing use cases), the mix shift across structured light and time of flight adoption, average selling price progression as designs scale to higher volume, and regional manufacturing concentration that affects where shipments are recognized. For forecasting, we rely on scenario analysis supported by a simple multivariate regression layer, where production outlook, penetration ramp, and pricing trend are the main drivers, and we confirm assumptions through expert feedback. When bottom-up visibility is incomplete for smaller applications, we fill gaps using conservative penetration bands and keep them tied to the same device and production indicators used elsewhere.
Data Validation & Update Cycle
We check outputs against independent market signals, and when results differ materially, we trace the change back to the specific driver that moved the model, such as attach rate, ASP, or regional mix. A second analyst review is completed before sign off. If any unusual step change appears, we re contact a small set of primary respondents to confirm whether it reflects a real shift or a timing mismatch.
Reports are refreshed annually, and interim updates are made when material events occur, such as major product launches, demand shocks, or a clear pricing reset. Before delivery, we run a fresh pass on key inputs like production outlook and adoption timing so clients receive an updated view that still follows the same repeatable steps.
Mordor Intelligence's Global 3d Sensor Market Market Size Compared Against Other Published Estimates
Different publishers often report different market sizes for 3D sensors because they do not count the same items, and they use different price and adoption assumptions for fast moving end uses. The year used for the stated value can also vary, which changes the number even when the longer term story looks similar.
Some published figures expand scope into broader 3D sensing and imaging value, and may treat software and complete module content as part of the same revenue pool. In Mordor Intelligence, the total is kept at the 3D sensor market level and aligned to the 2026 starting point (USD 7.84 B), with cross checks tied to production, penetration, and realistic ASP movement rather than a single aggressive adoption curve.
Benchmark comparison
| Source | Market Size | Gaps in Research Methodology |
|---|---|---|
| Mordor Intelligence | USD 7.84 B (2026) | |
| Global Consultancy A | USD 6.68 B (2025) | Uses a different base year and may apply a narrower interpretation of what qualifies as 3D sensing in early adoption stages, which can pull down the starting value before the forecast ramp begins. |
| Industry Publisher B | USD 4.61 B (2025) | Often limits the counted set to a tighter list of product categories and may not fully reflect higher value use cases where time of flight and structured light content increases ASP, which reduces the reported 2025 total. |
The spread in the table is mainly explained by scope and year choice, followed by how attach rates and ASP progression are handled in early years. By keeping the model tied to observable production and adoption signals, and then stress testing totals with targeted bottom-up checks, we end up with a number that is easier to reconcile and update when market conditions change.


Key Questions Answered in the Report
What is the current 3D Sensor Market size?
The 3D Sensor Market size is expected to grow from USD 7.10 billion in 2025 to USD 7.84 billion in 2026 and is forecast to reach USD 12.87 billion by 2031 at 10.41% CAGR over 2026-2031.
What is the current value of the 3D sensor market and how fast is it growing?
The market is worth USD 7.84 billion in 2026 and is projected to reach USD 12.87 billion by 2031, reflecting a 10.41% CAGR.
Which region leads 3D sensor adoption?
Asia-Pacific holds 37.40% of global revenue thanks to its electronics manufacturing depth and rapid consumer-device refresh cycles.
Which application segment will show the fastest growth?
Automotive and Transportation is set for a 15.02% CAGR to 2031 as LiDAR-enabled ADAS and autonomous-driving features become standard.
How concentrated is the competitive landscape?
The top five vendors collectively control about 45% of worldwide sales, indicating moderate concentration and room for new entrants.
What technological advance is most likely to reduce sensor size further?
Under-display optical architectures that combine VCSEL emitters, SPAD receivers, and on-die edge processing are set to drive the next wave of miniaturization.
How is regulation affecting facial-recognition deployments in Europe?
The EU AI Act classifies facial recognition as high risk, imposing strict transparency and privacy requirements that extend project timelines and favor on-device data processing solutions.
Page last updated on:


 Your data is secure and never sold or shared.


