Geospatial Defense Applications Market Size and Share
Market Overview
| Study Period | 2019 - 2030 |
|---|---|
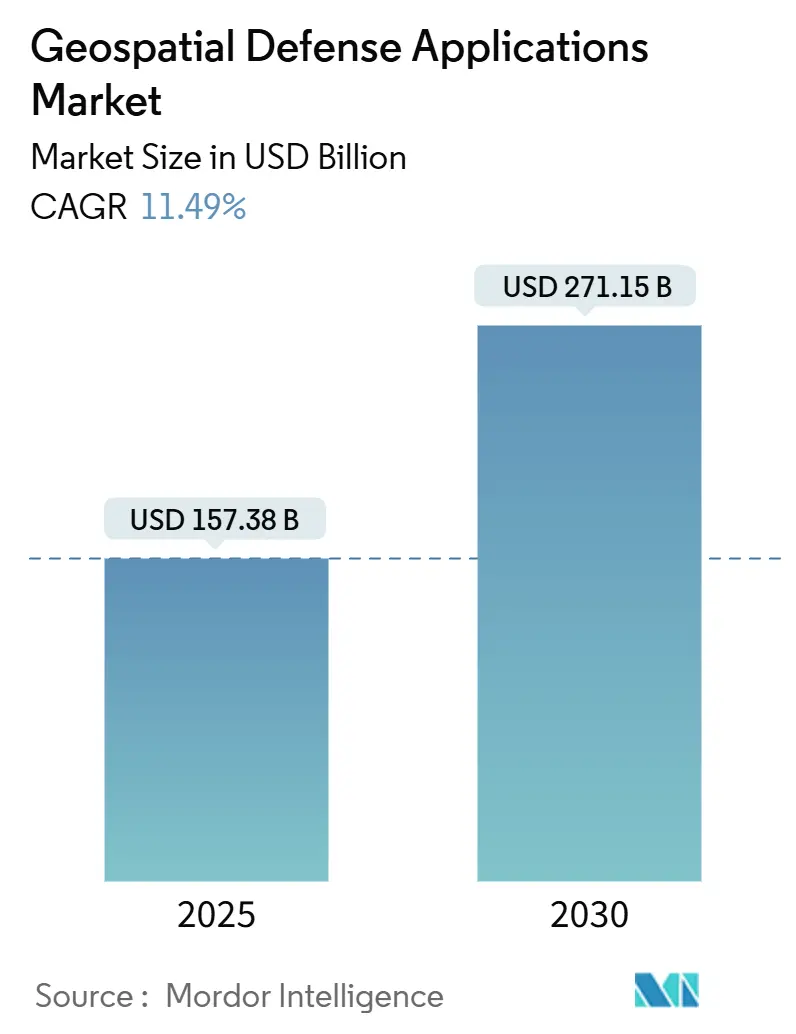
| Market Size (2025) | USD 157.38 Billion |
| Market Size (2030) | USD 271.15 Billion |
| Growth Rate (2025 - 2030) | 11.49% CAGR |
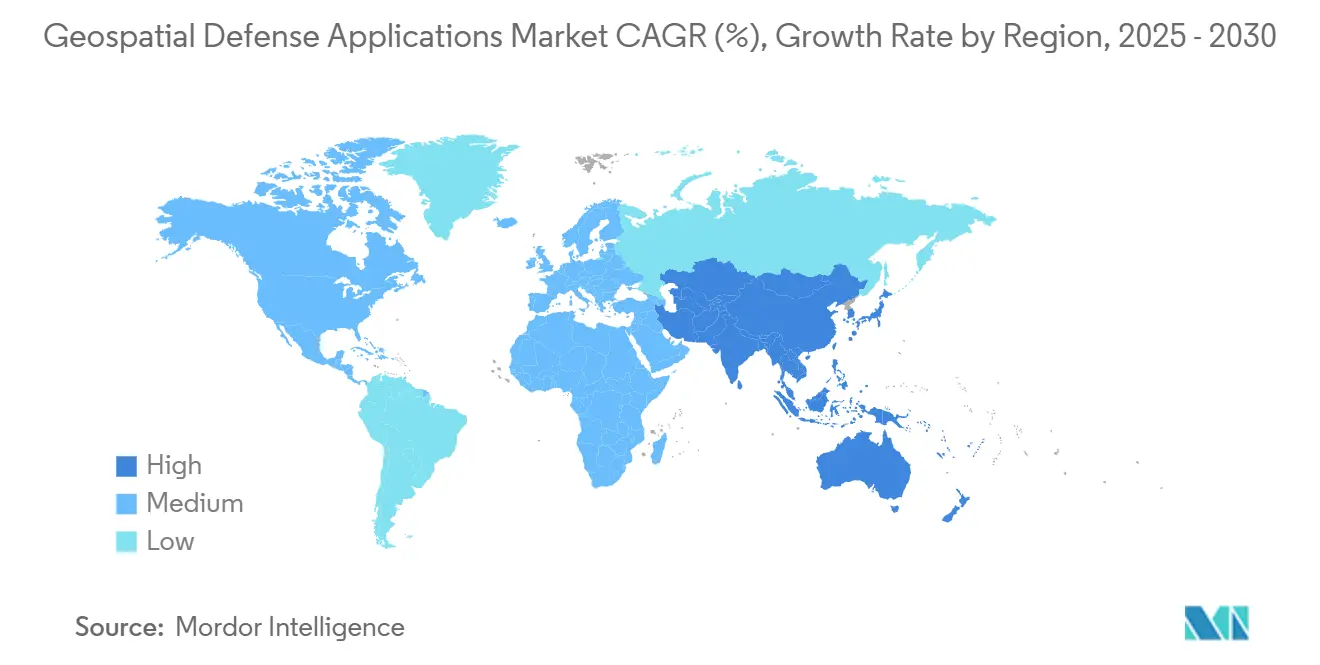
| Fastest Growing Market | Asia Pacific |
| Largest Market | North America |
| Market Concentration | Medium |
Major Players *Disclaimer: Major Players sorted in no particular order Image © Mordor Intelligence. Reuse requires attribution under CC BY 4.0. | |
Geospatial Defense Applications Market Analysis by Mordor Intelligence
The geospatial defense applications market size is valued at USD 157.39 billion in 2025 and is forecasted to climb to USD 271.15 billion by 2030, advancing at an 11.49% CAGR. Demand accelerates as militaries seek real-time situational awareness, integrating space-borne sensors, AI-driven analytics, and cloud-enabled dissemination. Growing geopolitical rift, rapid proliferation of space systems, and tightened multi-domain operational doctrines contribute to sustained procurement momentum. Ongoing budget increases among leading powers create favorable funding conditions, while commercial-space entrants shorten innovation cycles and lower cost barriers. At the same time, cybersecurity requirements and export-control hurdles temper near-term adoption of open architectures, prompting hybrid deployment strategies that safeguard classified data while exploiting commercial agility.
Key Report Takeaways
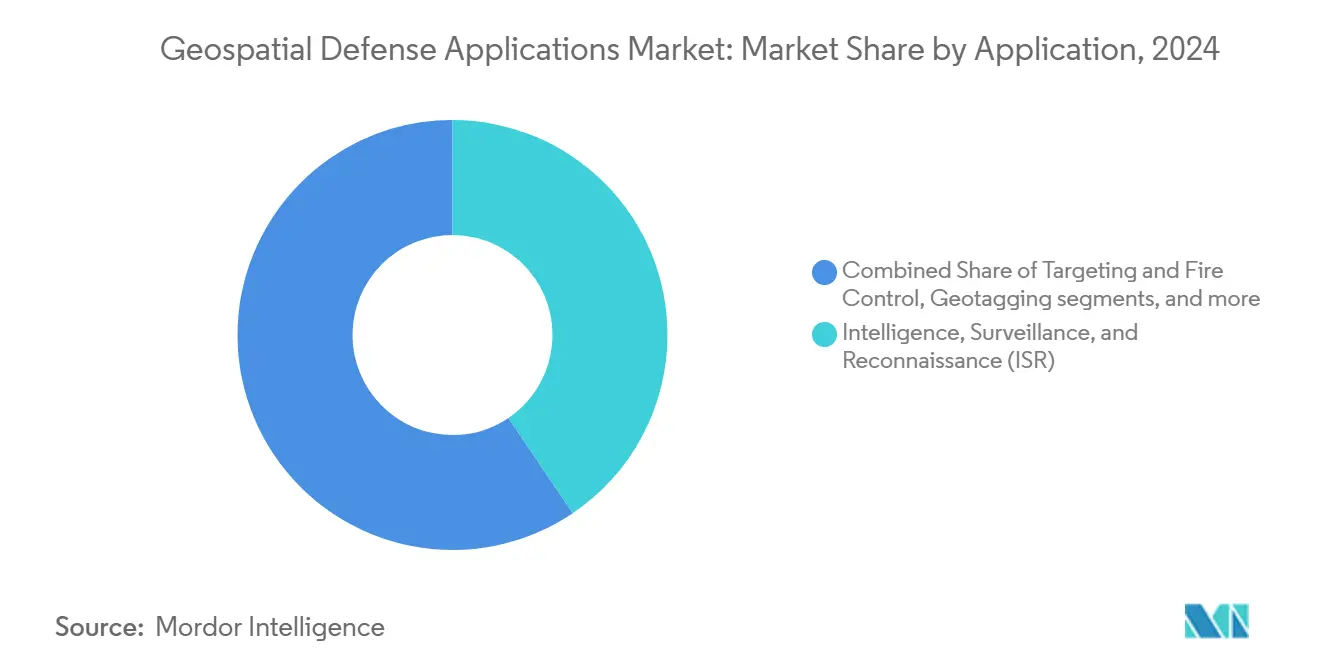
- By application, intelligence, surveillance, and reconnaissance (ISR) accounted for 38.55% of the market share in 2024, while the border and maritime security segment is forecasted to grow at an 11.25% CAGR during the forecast period.
- By platform, space-borne systems commanded a 43.55% share of the geospatial defense applications market size in 2024 and are forecasted to grow at a 13.55% CAGR to 2030.
- By sensor technology, optical imagery accounted for a 56.78% share of the geospatial defense applications market size in 2024, while radio-frequency and electronic-warfare sensors recorded the highest projected CAGR at 13.87% through 2030.
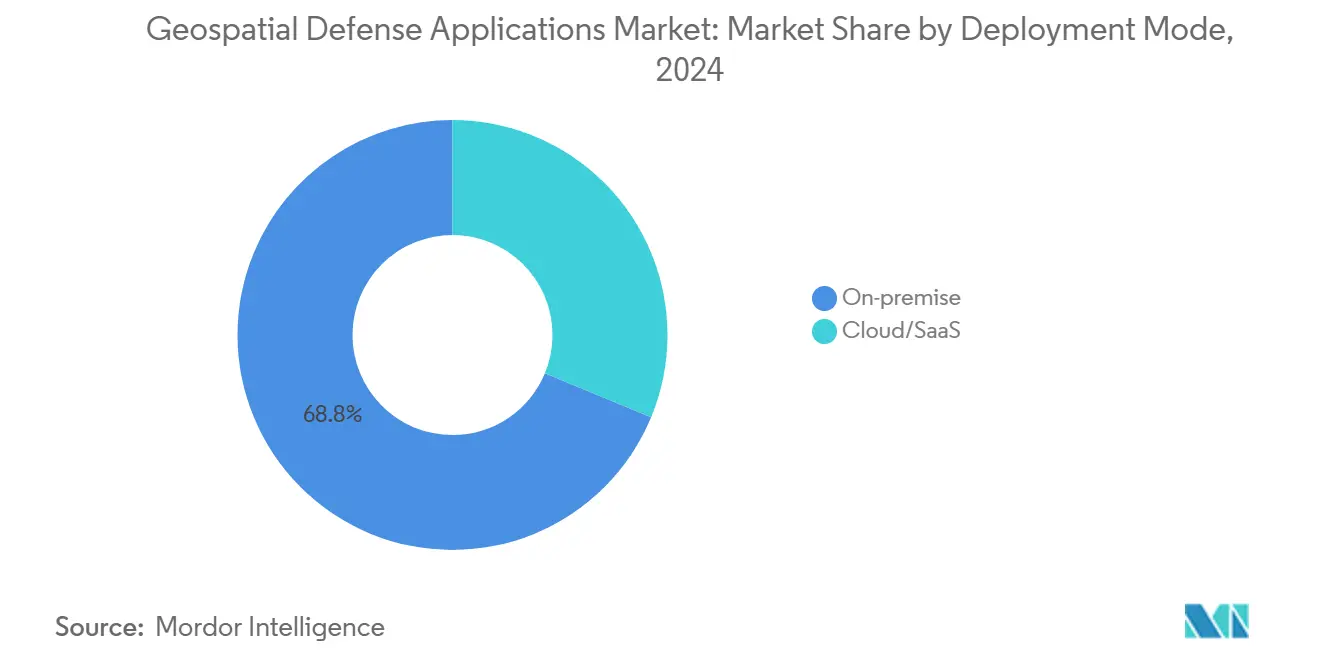
- By deployment mode, on-premise solutions captured a 68.75% share in 2024, whereas cloud and SaaS deployments are rising at a 15.67% CAGR over the forecast horizon.
- By end-user, the army held 44.56% of the geospatial defense applications market share in 2024, while joint/multi-domain commands posted the fastest growth at a 10.75% CAGR.
- By geography, North America led with 45.35% revenue share in 2024, and Asia-Pacific exhibits the strongest regional CAGR at 15.37% through 2030.
Global Geospatial Defense Applications Market Trends and Insights
Drivers Impact Analysis*
| Driver | (~)% Impact on CAGR Forecast | Geographic Relevance | Impact Timeline |
|---|---|---|---|
| Growing geopolitical rift and defense modernization | 2.5% | Global, with concentration in Eastern Europe, Indo-Pacific, and Middle East | Medium term (2-4 years) |
| Space-based defense system proliferation | 1.8% | North America, Europe, Asia-Pacific core markets | Long term (≥ 4 years) |
| AI integration in military operations | 1.2% | Global, led by technologically advanced militaries | Short term (≤ 2 years) |
| Multi-domain operations requirements | 2.1% | NATO countries, Five Eyes alliance, major defense spenders | Medium term (2-4 years) |
| Border and maritime security imperatives | 0.9% | Coastal nations, disputed territory regions | Short term (≤ 2 years) |
| Commercial technology adoption in defense | 1.4% | North America and Europe leading, Asia-Pacific following | Medium term (2-4 years) |
| Source: Mordor Intelligence | |||
Growing geopolitical rift and defense modernization
Global military outlays reached USD 2,718 billion in 2024 and rose 9.4%, underscoring how heightened rivalries convert into near-term demand for spatial intelligence.[1]Stockholm International Peace Research Institute, “Global military expenditure reaches new record high,” sipri.org East Asia alone lifted spending 6.2% to USD 411 billion, driving requirements for sensors that track maritime incursions and rapid force movements. Europe followed with a 17% rise to USD 693 billion, targeting surveillance systems capable of detecting hybrid threats. Denmark’s order for MQ-9B SkyGuardian drones in 2025 shows urgency that bypasses lengthy R&D cycles in favor of off-the-shelf GEOINT capacity. Accelerated timelines favor suppliers offering export-ready platforms that interoperate with allied networks.
Space-based defense system proliferation
National security planners deem sovereign satellite constellations essential as reliance on foreign assets creates strategic risk. The US Golden Dome architecture and Starshield concepts earmark persistent space control as a core mission. Parallel investments in Europe and Asia mirror that stance, with Rheinmetall’s SAR partnership with ICEYE opening indigenous European production in 2026. These programs elevate demand for downlink stations, edge processors, and cross-domain data relays that can handle surging volume, resolution, and revisit rates. The shift boosts long-term spending on integrated ground-space ecosystems.
AI integration in military operations
Automated exploitation now routinely surpasses human capacity for first-pass analysis. The National Geospatial-Intelligence Agency circulates AI-generated intelligence products without manual review. DARPA’s ViSAR extracts 3D mapping layers from SAR inputs in minutes, enabling rapid terrain analysis. A recent USD 800 million Pentagon award to four cloud AI providers signals institutional scale-up of large language models for real-time GEOINT annotation. Suppliers that embed ML algorithms into sensor payloads, ground stations, and command software secure a performance edge as militaries mandate sovereign AI frameworks.
Commercial technology adoption in defense
Cloud scalability, agile software methods, and micro-satellite economics push militaries toward commercial best practices. The US Pentagon’s Joint Warfighting Cloud Capability exemplifies this pivot by linking four hyperscale providers into one secret fabric. Europe earmarks secure cloud initiatives within its USD 1.24 billion 2025 defense fund. Vendors delivering hardened DevSecOps pipelines, container-based analytics, and zero-trust edge nodes unlock cost savings and faster capability refresh for defense agencies, balancing security with speed.
Restraints Impact Analysis*
| Restraint | % Impact on CAGR Forecast | Geographic Relevance | Impact Timeline |
|---|---|---|---|
| Data-fusion interoperability gaps | 1.1% | Global, particularly acute in coalition operations | Long term (≥ 4 years) |
| Cyber-security vulnerabilities | 1.0% | Global, with heightened risk in contested domains | Short term (≤ 2 years) |
| Spectrum-access congestion in conflict zones | 0.9% | High-intensity conflict regions, urban warfare environments | Medium term (2-4 years) |
| Export-control tightening on dual-use sensors | 1.2% | International markets, particularly affecting China-adjacent regions | Medium term (2-4 years) |
| Source: Mordor Intelligence | |||
Data-fusion interoperability gaps
Different data formats and processing rules often stop geospatial defense systems from working smoothly together. These technical mismatches slow information sharing among allied forces relying on real-time intelligence. The US Joint All-Domain Command and Control (JADC2) effort still struggles to build a common data backbone that accepts feeds from every sensor and command network. NATO’s Baltic Sentry exercise showed the same problem when naval drones from several nations had to translate data on the fly because each fleet used its own communication standard. Fixing these issues is expensive; integration work can cost two to three times more than the original platform. Because most defense vendors publish only proprietary application interfaces, customers face vendor lock-in and higher long-term bills. During crises, these hurdles force commanders to bolt on quick-fix middleware that adds complexity and can lower system reliability.
Spectrum-access congestion in conflict zones
Modern battlefields are crowded with radios, radars, and electronic-warfare gear that all fight for the same airwaves. As military demand for spectrum grows and available frequencies stay fixed, interference can shut down key geospatial feeds during high-tempo missions. Urban combat worsens matters because civilian networks add extra noise that can hide or distort military signals. Radio-frequency and electronic-warfare sensors—now the fastest-growing segment—are especially prone to overload, sometimes turning useless when needed. British Army trials of directed-energy weapons highlight both the promise and the limits of spectrum-hungry systems, which adversary jammers can disable within minutes. Commanders often must choose between keeping communications clear and running high-bandwidth sensors, a trade-off that complicates mission planning.
*Our forecasts treat driver/restraint impacts as directional, not additive. The impact forecasts reflect baseline growth, mix effects, and variable interactions.
Segment Analysis
By Application: ISR Dominance Drives Tactical Evolution
Persistent monitoring powers every combat function, explaining why ISR secured a 38.55% share of the geospatial defense applications market size in 2024. Space-borne constellations and high-altitude drones feed imagery, radio frequency (RF), and search and rescue (SAR) data into AI engines that detect order-of-battle shifts in minutes. Border and maritime security, projected to grow at 11.25% CAGR, benefits from small-sat RF mapping and long-range coastal radars that reveal dark-ship activity. Targeting and fire control modules increasingly integrate machine-learned aim-point selection, cutting sensor-to-shooter loops from hours to seconds. Logistics and asset tracking gain traction as distributed supply chains demand RFID-to-L-band correlation for global asset visibility. More minor but vital geotagging use cases embed precise location data into everything from casualty evacuation to autonomous vehicle route files, underpinning combat service support efficiency.
Sustained ISR spending attracts dual-use commercial imagery providers offering daily global refresh, pressuring legacy primes to accelerate analytics delivery. Border security agencies co-fund maritime domain awareness systems, creating overlap with traditional naval missions. As multilingual analytics mature, some governments pilot fully automated link-analysis charts that merge ISR feeds with open-source intelligence (OSINT) metadata. Vendors that can tailor one software backbone for multiple missions lessen training load and simplify lifecycle sustainment, enhancing procurement appeal.


By Platform: Space Supremacy Reshapes Defense Architecture
Space-borne assets held 43.55% of the geospatial defense applications market share in 2024 and expanded at a 13.55% CAGR as states race to secure sovereign imagery and communications. Smallsat constellations offer sub-hour revisit over theater, while hosted payload approaches let defense users ride commercial buses for marginal cost. Airborne platforms remain indispensable for low-latency tactical feeds and munitions cueing. Denmark’s 2025 MQ-9B deal reflects enduring demand for modular UAS that plug into coalition ISR grids.[2]No author listed, “Denmark Reinforces Arctic and North Atlantic Surveillance With Four US-Made MQ-9B SkyGuardian Drones,” Army Recognition, armyrecognition.com
Land-based nodes now include mobile truck-mounted ground stations, and rapidly deployable terminals connectable to tactical cloudlets. Naval vessels integrate topside SAR and infrared masts feeding real-time streams to carrier strike group networks. The convergence stimulates demand for standardized data buses and STANAG-compliant interfaces so that commanders view one fused picture. Suppliers combining satellite tasking, airborne pod control, and ground analytics in a single license win preference in joint procurements.
By Sensor Technology: Optical Leadership Faces RF Innovation
Optical systems control 56.78% of 2024 revenue, given their intuitive imagery and steadily improving 20-cm class resolution. Yet RF and EW sensors register the fastest 13.87% CAGR as militaries recognize the value in spectrum-agnostic detection that ignores cloud and camouflage. DARPA backs RF micro-aperture arrays for contested environments where GNSS spoofing is rampant.[3]Defense Advanced Research Projects Agency, “DARPA ViSAR Program Demonstrates AI Potential for 3-D Mapping From SAR Imagery,” Defense Advanced Research Projects Agency, darpa.mil Synthetic aperture radar garners renewed interest for maritime iceberg tracking and clandestine airstrip monitoring.
LiDAR evolves from niche mapping to tactical obstacle avoidance and foliage penetration. A rainforest-capable LiDAR prototype from MIT Lincoln Laboratory underscores the potential to reveal concealed insurgent encampments. Multi-spectral fusion emerges as the performance frontier, with onboard AI selecting optimal modal weighting against target type and weather. Manufacturers that shrink size, weight, and power for 6U-class buses or Group 2 drones achieve a competitive edge.
By Deployment Mode: Cloud Migration Challenges Security Paradigms
On-premise architectures still dominate with 68.75% share, but cloud solutions rise 15.67% annually as JWCC and allied programs validate classified multicloud. Zero-trust frameworks, cross-domain guards, and containerized workloads allow secret workloads to float across private regions managed by hyperscalers yet audited by defense security operators. Europe advances secure sovereign clouds under EDF funding to reduce US dependence.[4]European Defence Agency, “European Defence Fund 2025 Work Programme Adopted,” European Defence Agency, eda.europa.eu
Hybrid patterns emerge where edge nodes perform time-critical processing while pushing non-critical analytics to remote data centers for cost savings. Rugged mini-servers mounted on HUMVEEs execute AI inference even when SATCOM is jammed. Vendors offering modular licenses that switch seamlessly between disconnected and connected modes appeal to commanders seeking assurance and flexibility.
By End-User: Joint Commands Drive Integration Imperative
Ground forces continue to own 44.56% of spending thanks to their manpower scale and wide mission set. However, joint/multi-domain commands outpace at 10.75% CAGR as doctrines demand synchronized cross-service targeting. The US Space Force leans on Palantir’s Space C2 platform for fused orbital awareness while handing curated products to Air and Naval task forces.
The US Air Force focuses on mission-data file generation and adaptive EW maneuvers, while the Navy invests in acoustic-to-optical fusion for undersea cueing of surface assets. Procurement consolidation sees service-specific program offices merging into theater-aligned PEOs that buy once and field everywhere. Solution providers can translate requirements from disparate services into one baseline variant, lower integration costs, and accelerate signing.
Geography Analysis
North America generated 45.35% of 2024 revenue, thanks to the US's USD 794 million NGA R&D awards and USD 1.3 billion Maven expansion. Robust industrial-academic ecosystems allow rapid translation of AI research into fieldable tools, while the Defense Production Act eases the scale-up of novel sensors. Canadian Arctic sovereignty missions and Mexican border security projects further enlarge regional demand.
Asia-Pacific exhibits the strongest 15.37% CAGR through 2030. China targets USD 360 billion defense outlays by 2030, emphasizing space and AI excellence. Japan allocates record space defense budgets for QZSS augmentation, and South Korea domestically fields LiDAR-equipped surveillance UAS. India expands northern border GEOINT hubs, while Australia aligns with AUKUS data-fusion standards. The region's appetite for sovereign processing favors vendors willing to establish on-shore clouds and share source code under technology-transfer terms.
European expenditure rose 17% to USD 693 billion in 2024, fueling demand for interoperable GEOINT that supports NATO deterrence. The EDF dedicates significant 2025 funds to geospatial research and secure cloud pilots. Rheinmetall-ICEYE SAR production in Germany and Denmark's Arctic drone order illustrate momentum toward indigenous capacity. Strict data-sovereignty statutes and multi-nation consortia shape procurement, favoring platforms that meet EU security certifications while remaining interoperable with US allies.

Competitive Landscape
The market remains semi-consolidated. Key players such as Maxar and Thales are leveraging their longstanding expertise in conjunction with cutting-edge analytics. In June 2025, Maxar secured contracts for imagery and analytics services from the NGA and launched an innovative persistent monitoring service that integrates commercial refresh data with classified tasking. Additionally, Thales announced a partnership with LuxCarta in February 2023 aimed at developing AI-enhanced solutions for intelligence and military cartography, underscoring the growing demand for advanced analytics in these sectors.
Commercial disruptors narrow the capability gap. Palantir grew Project Maven awards from USD 480 million to USD 1.3 billion by iterating battlefield algorithm accuracy every quarter. Anduril uses venture funding to acquire edge-compute and radar firms, injecting rapid-dev culture into defense procurement. Dual-use smallsat operators pitch subscription models that grant militaries assured revisit with no capital outlay.
Partnership patterns intensify. Maxar’s 2025 accord with Saab pairs high-resolution imagery with Scandinavian ECCM heritage for European customers. Rheinmetall’s joint satellite venture merges heavy-industry scale with new-space speed. Cloud hyperscalers receive framework contracts but lean on specialist integrators for classified enclave hardening. Vendors demonstrating agile sprint cycles, open API stacks, and sovereign build options garner strategic favor as acquisition officials juggle innovation and security.
Geospatial Defense Applications Industry Leaders
Economic and Social Research Institute (ESRI)
Maxar Technologies Holdings Inc.
Airbus Defence & Space (Airbus SE)
L3Harris Technologies, Inc.
BAE Systems, plc
- *Disclaimer: Major Players sorted in no particular order


Recent Industry Developments
- July 2025: Maxar Intelligence, a Maxar Technologies Holdings Inc. business unit, secured three multi-year strategic contracts totalling USD 204.7 million to advance sovereign defense and intelligence capabilities in the Middle East and Africa (MEA) region.
- June 2025: The USAir Force allocated USD 220 million for a six-year contract, selecting 14 companies to provide comprehensive geospatial support services. This initiative strengthens situational awareness across the Air Force and broader military operations.
- May 2025: The US Army finalized a five-year contract vehicle valued at USD 499 million towards the R&D of advanced geospatial technology systems and their operational deployment.
- May 2025: The National Geospatial-Intelligence Agency (NGA) awarded Lockheed Martin Corporation the Geospatial Intelligence Collection Next contract. This indefinite delivery, indefinite quantity (IDIQ) agreement, inclusive of the initial task order, encompasses a total contract ceiling of USD 615.7 million over seven years.


Global Geospatial Defense Applications Market Report Scope
| Intelligence, Surveillance, and Reconnaissance (ISR) |
| Targeting and Fire Control |
| Mission Planning and Management |
| Logistics and Asset Tracking |
| Border and Maritime Security |
| Geotagging |
| Space-borne |
| Airborne |
| Land-based |
| Naval-based |
| Optical Imagery |
| Synthetic Aperture Radar (SAR) |
| Light Detection and Ranging (LiDAR) |
| Radio-frequency and Electronic Warfare (EW) Sensors |
| On-premise |
| Cloud/SaaS |
| Army |
| Navy |
| Air Force |
| Joint/Multi-Domain Commands |
| North America | United States | |
| Canada | ||
| Mexico | ||
| Europe | United Kingdom | |
| France | ||
| Germany | ||
| Russia | ||
| Rest of Europe | ||
| Asia-Pacific | China | |
| India | ||
| Japan | ||
| South Korea | ||
| Rest of Asia-Pacific | ||
| South America | Brazil | |
| Rest of South America | ||
| Middle East and Africa | Middle East | Saudi Arabia |
| United Arab Emirates | ||
| Rest of Middle East | ||
| Africa | South Africa | |
| Rest of Africa | ||
| Application | Intelligence, Surveillance, and Reconnaissance (ISR) | ||
| Targeting and Fire Control | |||
| Mission Planning and Management | |||
| Logistics and Asset Tracking | |||
| Border and Maritime Security | |||
| Geotagging | |||
| Platform | Space-borne | ||
| Airborne | |||
| Land-based | |||
| Naval-based | |||
| Sensor Technology | Optical Imagery | ||
| Synthetic Aperture Radar (SAR) | |||
| Light Detection and Ranging (LiDAR) | |||
| Radio-frequency and Electronic Warfare (EW) Sensors | |||
| Deployment Mode | On-premise | ||
| Cloud/SaaS | |||
| End-User | Army | ||
| Navy | |||
| Air Force | |||
| Joint/Multi-Domain Commands | |||
| Geography | North America | United States | |
| Canada | |||
| Mexico | |||
| Europe | United Kingdom | ||
| France | |||
| Germany | |||
| Russia | |||
| Rest of Europe | |||
| Asia-Pacific | China | ||
| India | |||
| Japan | |||
| South Korea | |||
| Rest of Asia-Pacific | |||
| South America | Brazil | ||
| Rest of South America | |||
| Middle East and Africa | Middle East | Saudi Arabia | |
| United Arab Emirates | |||
| Rest of Middle East | |||
| Africa | South Africa | ||
| Rest of Africa | |||


Key Questions Answered in the Report
What is the 2025 value of the geospatial defense applications market?
The market is valued at USD 157.39 billion in 2025, and is forecasted to climb to USD 271.15 billion by 2030, advancing at an 11.49% CAGR.
How fast will spending on space-borne GEOINT platforms grow?
Space-borne solutions are forecasted to expand at a 13.55% CAGR through 2030.
Which region shows the quickest growth in defense GEOINT adoption?
Asia-Pacific posts the highest regional CAGR at 15.37% over the forecast period.
Why are radio-frequency sensors gaining traction?
RF sensors support electronic warfare and all-weather detection, driving a 13.87% CAGR, the fastest among sensor categories.
How is cloud technology influencing future defense GEOINT deployments?
Cloud and SaaS adoption is rising at 15.67% CAGR as militaries adopt secure multicloud frameworks for scalable analytics.
Page last updated on:


