
Geopolymer Market Size and Share
Market Overview
| Study Period | 2021 - 2031 |
|---|---|
| Market Size (2026) | USD 9.64 Billion |
| Market Size (2031) | USD 16.15 Billion |
| Growth Rate (2026 - 2031) | 10.88 % |
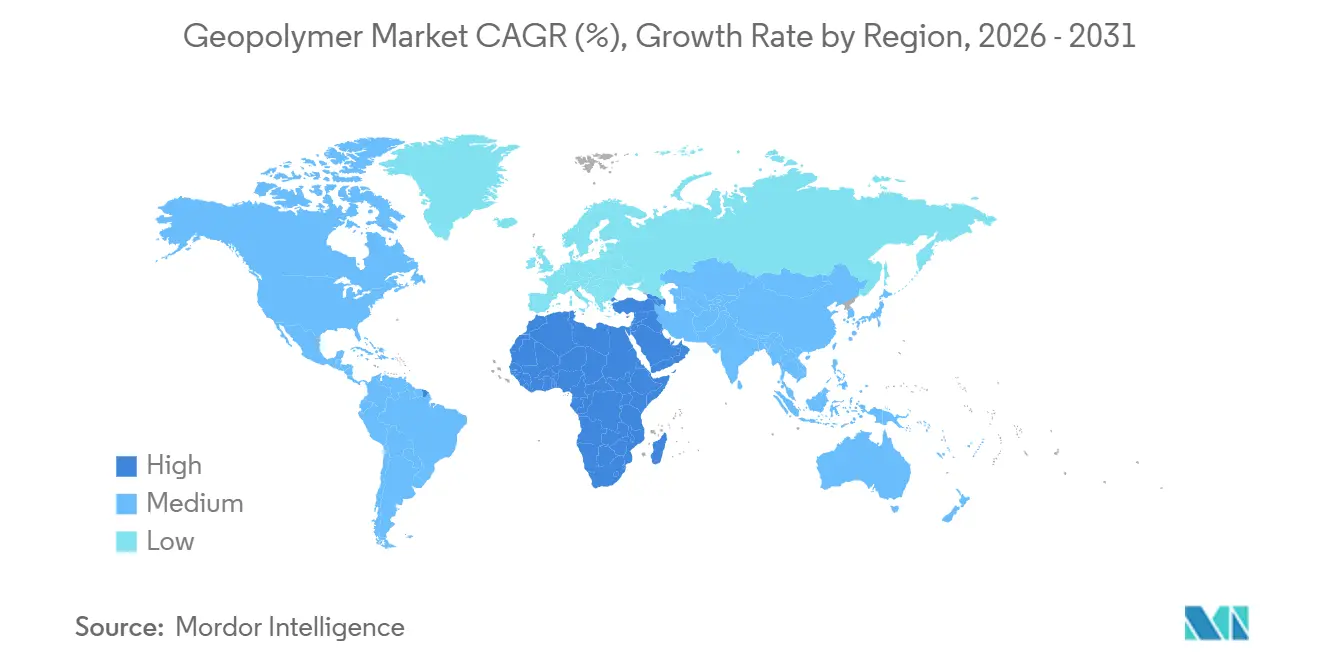
| Fastest Growing Market | Middle East and Africa |
| Largest Market | Asia Pacific |
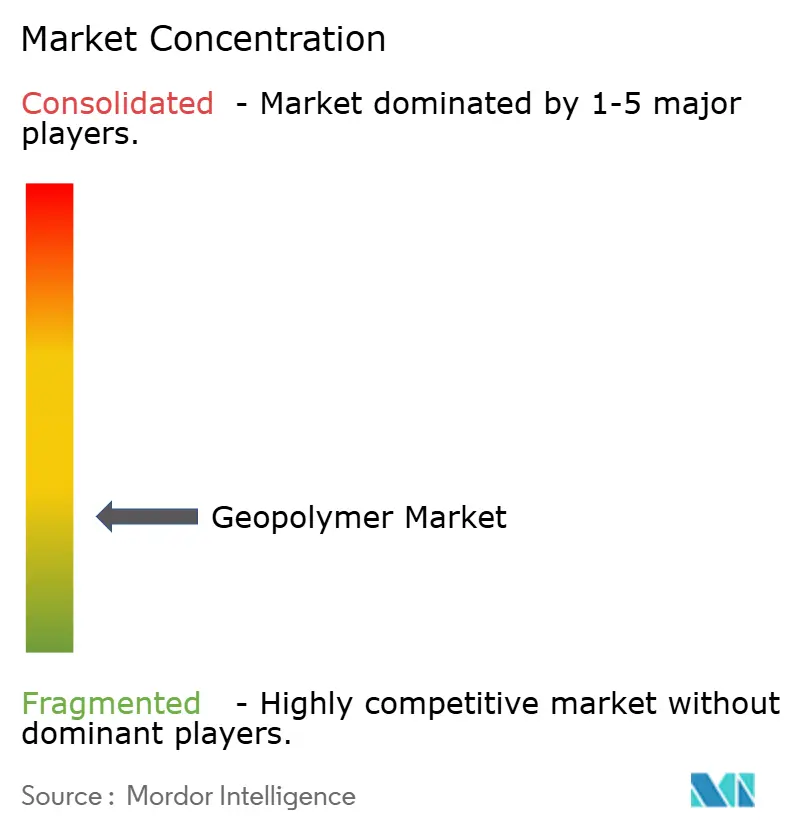
| Market Concentration | Low |
Major Players *Disclaimer: Major Players sorted in no particular order Image © Mordor Intelligence. Reuse requires attribution under CC BY 4.0. | |
Geopolymer Market Analysis by Mordor Intelligence
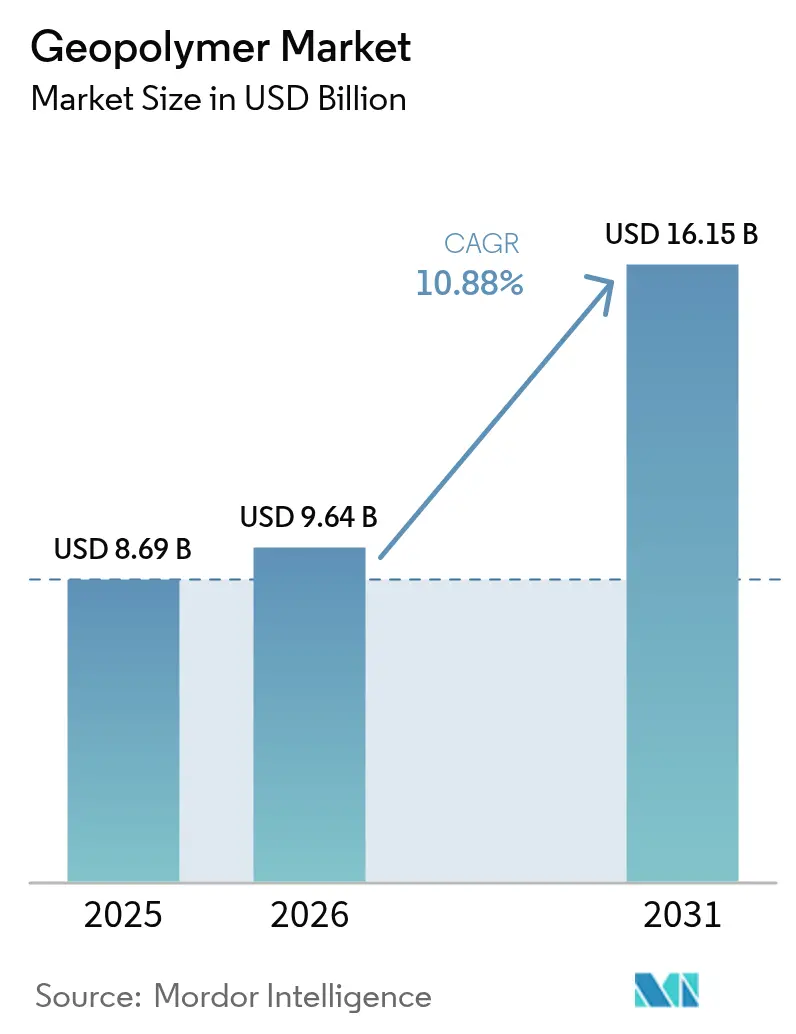
The Geopolymer Market size is expected to grow from USD 8.69 billion in 2025 to USD 9.64 billion in 2026 and is forecast to reach USD 16.15 billion by 2031 at 10.88% CAGR over 2026-2031. Declining cost competitiveness of Portland cement under carbon-pricing programs, wider access to industrial by-products such as fly ash and slag, and fast-maturing one-part formulations are steering procurement managers toward aluminosilicate binders. The geopolymer market is also benefiting from green-building mandates in the United States, the European Union, and the Gulf states, each of which embeds embodied-carbon thresholds into public tenders. Ready-mix producers are capitalizing on these policies to widen product portfolios, while deep-sea energy operators now specify geopolymer grouts that tolerate sulfate attack for twice as long as legacy cement systems. Competitive intensity remains moderate because global cement majors still control clinker distribution and therefore the pace at which design codes migrate, yet independent formulators are carving out high-margin niches in waste immobilization and fireproofing.
Key Report Takeaways
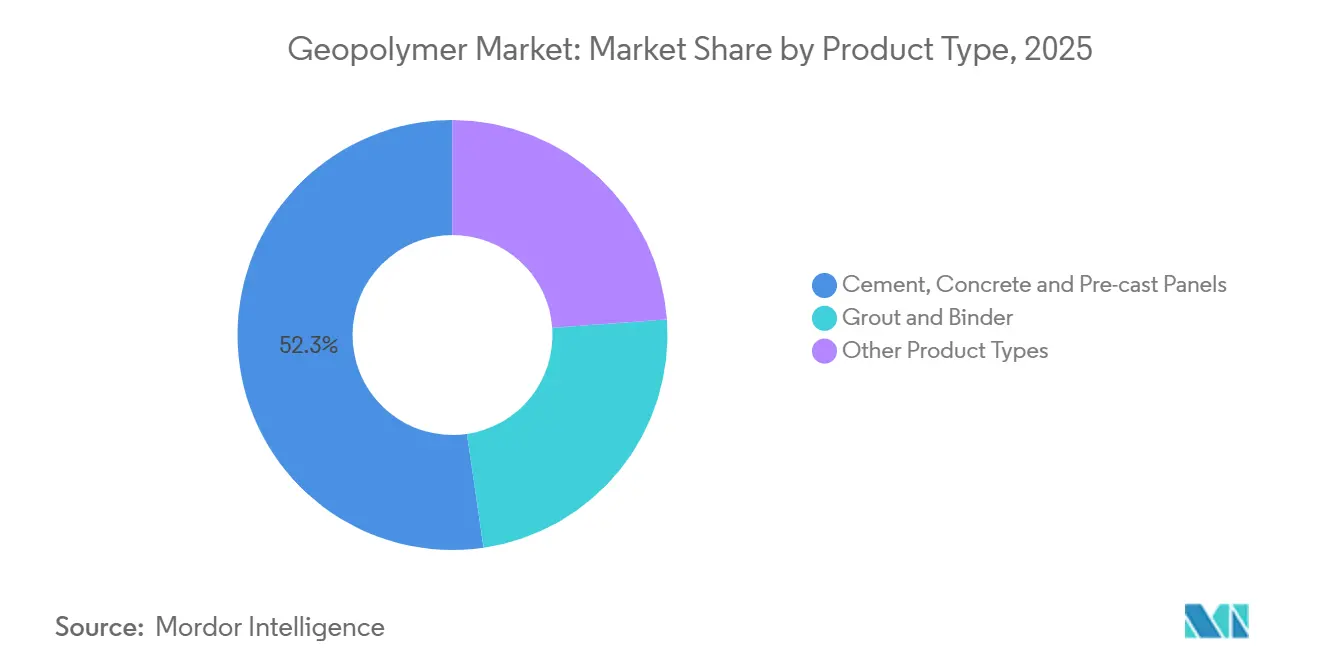
- By product type, cement, concrete, and pre-cast panels held 52.31% of the geopolymer market share in 2025, while grout and binder applications are forecast to expand at an 11.12% CAGR through 2031.
- By application, building construction commanded 34.45% of the geopolymer market size in 2025, whereas nuclear and other toxic-waste immobilization applications are advancing at a 11.25% CAGR to 2031.
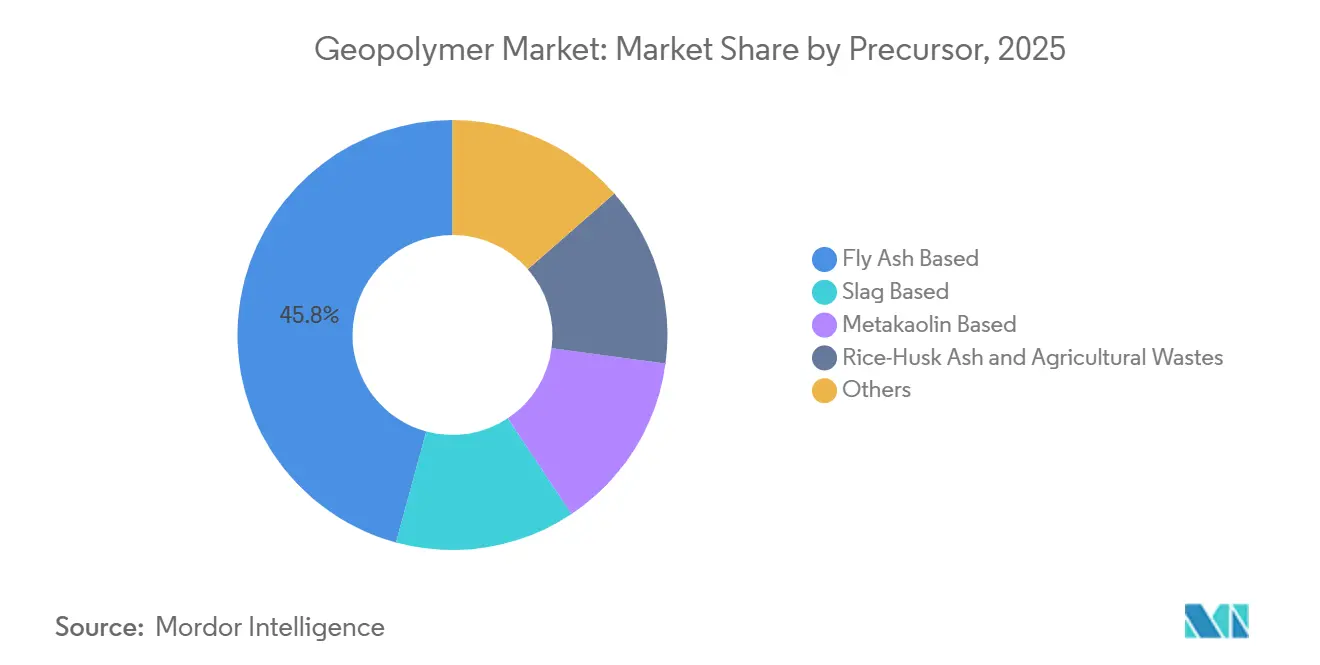
- By precursor, fly-ash-based systems contributed 45.78% of the geopolymer market share in 2025, and metakaolin-based formulations are projected to grow at an 11.67% CAGR during the period.
- By geography, Asia-Pacific accounted for 44.31% of the market in 2025, while the Middle East and Africa region is set to record the highest 10.92% CAGR through 2031.
Note: Market size and forecast figures in this report are generated using Mordor Intelligence’s proprietary estimation framework, updated with the latest available data and insights as of 2026.
Market Trends and Insights
Drivers Impact Analysis of Geopolymer Market*
| Drivers | (~) % Impact on CAGR Forecast | Geographic Relevance | Impact Timeline |
|---|---|---|---|
| Stringent CO₂-emissions regulations on cement industry | +3.2% | Global, with highest intensity in EU, UK, China, California | Medium term (2-4 years) |
| Growing availability of fly-ash and slag feedstocks | +2.4% | APAC core (China, India, ASEAN), spill-over to North America | Short term (≤ 2 years) |
| Demand for green-building certification materials | +2.1% | North America, EU, Middle East (UAE, Saudi Arabia) | Medium term (2-4 years) |
| Rapid uptake of one-part geopolymer formulations | +1.8% | Global, early gains in Australia, Scandinavia, Japan | Short term (≤ 2 years) |
| Deep-sea energy and mining infrastructure adoption | +1.4% | North Sea, Gulf of Mexico, South China Sea, offshore West Africa | Long term (≥ 4 years) |
| Source: Mordor Intelligence | |||
Stringent CO₂-Emissions Regulations on Cement Industry
Starting in 2026, the Carbon Border Adjustment Mechanism will impose an additional charge on imported clinker. This move is set to widen the cost disparity between Portland and geopolymer binders[1]European Commission, “EU Emissions Trading System,” europa.eu. In China, certain provinces have established a ceiling on CO₂ emissions for every tonne of clinker produced. This regulation has led to winter curtailments, subsequently boosting the attractiveness of supplementary binders. Meanwhile, California's Buy Clean Act mandates a limit on CO₂-equivalent emissions for each unit of compressive strength. Notably, fly-ash geopolymer mixes can achieve this standard without the need for carbon capture. Furthermore, ISO 14067 certification has gained traction among Tier-1 contractors. This endorsement has effectively integrated geopolymer specifications into infrastructure portfolios worth billions. Looking ahead, the International Energy Agency projects that by 2030, carbon pricing will encompass a significant portion of the global cement output, further strengthening the momentum of these regulatory changes.
Growing Availability of Fly-Ash and Slag Feedstocks
In 2025, India produced fly ash, with policy mandates boosting utilization, leading to a year-on-year drop in precursor prices. China's steel sector churned out slag in 2025, resulting in a surplus. This surplus, earmarked for geopolymer applications, is priced lower than imported metakaolin. Vietnam and Indonesia inaugurated beneficiation hubs, achieving a sub-5% loss-on-ignition feedstock. This advancement has reduced compressive-strength variability. In North America, the retirement of coal plants cut the annual fly-ash supply. This shortfall has nudged formulators towards ground glass pozzolan, despite its higher cost. Meanwhile, electric-arc steel mills around the Great Lakes ensure a steady slag supply, maintaining the region's cost advantage.
Demand for Green-Building Certification Materials
LEED v5 awards credits for mixes achieving a significant reduction in embodied carbon. This incentive is projected to boost geopolymer specifications in North American commercial projects. Abu Dhabi's Estidama system mandates ISO 21930 environmental product declarations. Notably, certified geopolymer suppliers are eyeing the lucrative backlog for Expo 2030. Meanwhile, Saudi Arabia's Green Building Code aims for a reduction in embodied carbon for public constructions, spurring demand for geopolymer panels in healthcare facilities. Additionally, both BREEAM International and the European Commission's Level(s) framework incentivize concrete that incorporates industrial waste, aligning seamlessly with geopolymer technology.
Rapid Uptake of One-Part Geopolymer Formulations
One-part systems, which come equipped with dry alkali activators, only need water added on-site and can reduce labor costs. In 2025, CEMEX delivered such concrete to industrial parks in Monterrey. By the end of 2025, Heidelberg Materials will boost a production line in Hanover to churn out such materials monthly. Research published in peer-reviewed journals indicates that sodium-aluminate-activated one-part mixtures offer durability on par with two-part systems in environments with sulfate and chloride exposure. Meanwhile, Japanese patents have taken this innovation further, introducing calcium sulfoaluminate blends that achieve strength in just six hours, even at low temperatures.
Restraints Impact Analysis of Geopolymer Market*
| Restraints | (~) % Impact on CAGR Forecast | Geographic Relevance | Impact Timeline |
|---|---|---|---|
| Lack of uniform design codes and standards | -1.6% | Global, acute in North America, Middle East, South America | Medium term (2-4 years) |
| Price volatility of alkali activators (NaOH / Na₂SiO₃) | -1.2% | Global, with highest exposure in regions dependent on imported sodium silicate (South America, Africa) | Short term (≤ 2 years) |
| Feedstock chemical variability compromising QC | -0.9% | APAC (China, India, ASEAN), Eastern Europe | Short term (≤ 2 years) |
| Source: Mordor Intelligence | |||
Lack of Uniform Design Codes and Standards
Geopolymer concrete lacks recognition in ASTM C94 and ACI 318, leading engineers to seek project-specific approvals and extending permit cycles[2]American Concrete Institute, “Building Code Requirements,” concrete.org. Australia's AS 3600 performance clauses, updated in 2024, stand as the sole national standard, channeling research and development efforts predominantly in that market. With ISO 19596 not anticipated until 2028, specifiers often revert to Portland cement to mitigate liability risks. British Standards only acknowledge geopolymer mixes post durability trials, hindering adoption in the Middle East. Additionally, conflicting tunnel fire-resistance regulations between Germany and France inflate compliance costs for suppliers catering to both nations.
Price Volatility of Alkali Activators
In late 2024, gas shortages in Europe led to a surge in sodium silicate prices, subsequently raising geopolymer concrete costs. Throughout 2025, sodium hydroxide spot prices in Asia fluctuated, prompting producers to hedge a significant portion of their volumes. Suppliers in South America, dependent on imported activators, faced high landed costs. This situation rendered geopolymer mixes pricier than their local cement counterparts. Dominating the global landscape, three firms command a significant share of the capacity and transfer most energy costs directly to buyers. Meanwhile, projects in Africa grapple with cost fluctuations, a challenge exacerbated by currency depreciation and a complete reliance on imports.
*Our forecasts treat driver/restraint impacts as directional, not additive. The impact forecasts reflect baseline growth, mix effects, and variable interactions.
Geopolymer Market Segment Analysis
By Product Type:
Pre-Cast Panels Anchor Volume GrowthIn 2025, cement, concrete, and pre-cast panels dominated the geopolymer market, capturing a 52.31% share of the revenue. This surge was largely driven by ready-mix companies adopting one-part systems, streamlining on-site batching. By 2031, this segment is poised to represent a substantial portion of the geopolymer market, buoyed by public projects like low-carbon bridges, schools, and high-rise façades. The quality of these panels is further enhanced through factory-controlled curing. Meanwhile, grout and binder products are witnessing 11.12% growth, fueled by tunnel repairs and subsea cable work, which command premium pricing for their rapid strength gain.
Niche applications of the geopolymer market are emerging in coatings and adhesives, particularly for fireproofing and chemical-resistant linings. However, the higher formulation costs are tempering volume growth. Cold-weather performance, previously a challenge, is now being addressed. Norwegian field trials using calcium sulfoaluminate accelerators demonstrated the ability to achieve 15 MPa within eight hours at 5 °C. With an uptick in product certifications, especially in Europe and Australia, many precast producers are transitioning to ambient-cured mixtures, reaping energy bill savings.



By Application:
Waste Immobilization Drives Specialty DemandBuilding construction accounted for a 34.45% share of market revenue in 2025, spurred by municipal green-bond financing emphasizing low-carbon concrete. Nuclear and toxic-waste immobilization, although smaller in absolute volume, is forecast to grow fastest at 11.25% CAGR to 2031. Notably, contract awards at Sellafield focused on geopolymer encapsulation for intermediate-level waste. In a significant move, Japanese regulators greenlit this technology for soil stabilization at Fukushima, setting a precedent across regions.
In a bid to enhance road longevity, infrastructure agencies in Australia and India are piloting geopolymer pavements, adept at resisting sulfate attacks in expansive clay soils. Bridge decks, pier jackets, and marine pilings, with chloride diffusion coefficients under 2 × 10⁻¹² m²/s, not only meet the “very low” permeability standard but also enjoy extended maintenance intervals. In petrochemical plants, fireproofing solutions now boast a four-hour integrity at 1,100 °C, surpassing traditional intumescent coatings and tapping into a projected replacement market by 2031.
By Precursor/Raw-Material:
Metakaolin Gains on Fly-Ash ScarcityIn 2025, fly-ash systems command a 45.78% share of precursor demand, but their dominance wanes annually as coal plants shutter in OECD markets. By 2031, metakaolin products are set to carve out a notable slice of the geopolymer market, growing at a 11.67% CAGR. Betolar's calcination facility in Lapland underscores the economic viability, especially with an abundance of regional clays. In South Korea, slag-based mixes thrive, bolstered by electric-arc furnaces ensuring consistent feedstock chemistry and government subsidies covering a portion of research and development expenses.
In India and Vietnam, rice-husk ash blends cater to rural-housing initiatives, capitalizing on a zero-cost agricultural waste stream that boasts high silica content post-controlled combustion. While red mud and waste glass offer circular-economy benefits, they necessitate additional steps to counteract alkalinity and alkali-silica reactivity, inflating processing costs. On volcanic islands devoid of fly-ash logistics, basalt powder is gaining traction, achieving strengths apt for non-structural elements. Quality control measures are intensifying: Chinese manufacturers are blending metakaolin into Class F fly ash, slashing batch rejects significantly.
Geography Analysis
APAC Geopolymer Market
In 2025, Asia-Pacific commanded a 44.31% share of the revenue, driven by China's solid-waste utilization quotas and India's ambitious Green Cement Mission. In a notable achievement, Jiangsu and Zhejiang rolled out affordable housing using fly-ash geopolymers, reaping cost savings by sidestepping clinker imports. Thanks to India's IS 18417:2024 standard, placements accelerated on national highways. Japan, prioritizing seismic safety, designated geopolymer grouts for upgrading bridge piers, while South Korea's Green New Deal backed pilot projects at ports and subways.
North America and Europe Geopolymer Market
North America is capitalizing on an allocation for low-carbon concrete under the Infrastructure Investment and Jobs Act. Initial contracts are zeroing in on coastal levee enhancements and mass-timber hybrid towers, where every ounce of weight savings counts. In Europe, Germany invested in geopolymer pilot plants located in North Rhine-Westphalia. Meanwhile, the UK is ambitiously aiming for a reduction in embodied carbon across its public projects by 2030. France's RE2020 regulation has spurred a surge in demand, with Greater Paris housing witnessing installations in 2025.
MEA Geopolymer Market
The Middle-East and Africa are leading the charge with a 10.92% CAGR. NEOM's visionary linear city is mandating low-carbon concrete for all foundation pours, securing long-term contracts with local geopolymer suppliers. In a significant move, Saudi Aramco successfully tested geopolymer well cement in the high-temperature Jafurah shale play, achieving commendable isolation results. The UAE's Masdar City Phase II is integrating geopolymer mixes into its structural concrete. South African school initiatives and the façades of Egypt's New Administrative Capital underscore the continent's growing embrace of these materials, frequently linked to indigenous fly-ash or clay resources.
Mordor Intelligence provides coverage of the geopolymer market across other key regional markets, including Asia, North America, and Europe, each with their regulatory frameworks and demand patterns. Detailed country-level analysis extends to China incorporating local coverage and market participation, as required.

Regulatory Landscape
Geopolymer adoption continues to be shaped by a patchwork of building-code acceptance and emerging product specifications tied to embodied-carbon procurement. In the European Union, carbon-cost pressure on clinker is rising with the Carbon Border Adjustment Mechanism starting in 2026, reinforcing tender-driven demand for low-carbon binders under public works programs and Green Deal-aligned construction policy. At the same time, standards activity is reducing technical ambiguity: ASTM C1948-24 provides a specification framework for geopolymer concrete, and Australia has moved further than most markets with SA TS 199:2023 covering design and construction for geopolymer and alkali-activated binder concrete structures.
Regional and project-level approvals still dominate structural use in many markets, but localized rulemaking is appearing more frequently. China has provincial requirements such as DB14/T 3532-2025 in Shanxi for fly ash-based geopolymer mortar and concrete, specifying mix design, construction, and quality inspection. In Europe and adjacent jurisdictions that rely on third-party certification for construction products, compliance pathways are becoming clearer as well. For instance, Geobear secured verification of compliance with Irish Building Regulations through British Board of Agrément certification for its geopolymer injection technology (July 2026), supporting broader use in regulated ground-improvement and repair scopes.
Value Chain Analysis
The geopolymer value chain starts with precursor sourcing and qualification, typically coal fly ash, slag (including GGBFS and other industrial slags), and metakaolin, followed by procurement of alkaline activators such as sodium/potassium silicates and hydroxides. Upstream dynamics are increasingly defined by feedstock availability and consistency: coal-plant retirements reduce fly ash supply in several OECD markets, pushing formulators toward metakaolin, ground glass pozzolans, or blended precursor strategies, while slag supply is more resilient in regions with electric-arc steel capacity. Activators remain a cost and logistics pinch point because they are heavy, energy-linked, and often imported in parts of South America and Africa, which raises landed cost and complicates handling.
Midstream conversion includes binder formulation (including one-part dry-activated systems), batching into ready-mix concrete, and industrialized precast production where controlled curing and quality control reduce performance variability. Commercial scaling increasingly runs through partnerships between technology owners and established construction materials groups. Consolis entered a three-year license and supply agreement with Betolar (January 2025) to produce low-carbon hollow-core slabs using Geoprime binder, while Ecocem partnered with TITAN Group to develop and deploy its ACT low-carbon cement technology in Greece (April 2025). TITAN also signed a memorandum of agreement with Carbon Upcycling for feasibility work at two cement plants (June 2025). Downstream distribution routes mirror conventional concrete channels (ready-mix networks, precast sales, and specialty contractors), but projects with strict embodied-carbon documentation and durability requirements are pushing suppliers toward localized production near qualified waste streams to manage both cost and scope 3 emissions.
Competitive Landscape
The geopolymer market is fragmented. Machine-learning platforms shorten formulation cycles. Feedstock integration is another differentiator: vertically integrated players co-locate plants near consistent ash or slag streams, mitigating quality swings that previously caused rejection rates. Market entry barriers persist where design codes lag, yet pilot approvals under performance-based clauses unlock local monopolies for early movers. Fireproofing for petrochemical tanks, railroad sleepers for high-speed corridors, and subsea grouts for floating wind remain under-penetrated but lucrative. Suppliers that can supply third-party durability data are expected to capture these white-space segments before 2030. Strategic partnerships with steel mills, utilities, and oil-field service firms are forming to secure circular-economy inputs and specialty distribution.
Geopolymer Industry Leaders
Wagners
CEMEX SAB de CV
Schlumberger Limited
PCI Augsburg GmbH
Betolar PLC
- *Disclaimer: Major Players sorted in no particular order
Geopolymer Market Companies Covered in this Report
- Banah UK Ltd
- Betolar PLC
- CEMEX SAB de CV
- Českých Lupkových Závodech AS
- ClockSpring|NRI
- GCP Saint Gobain
- Geopolymer Solutions LLC
- Green 360 Technologies
- Heidelberg Materials
- IPR
- Murray & Roberts
- PCI Augsburg GmbH
- RENCA Inc
- Rocla Pty Limited
- Schlumberger Limited
- Wagners
- Zeobond Pty Ltd

Market Opportunities and Future Outlook
The most immediate whitespace sits at the intersection of formalized performance standards and industrial-scale deployment, where geopolymer suppliers can convert pilot approvals into repeatable specifications for structural and infrastructure use. Standards and certification momentum is building through multiple lanes: China has DB14/T 3532-2025 as an application standard for fly ash-based geopolymer mortar and concrete, and India has an active standards pathway with the Bureau of Indian Standards drafting performance standards for alkali-activated binders (May 2026), which supports broader inclusion in green-building and public procurement frameworks. In Europe, third-party certification that maps directly to building regulations is also a commercialization lever, as shown by Geobear securing BBA certification recognized for Irish Building Regulations compliance for geopolymer injection technology (July 2026).
Industrialization efforts are also creating opportunities for suppliers that can lock in consistent, local precursor streams and deliver documented durability. NGE Group launched the 52-month Geoliant research project in January 2026 with a EUR 7.11 million investment to industrialize low-carbon concrete using geopolymer binders derived from construction waste, aligning geopolymer deployment with demolition-waste circularity rather than relying only on coal-ash availability. Across applications, near-term opportunity concentrates in repair and specialty performance niches where project owners value rapid strength gain, sulfate and chloride resistance, and fire performance, while large-volume building and transport segments depend on expanding acceptance under recognized standards and repeatable mix qualification across ready-mix and precast supply chains.
Recent Industry Developments in Geopolymer Market
- July 2026: Geobear secured verification of compliance with Irish Building Regulations through British Board of Agre9ment certification for its geopolymer injection technology. The certification provides a clearer route for specifying geopolymer-based ground improvement and repair in regulated Irish construction, reducing reliance on one-off project approvals.
- June 2025: TITAN Group signed a memorandum of agreement with Carbon Upcycling to run technical feasibility studies at two cement plants for CO2-upcycled construction materials. The work links cement-plant infrastructure to alternative binders and mineralized additives, supporting faster commercialization pathways for lower-carbon cementing systems that compete with or complement geopolymer formulations.
- December 2024: Suvo Strategic Minerals reached a non-binding agreement to form a joint venture with PT Huadi Bantaeng Industry Park to manufacture low-carbon cement using nickel slag in Indonesia. Using a locally available industrial by-product strengthens precursor security in a key Asia-Pacific geography and reinforces the broader shift toward waste-derived aluminosilicate and slag feedstocks in low-carbon binder supply chains.


Geopolymer Market Report Scope and Research Methodology
Market Definition and Coverage
For this study, the geopolymer market is defined as revenue generated from geopolymer binders and geopolymer-based products used as alternatives to ordinary Portland cement and conventional resin systems across construction and other industrial uses, counted at the point of sale by suppliers.
Scope exclusions: We exclude ordinary Portland cement and traditional resin systems when they are sold without geopolymer chemistry, along with general construction services and equipment not sold as geopolymer products.
Segments Covered in This Report
- By Product Type
- Cement, Concrete and Pre-cast Panels
- Grout and Binder
- Other Product Types
- By Application
- Building
- Road and Pavement
- Runway
- Pipe and Concrete Repair
- Bridge
- Tunnel Lining
- Railroad Sleeper
- Coating Application
- Fireproofing
- Nuclear Other Toxic Waste Immobilization
- Specific Mold Products
- By Precursor/Raw-Material
- Fly Ash Based
- Slag Based
- Metakaolin Based
- Rice-Husk Ash and Agricultural Wastes
- Others (Red-Mud and Bauxite Residue and Waste Glass and Basalt Powders)
- By Geography
- Asia-Pacific
- China
- India
- Japan
- South Korea
- ASEAN Countries
- Rest of Asia-Pacific
- North America
- United States
- Canada
- Mexico
- Europe
- Germany
- United Kingdom
- France
- Spain
- Italy
- Russia
- Rest of Europe
- South America
- Brazil
- Argentina
- Rest of South America
- Middle-East and Africa
- Saudi Arabia
- United Arab Emirates
- Rest of Middle-East and Africa
- Asia-Pacific
Data Sources, Market Sizing, and Validation
Desk Research
Desk work starts with clarifying what gets counted and what does not, so later numbers do not get mixed with standard cement, conventional concrete, or generic coatings. We review public materials and sustainability standards that influence demand, and then map them to use areas such as building, road and pavement, tunnel lining, coatings, and fireproofing.
For grounding data, we rely on non-paywalled sources such as the US Geological Survey for mineral and cement context, the International Energy Agency for decarbonization signals tied to cement substitution, and ASTM and ISO standards pages for materials definitions and testing pathways. We also use government infrastructure and construction statistics (from national statistical offices). For supplementary triangulation, we reference company filings, investor presentations, patents, and trade and shipment indicators supported by a paid subscription covering import and export shipment-level data, and a paid subscription for patent databases. These examples are not exhaustive, and many other public sources were checked for data collection, cross-checking, and research clarification.
Primary Interviews and Surveys
Primary discussions were used to validate what is commercially sold as geopolymer, how pricing is quoted across binder versus finished products, and what adoption looks like across construction and selected industrial uses. We spoke with a mix of material producers, formulators, distributors, contractors, and specification stakeholders across APAC, EMEA, and the Americas, so assumptions from desk research could be corrected before the final market build.
Distribution of primary research fieldwork respondents
| Company type | Respondent position | Region |
|---|---|---|
| Top tier: 33% | CXOs: 19% | APAC: 52% |
| Mid tier: 48% | Functional/Unit leaders: 26% | EMEA: 30% |
| Smaller Players: 19% | Managers: 55% | Americas: 18% |
Market-Sizing & Forecasting
The core sizing logic uses a top-down build that reconstructs demand from construction activity and replacement potential, and then converts that demand pool into geopolymer revenue through adoption and pricing assumptions that were checked in interviews. To keep the totals realistic, we corroborate the outcome with selective bottom-up approximations, including supplier revenue bands, sampled project usage rates, and average selling price (ASP) times volume checks for key product forms.
Inputs used in the model include indicators like infrastructure and building spend trends, the share of low-carbon material specifications in public projects, and the availability and pricing direction of aluminosilicate precursors such as fly ash, slag, and metakaolin. We also incorporate typical binder-to-aggregate usage ratios in concrete applications, and average selling price differences between geopolymer binder, geopolymer concrete, and related coatings. When a country lacks consistent public time series for a variable, we bridge gaps using proxy indicators such as broader cement and concrete activity or construction output, and then re-test the implied adoption rate with local expert feedback.
Forecasts are generated using scenario analysis, where adoption pathways are set around policy push, precursor supply stability, and the pace of qualification in codes and standards. The final yearly curve is then smoothed so it matches the ramp-up timing described by respondents, rather than assuming straight-line growth.
Data Validation & Update Cycle
Each estimate goes through cross-checks against independent signals, including construction output direction, precursor availability, and observed pricing movement for binders and finished products. If a country or application shows a sharp jump, we re-check the math, review assumptions again, and re-contact sources when the variance cannot be explained by a known event.
Before sign-off, the model and narrative are reviewed in steps so unit logic, currency conversion timing, and year alignment are consistent across chapters. Reports are refreshed annually, and interim updates are made when a material event changes demand or pricing. Right before delivery, a fresh analyst pass is done so clients receive the latest updated view.
Mordor Intelligence's Geopolymer Market Estimate Compared With Other Published Estimates
Different publishers often report different geopolymer market values because they do not count the same product scope, they apply different adoption curves, and they update price assumptions at different times. The starting year can also shift results, especially when construction activity and precursor availability are moving.
Some published numbers lean toward a wider chemistry umbrella that can include adjacent low-carbon binders or broader end uses, which can lift totals faster in the early years. In Mordor Intelligence, the total is limited to geopolymer binders and geopolymer-based products sold into defined applications, and it is tied back to construction demand signals and interview-validated ASP ranges before the final number is set.
Benchmark comparison
| Source | Market Size | Gaps in Research Methodology |
|---|---|---|
| Mordor Intelligence | USD 9.64 B (2026) | |
| Trade Journal A | USD 9.70 B (2023) | Uses an earlier base year and applies a faster adoption ramp, and its scope presentation is broader at the product level, which can pull in adjacent binder uses that are not consistently specified as geopolymer in project procurement. |
| Global Consultancy B | USD 8.99 B (2024) | Anchors sizing on a different year and emphasizes a wider set of end-use industries, which can shift the counted revenue mix toward non-construction applications and can change ASP blending compared with a construction-led demand pool. |
The comparison shows that the spread is mainly explained by year selection, how wide the included product and end-use set is, and the way adoption and ASP progression are applied. By keeping the count tied to clearly defined geopolymer products and sanity-checking it against construction activity and realistic pricing bands, the estimate stays traceable to inputs that can be re-tested and updated as conditions change.


Key Questions Answered in the Report
What is the projected value of the geopolymer market in 2031?
The market is forecast to reach USD 16.15 billion by 2031 under a 10.88% CAGR from USD 9.64 billion in 2026.
How do geopolymers cut embodied carbon compared with Portland cement?
Lifecycle studies show lower CO₂ emissions, which helps public projects meet aggressive carbon thresholds.
Which application is expanding fastest through 2031?
Nuclear and toxic-waste immobilization is expected to grow at an 11.25% CAGR as aging reactors enter decommissioning.
Why is metakaolin becoming a preferred precursor?
Coal-plant closures limit fly-ash supply, and metakaolin enables ambient curing, cutting energy costs in precast operations.
Which region offers the highest growth potential beyond 2026?
The Middle-East and Africa region is poised for a 10.92% CAGR, led by mega-projects like NEOM and offshore retrofits.
What limits the broader adoption of geopolymer concrete in buildings?
A lack of harmonized design standards, particularly in ASTM and ACI codes, adds months to permitting and raises engineering costs.
Page last updated on:


 Your data is secure and never sold or shared.


