
Gastric Cancer Treatment Market Size and Share
Market Overview
| Study Period | 2020 - 2031 |
|---|---|
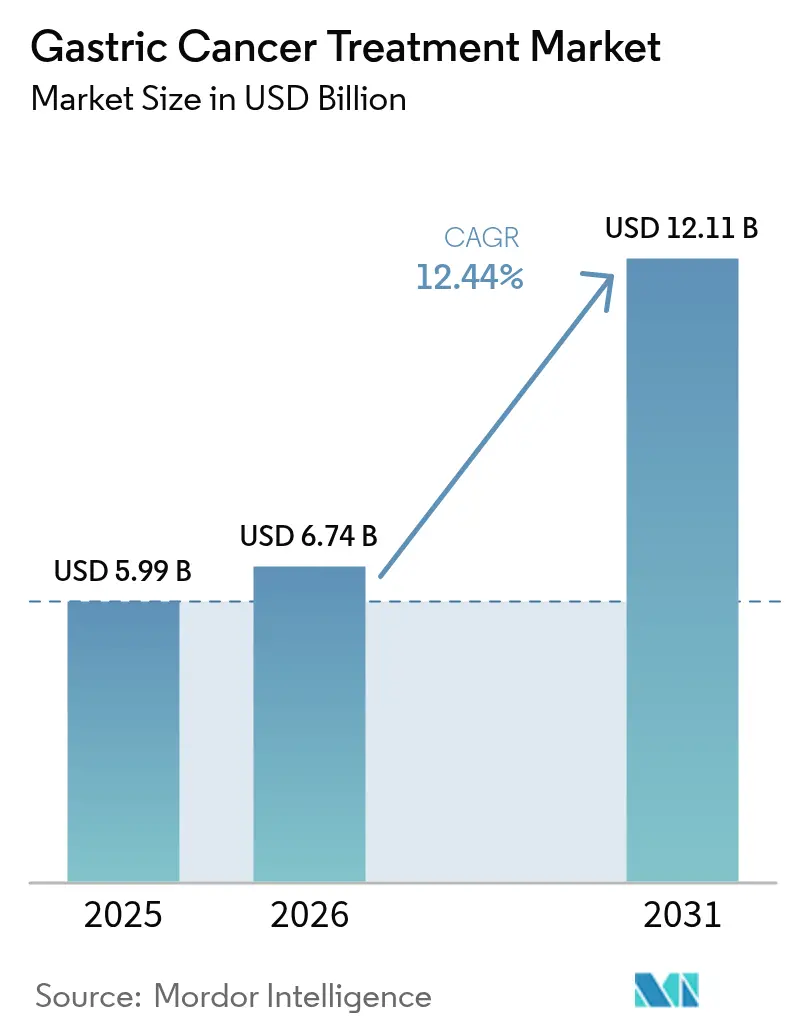
| Market Size (2026) | USD 6.74 Billion |
| Market Size (2031) | USD 12.11 Billion |
| Growth Rate (2026 - 2031) | 12.44 % |
| Fastest Growing Market | Asia Pacific |
| Largest Market | North America |
| Market Concentration | Medium |
Major Players *Disclaimer: Major Players sorted in no particular order Image © Mordor Intelligence. Reuse requires attribution under CC BY 4.0. | |
Gastric Cancer Treatment Market Analysis by Mordor Intelligence
Gastric cancer treatment market size in 2026 is estimated at USD 6.74 billion, growing from 2025 value of USD 5.99 billion with 2031 projections showing USD 12.11 billion, growing at 12.44% CAGR over 2026-2031. Accelerating incidence among aging cohorts, rapid immunotherapy adoption, earlier biomarker testing, and China’s high-volume procurement reforms together underpin growth momentum in every major region. Artificial-intelligence–supported endoscopic screening is shifting detection toward curable stages, while companion diagnostics now inform a widening set of precision regimens that improve outcomes and extend treatment duration. Five breakthrough approvals secured United States clearance between October 2024 and March 2025, and parallel fast-track systems in Japan and the European Union are narrowing launch timelines for late-stage candidates, reinforcing revenue visibility for innovators. Conversely, high post-surgical complication costs and uneven biomarker reimbursement across emerging economies still place friction on optimal care, tempering near-term adoption curves for premium drugs in some markets.
Key Report Takeaways
- By therapy type, chemotherapy led with 41.72% revenue share in 2025, whereas immunotherapy is set to advance at a 13.22% CAGR through 2031.
- By drug class, PD-1/PD-L1 inhibitors captured 19.96% of the gastric cancer treatment market share in 2025, while FGFR2 inhibitors are poised to grow at a 12.49% CAGR up to 2031.
- By disease stage, recurrent cases commanded 22.63% of the gastric cancer treatment market size in 2025, and early-stage (0-IA) disease is forecast to expand at a 13.55% CAGR through 2031.
- By route of administration, intravenous delivery dominated with 68.15% share in 2025; oral formulations are projected to rise at a 12.78% CAGR over the same horizon.
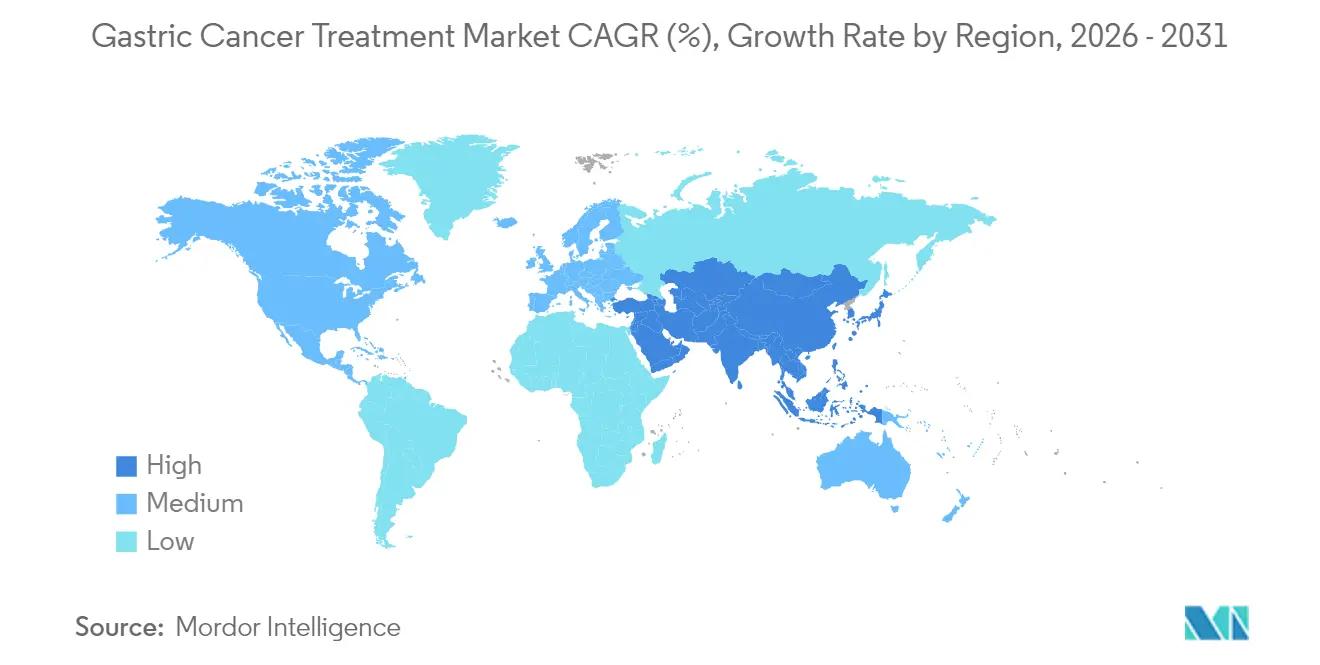
- By geography, North America generated 41.87% revenue share in 2025, while Asia-Pacific is expected to post the fastest 15.31% CAGR toward 2031.
Note: Market size and forecast figures in this report are generated using Mordor Intelligence’s proprietary estimation framework, updated with the latest available data and insights as of 2026.
Market Trends and Insights
Drivers Impact Analysis of Gastric Cancer Treatment Market*
| Driver | (~) % Impact on CAGR Forecast | Geographic Relevance | Impact Timeline |
|---|---|---|---|
| Aging population & H. pylori prevalence upswing | +2.8% | Global, concentrated in Asia-Pacific and Europe | Long term (≥ 4 years) |
| Uptake of PD-1/PD-L1 checkpoint inhibitors | +1.9% | North America & EU leading, APAC following | Medium term (2-4 years) |
| Earlier HER2-positive testing protocols | +1.2% | Global, with faster adoption in developed markets | Medium term (2-4 years) |
| China's volume-based procurement price drops | +0.8% | China primarily, spillover to other APAC markets | Short term (≤ 2 years) |
| AI-driven endoscopic screening pilots | +1.1% | Japan, South Korea, Germany leading adoption | Medium term (2-4 years) |
| mRNA neo-antigen vaccine pipelines | +0.7% | North America & EU clinical centers | Long term (≥ 4 years) |
| Source: Mordor Intelligence | |||
Aging Population & H. pylori Prevalence Upswing
Demographic aging combines with lingering H. pylori infection to keep baseline incidence on an upward slope, particularly across Japan, South Korea, China, and southern Europe where historic exposure persists despite eradication programs. Hospital discharge databases in Tokyo show that people ≥65 years account for more than 70% of new gastric cancer diagnoses, confirming the demand wave entering oncology clinics. Because remission often requires lengthy multimodal therapy and frequent follow-up, older patients typically consume higher cumulative drug volumes, a dynamic that inflates lifetime spend per case inside the gastric cancer treatment market. In addition, real-world analyses indicate that geriatric toxicity management protocols have improved markedly over the past two years, enabling clinicians to sustain systemic regimens longer without dose reductions, thereby raising average selling volumes for checkpoint inhibitors and targeted agents. Payors nonetheless struggle with the budget impact of treating larger elderly cohorts, prompting a shift toward value-based reimbursement schemes that tether payment to outcomes over multiyear horizons. Although preventive measures continue to expand, their epidemiologic benefit will materialize only gradually, securing a long runway of sustained therapy demand within the gastric cancer treatment market.
Uptake of PD-1/PD-L1 Checkpoint Inhibitors
First-line adoption of pembrolizumab plus trastuzumab and chemotherapy, approved in March 2025, raised median progression-free survival from 7.3 to 10.9 months, altering front-of-card treatment algorithms in North America and Europe. Health-technology-assessment dossiers submitted in France and Italy indicate an incremental cost per quality-adjusted life-year that falls below national willingness-to-pay thresholds when the drug is used in biomarker-positive patients, propelling formulary inclusion and anchoring revenue growth across the gastric cancer treatment market. Similarly, the perioperative use of durvalumab combinations slashed recurrence risk by 29% in randomized trials presented at ASCO 2025, prompting guideline committees to recommend immune modulation earlier in the disease course. Importantly, response durability for patients with low PD-L1 scores has improved when checkpoint blockade is paired with trastuzumab or cytotoxic agents, expanding the treatable cohort by as much as one-third according to pooled Phase 3 data.
Earlier HER2-Positive Testing Protocols
The European Union’s approval of the VENTANA CLDN18 RxDx assay in July 2024 initiated a shift toward panel-based tumor profiling that assesses HER2, CLDN18.2, FGFR2, and PD-L1 from a single biopsy slide, cutting time-to-result to fewer than five days in leading cancer centers. Adoption studies in Germany found that broad panels doubled the proportion of patients flagged for targeted therapy versus sequential single-marker testing, expanding addressable volume for trastuzumab deruxtecan, zolbetuximab, and upcoming FGFR2 inhibitors. Hospitals in metropolitan Seoul report that same-day reflex testing embeds molecular pathology into initial diagnostic workflows, allowing oncologists to start biomarker-guided regimens one treatment cycle sooner, which can improve overall survival by two to three months in curative-intent cases. Early identification also reduces futile exposure to ineffective chemotherapy, truncating toxicity-related expenditures and reinforcing payer support for systematic testing expansion. As emerging markets retrofit pathology labs with automated immunohistochemistry platforms, the gastric cancer treatment market gains a new lever for case-volume expansion driven by diagnostic penetration rather than raw incidence alone.
China’s Volume-Based Procurement Price Drops
Under the National Reimbursement Drug List negotiations concluded in December 2024, average ex-factory prices for key gastric oncology brands fell by 60-80%, widening access for an estimated 150,000 patients annually. Manufacturers responded by adopting a tiered-pricing strategy: lower margins in China are counter-balanced by guaranteed high volumes, while pricing elsewhere now references Chinese procurement in value-based contracts. Real-world prescription audits confirm that hospital use of nivolumab and trastuzumab deruxtecan grew more than threefold in provincial centers during the first two quarters of 2025, compensating for the unit-price erosion and driving absolute revenue gains regionally. Neighboring countries such as Vietnam and Malaysia have begun exploring comparable procurement models, signaling a potential spread of the volume-at-scale paradigm that could reshape margins but also enlarge patient reach in the gastric cancer treatment market.
Restraints Impact Analysis of Gastric Cancer Treatment Market*
| Restraint | (~) % Impact on CAGR Forecast | Geographic Relevance | Impact Timelin |
|---|---|---|---|
| High post-surgical complication costs | -1.4% | Global, more pronounced in emerging markets | Medium term (2-4 years) |
| Limited biomarker reimbursement outside Tier-1 cities | -0.9% | China, India, other emerging APAC markets | Short term (≤ 2 years) |
| Shortage of GI oncology specialists in LATAM | -0.7% | Latin America, spillover to other emerging regions | Long term (≥ 4 years) |
| Supply-chain fragility for liposomal formulations | -0.6% | Global, acute in regions with limited cold-chain infrastructure | Medium term (2-4 years) |
| Source: Mordor Intelligence | |||
High Post-Surgical Complication Costs
Major gastrectomy complications occur in 15-25% of cases and cost USD 15,000–25,000 per readmission, burdening payers and delaying adjuvant therapy, which can worsen survival outcomes by 10-15% for affected patients. Data from public hospitals in Brazil, South Africa, and Indonesia show that complication care absorbs up to 30% of total in-patient oncology budgets, crowding out funds for modern systemic agents. Enhanced recovery after surgery and laparoscopic approaches are trimming complication rates to near 10% in high-volume centers, yet capital expenditure for robotics remains prohibitive for many middle-income countries. Until broader surgical standardization is achieved, payers may cap spending on premium adjuvant drugs for high-risk candidates, dampening uptake potential across parts of the gastric cancer treatment market. Consortiums involving device makers, surgical training bodies, and multilateral lenders are exploring outcome-based financing to lower entry barriers for minimally invasive platforms, but tangible impact will take several budget cycles to manifest.
Limited Biomarker Reimbursement Outside Tier-1 Cities
In China and India, comprehensive next-generation-sequencing panels often exceed USD 400—an amount surpassing the monthly income of large rural populations—forcing physicians to rely on chemotherapy alone for many biomarker-positive tumors. Provincial insurers in China usually reimburse only immunohistochemistry for HER2 in tertiary hospitals, leaving tests for CLDN18.2 or FGFR2 uncovered, which restricts eligibility verification for zolbetuximab or FGFR2 inhibitors. A similar disparity arises in India’s older National Health Mission facilities, where cash-pay diagnostic costs deter testing. The consequence is therapeutic inequity: published registries show that biomarker-guided therapy penetration falls below 15% outside Tier-1 urban hubs, limiting the real-world footprint of precision drugs. Telepathology and cartridge-based PCR assays promise to lower costs by up to 60%, yet scaling them requires regulatory harmonization and cloud-security frameworks that remain under development. Until such access gaps close, some growth headroom for the gastric cancer treatment market will stay unrealized.
*Our forecasts treat driver/restraint impacts as directional, not additive. The impact forecasts reflect baseline growth, mix effects, and variable interactions.
Gastric Cancer Treatment Market Segment Analysis
By Therapy Type:
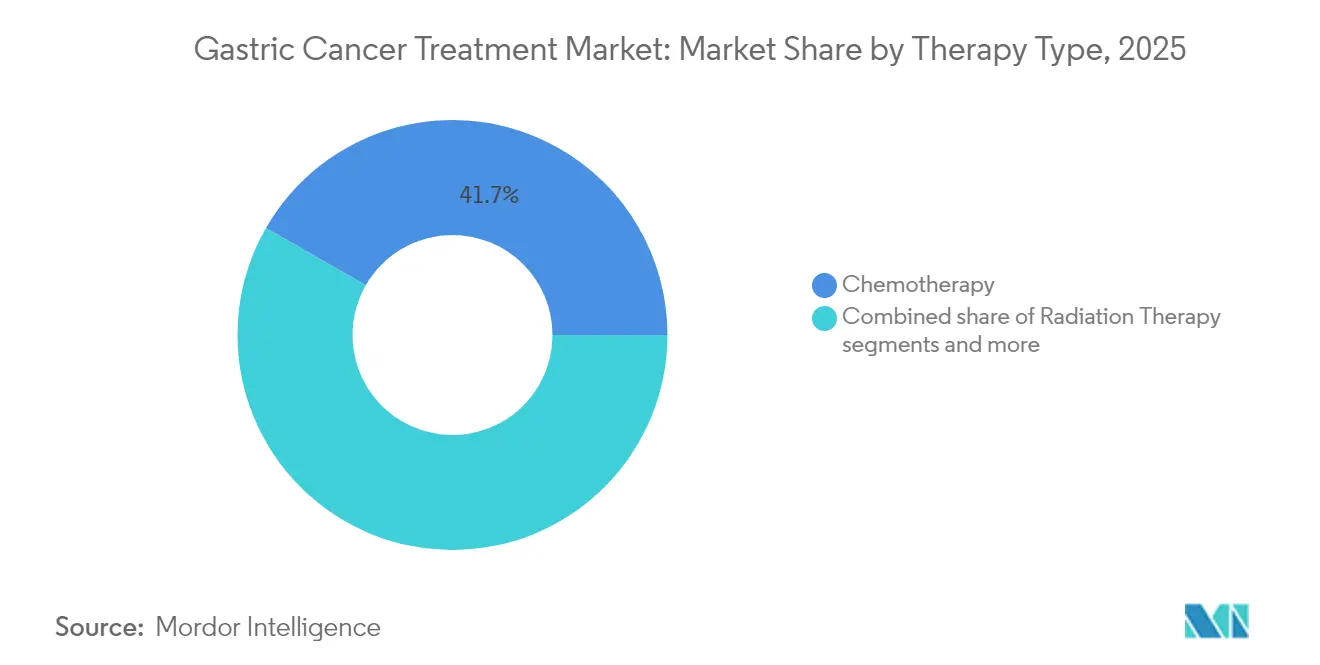
Immunotherapy Drives InnovationImmunotherapy generated roughly USD 1.2 billion in revenue within the gastric cancer treatment market in 2025, representing the segment with the fastest 13.22% CAGR and confirming its foundational role in modern care algorithms. Chemotherapy nonetheless kept a formidable 41.72% share during 2025 because it remains the backbone of first-line regimens, particularly in metastatic settings, and retains price advantages that make it the default in budget-constrained hospitals. Surgical resection volumes are climbing on the back of enhanced perioperative protocols, but systemic therapy cycles per patient continue to rise as immunologic agents extend survival, thereby sustaining repeat dosing. Radiation therapy holds a modest niche, largely confined to locally advanced tumors where organ preservation strategies augment resection margins.
The rapid pivot toward multidrug protocols blurs historical categorizations: checkpoint inhibitors now launch concurrently with cytotoxic backbones, and trastuzumab deruxtecan plus nivolumab combinations have progressed into Phase 3 testing for adjuvant settings, indicating that “combination therapy” will soon eclipse single-agent categories. Targeted therapy uptake accelerates whenever HER2 or FGFR2 testing is reimbursed, while palliative and supportive care regimens start earlier as improved survival prolongs symptom-management needs. Owing to these interlocking lines of therapy, specialist oncologists increasingly view drug selection through an integrated platform lens rather than discrete classes, a perspective that favors companies able to bundle immunotherapy, ADCs, and supportive agents into coordinated offerings across the gastric cancer treatment market.



By Drug Class:
FGFR2 Inhibitors Lead GrowthPD-1/PD-L1 inhibitors registered the single-largest 19.96% share of 2025 drug-class revenue, reflecting their entrenchment as standard of care across multiple lines. Yet their annual growth is moderating as penetration in high-income markets nears saturation. In contrast, FGFR2 inhibitors are projected to log the most rapid 12.49% CAGR, driven by striking response rates near 42% in FGFR2-amplified tumors and expected approvals in Japan and South Korea by 2026. On the horizon, bispecific antibodies that fuse PD-1 blockade with FGFR2 targeting are entering early clinical evaluations, setting the stage for step-change efficacy that could boost class share further.
Cytotoxic agents retain relevance by anchoring novel regimens and maintaining reimbursement advantages, especially in markets where biosimilar doxorubicin or oxaliplatin cost pennies on the dollar compared with branded biologics. HER2 antagonists strengthened footholds after the FDA’s tumor-agnostic approval for trastuzumab deruxtecan in April 2024, which prompted universal HER2 screening for all metastatic presentations. VEGF/VEGFR inhibitors and ADCs supply important adjunct activity: vascular normalization improves immune infiltration, while ADCs deliver lethal payloads to marker-rich cells, amplifying synergy with immune checkpoint blockade. Collectively, the mosaic of drug classes underscores that sustained differentiation arises from precise patient targeting and modular combination potential, reinforcing multiplatform strategies across the gastric cancer treatment market.
By Disease Stage:
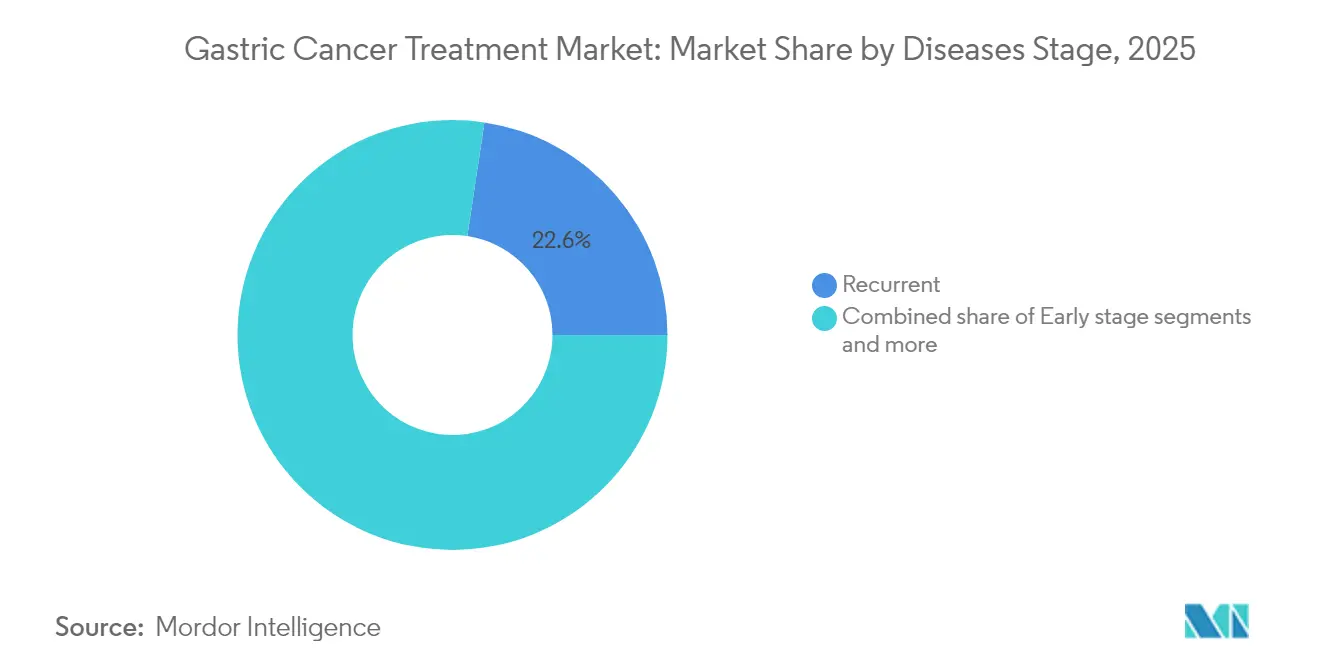
Early-Stage Gains MomentumEarly-stage 0-IA disease generated roughly USD 580 million in revenue in 2025 and leads all stages at a 13.55% CAGR as AI-assisted screening shifts diagnosis to less-advanced forms. Recurrent cases still ranked first in value, capturing 22.63% of 2025 segment dollars on account of high relapse incidence and prolonged systemic therapy. Resectable IB-III cases benefit from neoadjuvant chemotherapy coupled with immunotherapy, which raised R0 resection rates by 14% in recent multicenter trials and improved median disease-free survival by six months relative to surgery alone.
Management of unresectable locally advanced tumors remains complex; however, nivolumab plus paclitaxel regimens achieved 38.5% response in severe peritoneal metastasis, suggesting improvement for a historically refractory subgroup. Sustained adoption of perioperative immunotherapy compresses the time gap between surgery and systemic therapy initiation, potentially curtailing micro-metastatic progression. Advanced/metastatic disease continues to generate the highest drug-volume per patient because of successive treatment lines, yet better first-line control could gradually reduce reliance on late-line cytotoxics. As stage migration favors earlier detection, future value expansion in the gastric cancer treatment market will hinge more on adjuvant innovation than on salvage therapies.
By Route of Administration:
Oral Formulations ExpandIntravenous infusions realized roughly USD 4.08 billion in 2025, equal to 68.15% of total spend thanks to entrenched hospital protocols and the predominance of biologics. Oral drugs, led by capecitabine and apatinib, increased at a 12.78% CAGR, underscoring strong patient preference for home-based dosing and payer interest in lowering infusion center overhead.
Research focus is now steering toward oral checkpoint inhibitors and oral ADCs built on protease-cleavable linkers that survive gastric pH and release payload once systemically absorbed, technology initially commercialized in hematology but now targeting gastric solid tumors. Health systems in Australia documented 15% cost savings after switching suitable maintenance patients to oral therapy, reinforcing economic incentives. Telehealth-enabled adherence monitoring has further raised confidence in at-home regimens, shrinking concerns about missed doses. Provided pharmacokinetic parity is maintained, many intravenous agents could convert to oral, eroding infusion share and infusing fresh growth into the gastric cancer treatment market.
Geography Analysis
North America Gastric Cancer Treatment Market
North America generated 41.87% of global revenue in 2025 on the strength of broad insurance coverage, high drug pricing power, and expedited FDA review routes such as breakthrough therapy and real-time oncology review that speed access by six to eight months versus standard pathways. Yet growth deceleration is visible as payers layer value-based formularies: Canada’s May 2025 time-limited reimbursement for trastuzumab deruxtecan links payment continuation to interim real-world outcomes, foreshadowing broader outcome-based contracts.
APAC Gastric Cancer Treatment Market
Asia-Pacific leads growth with a 15.31% CAGR, fueled by China’s volume-based procurement, India’s expanding oncology infrastructure, and Japan’s near-automatic reimbursement for approved agents within 90 days. Chinese hospital claims show nivolumab usage tripled in lower-tier cities after inclusion in the 2024 procurement round, highlighting volume elasticity. India’s government cancer hospital network added eight new tertiary centers in 2025, each equipped with molecular diagnostics labs that fast-track biomarker screening. Japanese regulators approved a new AI-guided endoscopy system in April 2025, positioning the country to sustain leadership in early detection that feeds case volumes into systemic therapy pipelines.
EMEA and South America Gastric Cancer Treatment Market
Europe remains a mature yet cautious adopter, with health-technology-assessment rigor pushing companies to amass real-world evidence fast to secure national reimbursements. Germany’s statutory insurers widely reimburse perioperative immunotherapy after positive IQWiG appraisal, whereas Italy requires price-volume agreements that cap public spending. South America and the Middle East/Africa together account for just under 7% of the gastric cancer treatment market but hold latent upside as multinationals pilot patient-assistance schemes that subsidize biomarker testing and co-pay support. Broadly, geographic diversification reduces overexposure to any single reimbursement environment and adds resilience to the global gastric cancer treatment market.

Regulatory Landscape
Regulatory oversight in gastric cancer therapeutics is increasingly linked to biomarker-defined indications and companion diagnostics, with major agencies using expedited oncology pathways to shorten review cycles for high-unmet-need segments. In the United States, the FDA cleared multiple gastric/GEJ advances across 2024-2025, including Vyloy (zolbetuximab-clzb) in October 2024 for CLDN18.2-positive, HER2-negative disease, Tevimbra (tislelizumab-jsgr) in December 2024 in combination with chemotherapy for HER2-negative gastric/GEJ adenocarcinoma, and pembrolizumab plus trastuzumab and chemotherapy in March 2025 for HER2-positive, PD-L1-positive tumors. The perioperative setting also moved into mainstream regulation, with the FDA approving Imfinzi (durvalumab) in November 2025 for resectable gastric/GEJ cancers as part of a FLOT-based perioperative regimen.
In Europe, EMA actions reinforced the same biomarker-led direction, including the September 2024 EU marketing authorization for Vyloy and the January 2026 CHMP positive opinion supporting an Imfinzi indication expansion in resectable gastric/GEJ adenocarcinoma (pending European Commission decision at the time of the opinion). China added momentum in 2026 through NMPA approvals that broadened both earlier-stage and later-line options, including a June 2026 approval of serplulimab for neoadjuvant/adjuvant treatment in resectable gastric cancer (PD-L1 CPS threshold specified in the approval) and a July 2026 conditional approval of savolitinib (Orpathys) for MET-amplified advanced gastric/GEJ adenocarcinoma after multiple prior systemic treatments. Together, these decisions raise compliance expectations around validated assays (PD-L1, CLDN18.2, MET amplification) while expanding the number of labeled treatment lines available to providers.
Value Chain Analysis
The gastric cancer treatment value chain spans biomarker discovery and assay development, clinical trial execution in GI-oncology centers, complex biologics and cytotoxic manufacturing, specialty distribution, and hospital or infusion delivery with ongoing pharmacovigilance and real-world evidence generation for reimbursement. As biomarker-gated prescribing grows, diagnostic partners and quality-managed pathology workflows become more central, reflected in collaborations such as Transcenta working with Agilent to develop a Claudin18.2 companion diagnostic to support pivotal studies in gastric/GEJ adenocarcinoma.
On the supply side, oncology manufacturing strategies continue to emphasize resilience and compliance as more regimens combine biologics, ADCs, and chemotherapy backbones, increasing coordination across drug substance, fill-finish, cold-chain logistics, and hospital pharmacy preparation. A concrete example is Boryeong initiating shipment of pemetrexed (Alimta) to Lotus Pharmaceuticals in Taiwan in May 2026 under a CDMO agreement, illustrating how regional manufacturing and cross-border supply arrangements support continuity for cytotoxic components used alongside newer immuno-oncology agents. As perioperative immunochemotherapy expands via approvals such as FDA (December 2025) and European Commission (February 2026) actions for durvalumab plus FLOT, the downstream chain becomes more integrated with surgical pathways, increasing the operational need for synchronized diagnostics, perioperative scheduling, and reliable drug availability across pre- and post-surgery treatment windows.
Competitive Landscape
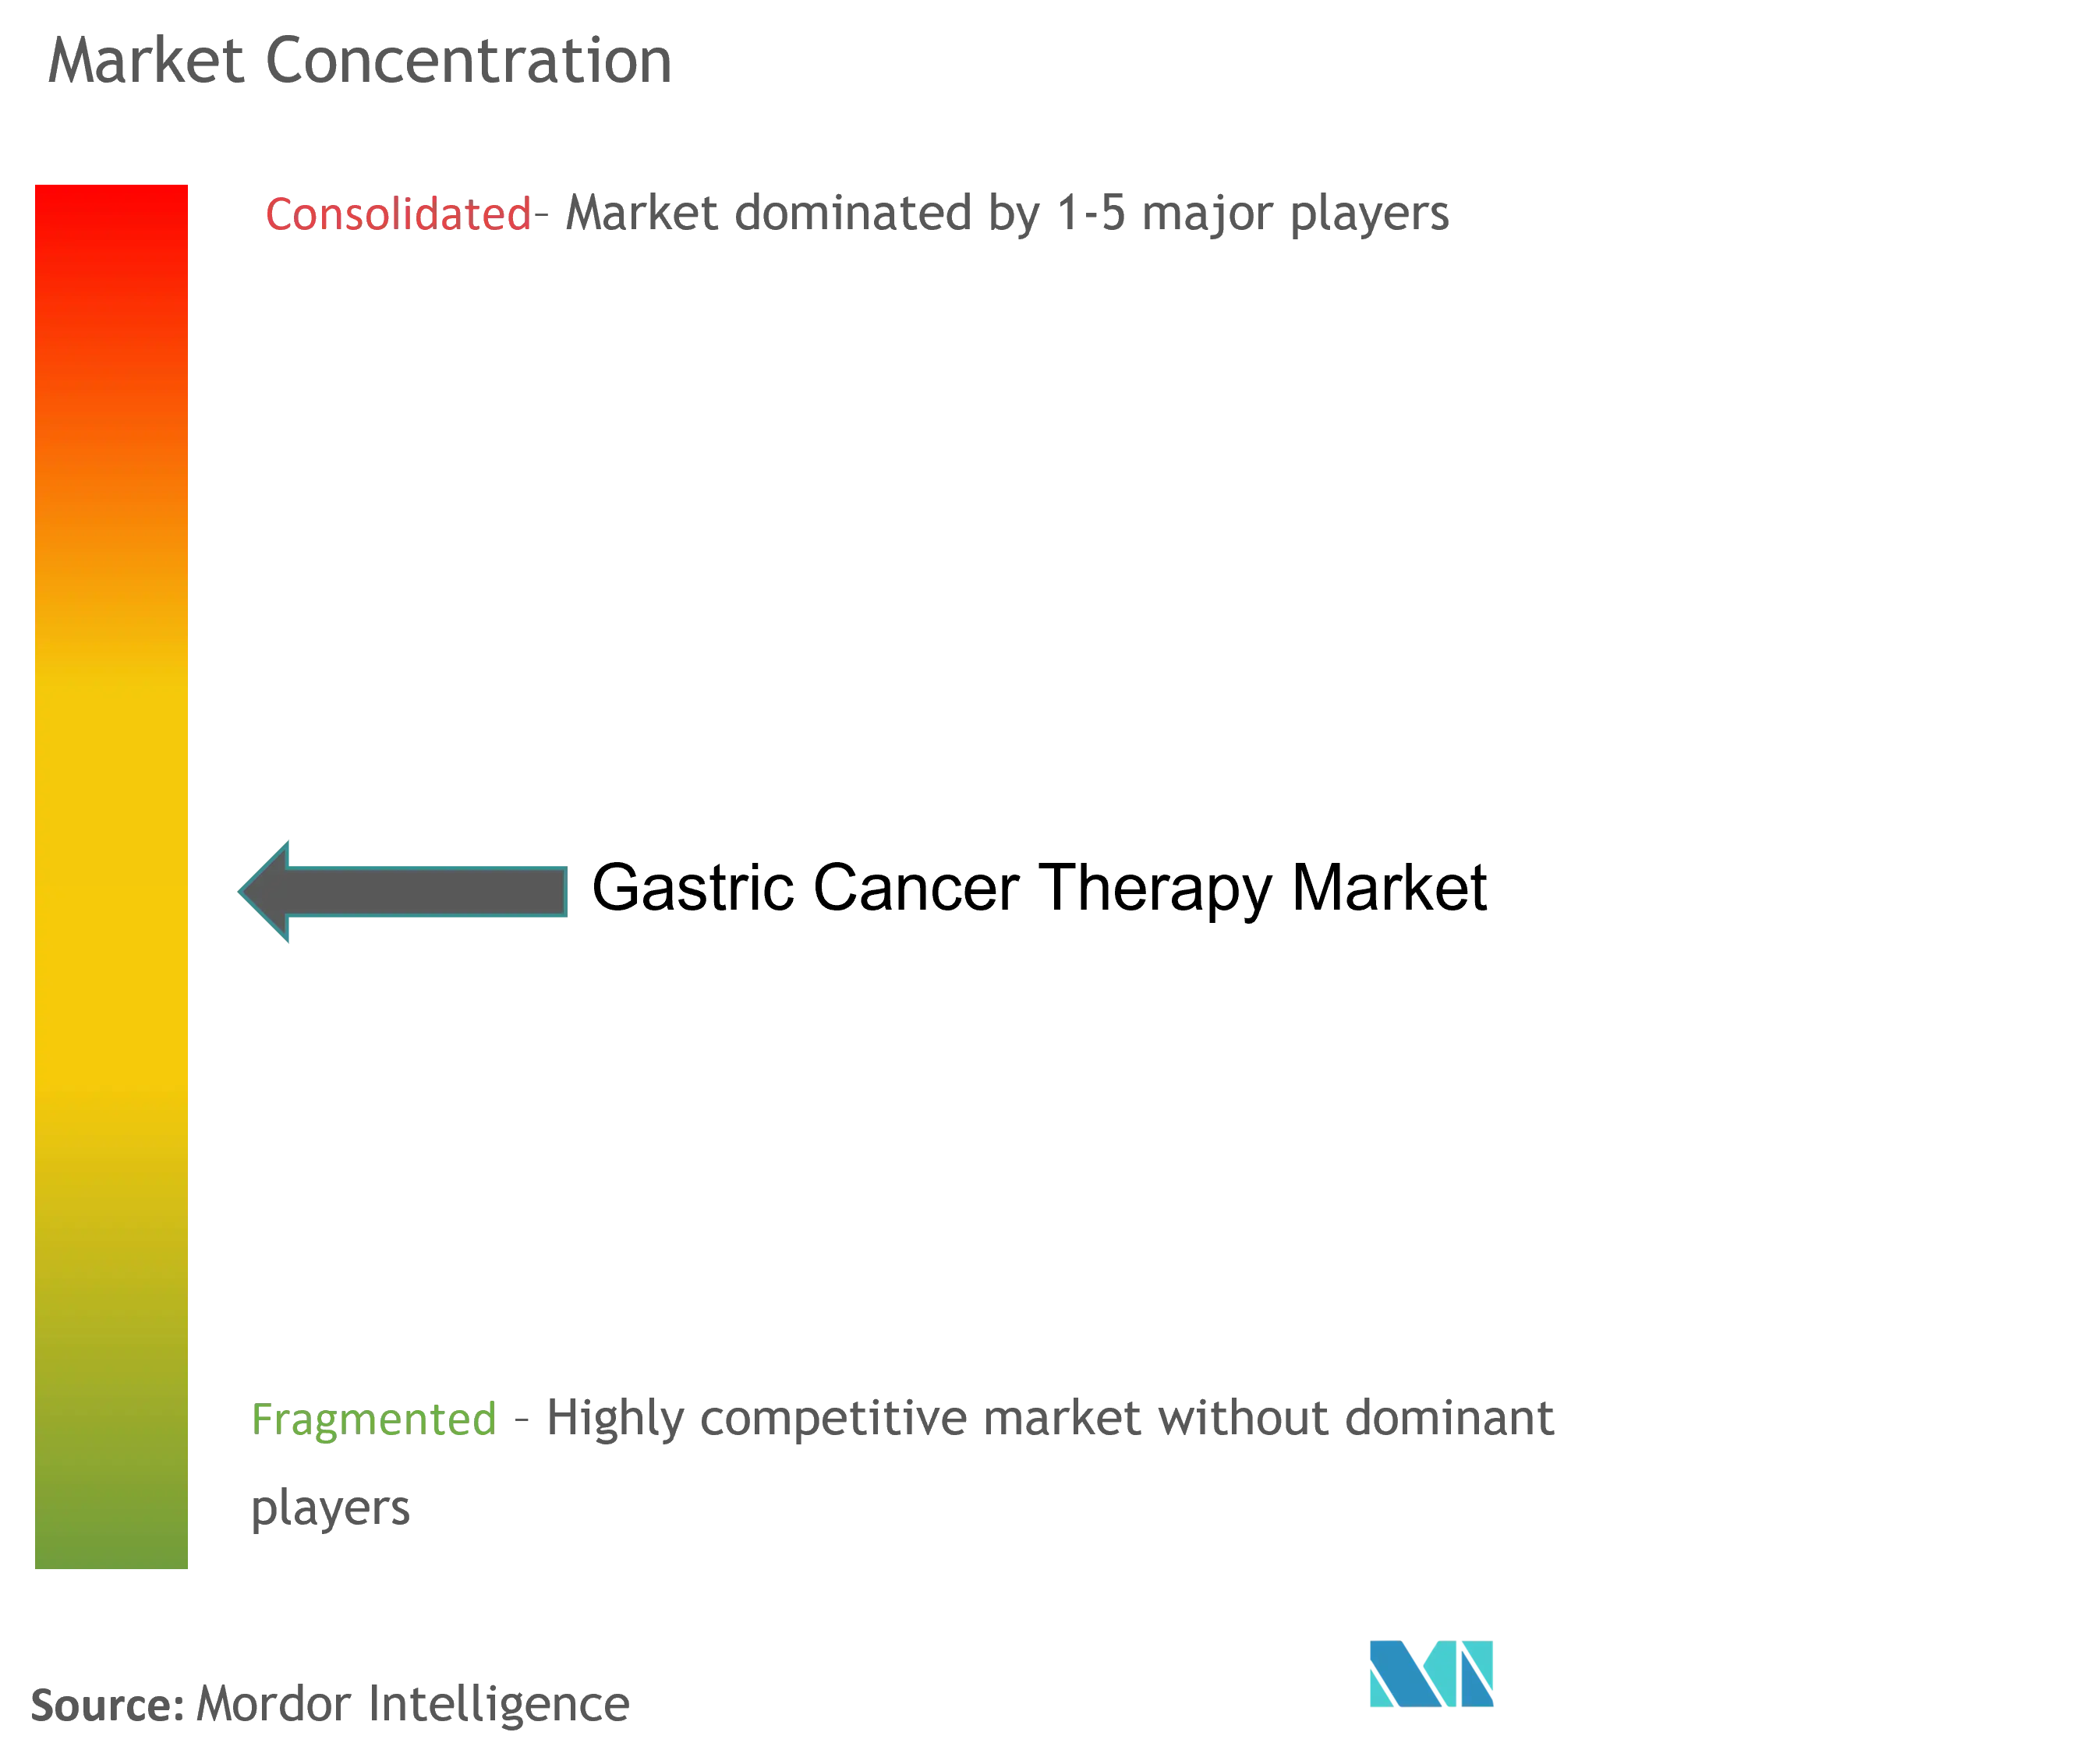
The gastric cancer treatment market shows moderate consolidation: the top five companies—Roche, Merck, Bristol Myers Squibb, AstraZeneca, and Pfizer—collectively capture slightly above half of annual sales, underscoring high development barriers tied to complex biologic manufacturing and stringent regulatory proof standards.
Leading firms are pivoting from single-asset launches to ecosystem strategies that wrap drug, diagnostic, and digital services into cohesive offerings. Roche packages its anti-HER2 biologics with the approved CLDN18 assay, while AstraZeneca deploys adherence apps and remote-monitoring wearables alongside its oral pipeline, aiming to lock in market share via superior patient experience. Biosimilar entrants nibble at first-generation antibodies, yet next-generation ADCs and bispecific constructs remain insulated by intellectual-property depth and manufacturing complexity.
Licensing and co-development deals intensify as Western majors team up with Chinese biotechs—BeiGene licenses tislelizumab U.S. commercialization rights to Novartis, while Innovent collaborates with Eli Lilly on global fusions of checkpoint blockade and VEGF inhibition. Artificial-intelligence partnerships target discovery acceleration; Merck’s alliance with a Silicon Valley start-up slashed preclinical target-identification time by half, potentially compressing development cycles. Looking ahead, companies wielding integrated therapy-diagnostic-analytics platforms appear best positioned to sustain leadership in the gastric cancer treatment market.
Gastric Cancer Treatment Industry Leaders
Eli Lilly and Company
Pfizer Inc.
F. Hoffmann-La Roche Ltd
Celltrion Inc.
Merck & Co
- *Disclaimer: Major Players sorted in no particular order
Gastric Cancer Treatment Market Companies Covered in this Report
- Roche
- Merck
- Bristol-Myers Squibb
- Eli Lilly and Company
- Daiichi Sankyo Co., Ltd.
- Ono Pharmaceutical
- Pfizer
- AstraZeneca
- BeiGene Ltd.
- Astellas Pharma
- Taiho Pharmaceutical Co., Ltd.
- CARsgen Therapeutics
- MacroGenics
- Seagen
- Eisai
- Zai Lab Limited
- Innovent Biologics, Inc.
- Amgen
- Abbvie
- Chugai Pharmaceutical

Market Opportunities and Future Outlook
Opportunities are expanding around earlier-stage and perioperative use cases that increase total treatment duration and move advanced modalities into curative-intent settings, supported by recent regulatory and clinical momentum. The FDA approval of durvalumab (Imfinzi) with FLOT for resectable gastric/GEJ adenocarcinoma (November 2025) creates a defined commercialization pathway for perioperative immunochemotherapy, while Europe followed with the January 2026 CHMP positive opinion and a European Commission approval in February 2026. In parallel, peer-reviewed 2026 clinical evidence (including phase 3 ASTRUM-006 data published in June 2026) adds visibility to neoadjuvant immunotherapy combinations in biomarker-selected patients, supporting demand for integrated perioperative care models and for diagnostics that can return PD-L1 and other markers quickly enough to influence pre-surgery decisions.
A second key opportunity is the broadening of biomarker-driven segments beyond HER2 and PD-L1 into CLDN18.2 and MET amplification, creating room for targeted therapies and next-generation modalities alongside established PD-1/PD-L1 inhibitors and ADCs. China’s 2026 NMPA actions illustrate this diversification, with approvals spanning serplulimab in resectable PD-L1-defined disease (June 2026) and conditional approval of savolitinib (Orpathys) in MET-amplified advanced gastric/GEJ adenocarcinoma after multiple prior treatments (July 2026). These moves increase the value of scalable testing infrastructure (IHC and amplification assays) and make combination development (targeted agent plus immunotherapy or chemotherapy-sparing regimens) a practical way to differentiate in later lines, where resistance to standard chemotherapy and established biologics concentrates unmet need.
Recent Industry Developments in Gastric Cancer Treatment Market
- July 2026: HUTCHMED announced that China’s NMPA granted conditional approval for ORPATHYS (savolitinib) to treat locally advanced or metastatic gastric or gastroesophageal junction adenocarcinoma with MET amplification after failure of at least two prior systemic regimens. The decision formalizes MET amplification as a treated segment in a major market and strengthens the role of amplification testing to unlock additional targeted-therapy lines.
- November 2025: The US FDA approved AstraZeneca’s Imfinzi (durvalumab) with a FLOT-based regimen for perioperative (neoadjuvant and adjuvant) treatment of resectable gastric and gastroesophageal junction adenocarcinoma. This extends immunotherapy adoption into curative-intent pathways and increases the importance of coordinated surgical, diagnostic, and infusion-capacity planning across centers.
- October 2024: The US FDA approved Vyloy (zolbetuximab-clzb) for locally advanced or metastatic HER2-negative gastric or gastroesophageal junction adenocarcinoma with CLDN18.2-positive expression. The approval accelerated routine CLDN18.2 testing and expanded the first-line targeted-therapy toolkit beyond HER2, influencing trial designs and combination strategies across the market.


Gastric Cancer Treatment Market Report Scope and Research Methodology
Market Definition and Coverage
This market covers the revenue from treatments used to manage gastric cancer across care settings, including drug-based regimens and procedure-based care where it is clinically used for this disease. Revenue is measured based on treatment use in the covered geographies.
Scope exclusions: We exclude gastric cancer screening and diagnostic testing, general supportive care not tied to an active gastric cancer regimen, and non-medical wellness products.
Segments Covered in This Report
- By Therapy Type
- Surgery
- Chemotherapy
- Radiation Therapy
- Targeted Therapy
- Immunotherapy
- Combination Therapy
- Palliative & Supportive Care
- By Drug Class
- Cytotoxic Agents
- HER2 Antagonists
- PD-1/PD-L1 Inhibitors
- VEGF / VEGFR Inhibitors
- FGFR2 Inhibitors
- ADCs (Antibody–Drug Conjugates)
- Others
- By Route of Administration
- Intravenous
- Oral
- By Disease Stage
- Early Stage (0-IA)
- Resectable (IB-III)
- Unresectable Locally Advanced
- Advanced / Metastatic
- By Geography
- North America
- United States
- Canada
- Mexico
- Europe
- Germany
- United Kingdom
- France
- Italy
- Spain
- Rest of Europe
- Asia-Pacific
- China
- India
- Japan
- South Korea
- Australia
- Rest of Asia-Pacific
- South America
- Brazil
- Argentina
- Rest of South America
- Middle East and Africa
- GCC
- South Africa
- Rest of Middle East and Africa
- North America
Data Sources, Market Sizing, and Validation
Desk Research
Desk research was used to set the disease context and care pathway, then to anchor model inputs that can be checked year over year. Public sources referenced include GLOBOCAN and WHO cancer statistics, CDC and NIH materials (including clinical trial registries and trial publications), OECD health data, and country health ministry or national cancer registry releases where available. Peer-reviewed journals were also used for incidence by stage, treatment patterns, and outcomes, since these directly influence how long patients remain on therapy.
On the supply side, we reviewed company filings, investor presentations, product labels, and reputable medical press to track approvals, label expansions, and discontinuations that can shift adoption. Paid subscriptions were used for company financials and intelligence, plus patent and clinical pipeline tracking to interpret the timing of launches and directional pricing signals. These desk research sources are illustrative, and we reviewed additional references to compile inputs, validate assumptions, and clarify open questions.
Primary Interviews and Surveys
Primary work was conducted through expert interviews and structured surveys with oncologists, hospital pharmacists, payers, and industry professionals involved in gastric cancer therapy access and utilization. Respondent input was used to confirm real world line-of-therapy shares, biomarker testing uptake, switching behavior, and how pricing and reimbursement translate into net realized revenue across regions. Inputs were compared across major geographies to keep assumptions realistic, including differences in diagnosis timing and care infrastructure.
Distribution of primary research fieldwork respondents
| Company type | Respondent position | Region |
|---|---|---|
| Top tier: 27% | CXOs: 12% | APAC: 43% |
| Mid tier: 57% | Functional/Unit leaders: 43% | EMEA: 33% |
| Smaller Players: 16% | Managers: 45% | Americas: 24% |
Market-Sizing & Forecasting
Sizing starts from a top-down treated-patient demand pool that links gastric cancer incidence and stage split to the share of patients who reach systemic therapy or procedure-based care, then converts that demand to revenue using regimen duration and net price assumptions. To keep totals grounded, we applied selective bottom-up checks, including sampled therapy volumes by setting and channel checks on average selling price ranges, then adjusted the combined view when the two approaches did not align.
Key model inputs include incidence and prevalence trends, stage at diagnosis and resectability mix, biomarker testing penetration that gates targeted therapy and immunotherapy use, average cycles or months on treatment by line, and regional reimbursement or access constraints that affect uptake. Where direct data was limited (for example, smaller countries or newer regimens), we used proxy benchmarks from comparable healthcare systems, followed by expert validation before finalizing assumptions.
Forecasts were built using scenario analysis supported by near-term event tracking, including expected approvals, label expansions, and guideline changes that can shift treatment sequencing. Pricing paths were handled with assumptions around list-to-net dynamics and gradual mix shifts, then sensitivities were run so outcomes remained realistic under slower testing or slower access expansion.
Data Validation & Update Cycle
Outputs were validated through multiple checks, including comparing implied treated patients against epidemiology totals, reviewing regional therapy mix against clinical practice feedback, and flagging outliers in price or duration assumptions. When a variance was found, we traced it back to the specific input layer, corrected the assumption, and rechecked the totals so results stayed consistent across stages, routes, and care settings.
A multi-step review is followed before sign-off, with model logic and key assumptions reviewed by another analyst and then reconciled to the latest public signals. The report is refreshed annually, with interim updates triggered by material events such as major approvals, safety-related label changes, or reimbursement shifts. Before delivery, a final pass is completed so clients receive the most current view available.
Mordor Intelligence's Gastric Cancer Treatment Market Size Measured Against Other Published Estimates
Published market sizes for gastric cancer treatment can vary even when the topic label looks similar, because the counted revenue streams and the patient pool assumptions do not always match. Differences commonly come from what is treated as therapy revenue, how stage and line-of-therapy splits are built, and how net pricing is modeled across regions.
A key gap comes from whether the sizing ties targeted therapy and immunotherapy uptake to biomarker-tested patient shares and to the resectable versus unresectable stage mix. This is where Mordor Intelligence keeps the scope focused on treated patients rather than broader stomach cancer drug revenue totals.
Benchmark comparison
| Source | Market Size | Gaps in Research Methodology |
|---|---|---|
| Mordor Intelligence | USD 6.74 B (2026) | |
| Global Consultancy A | USD 5.37 B (2024) | Uses an earlier base year and may apply a broader stomach cancer drug revenue view without fully aligning stage mix and line-of-therapy duration, which can pull down later-line immunotherapy contribution in high-testing markets. |
| Trade Journal B | USD 4.50 B (2024) | Scope details are limited, and the lower growth profile suggests conservative adoption and pricing assumptions, with less explicit linkage to biomarker testing penetration and region-level access constraints. |
Across the table, most of the spread is linked to base-year timing and how the model converts epidemiology into treated demand by stage and line. The method used here is kept transparent, since the key inputs can be checked against public incidence data, guideline-driven sequencing, and interview feedback, then recalculated when new approvals or reimbursement changes occur.


Key Questions Answered in the Report
How large will the gastric cancer treatment market be by 2031?
The gastric cancer treatment market size is projected to reach USD 12.11 billion by 2031.
Which therapy modality is growing fastest?
Immunotherapy leads with a 13.22% CAGR through 2031.
Where is regional demand expanding most rapidly?
Asia-Pacific posts the highest 15.31% CAGR, driven by China, India, and Japan.
Which drug class currently commands the greatest share?
PD-1/PD-L1 inhibitors held 19.96% market share in 2025.
How significant will oral treatments become?
Oral formulations are expected to grow at a 12.78% CAGR as home-based care gains favor.
Page last updated on:


 Your data is secure and never sold or shared.


