Gaming Console Market Size and Share
Market Overview
| Study Period | 2020 - 2031 |
|---|---|
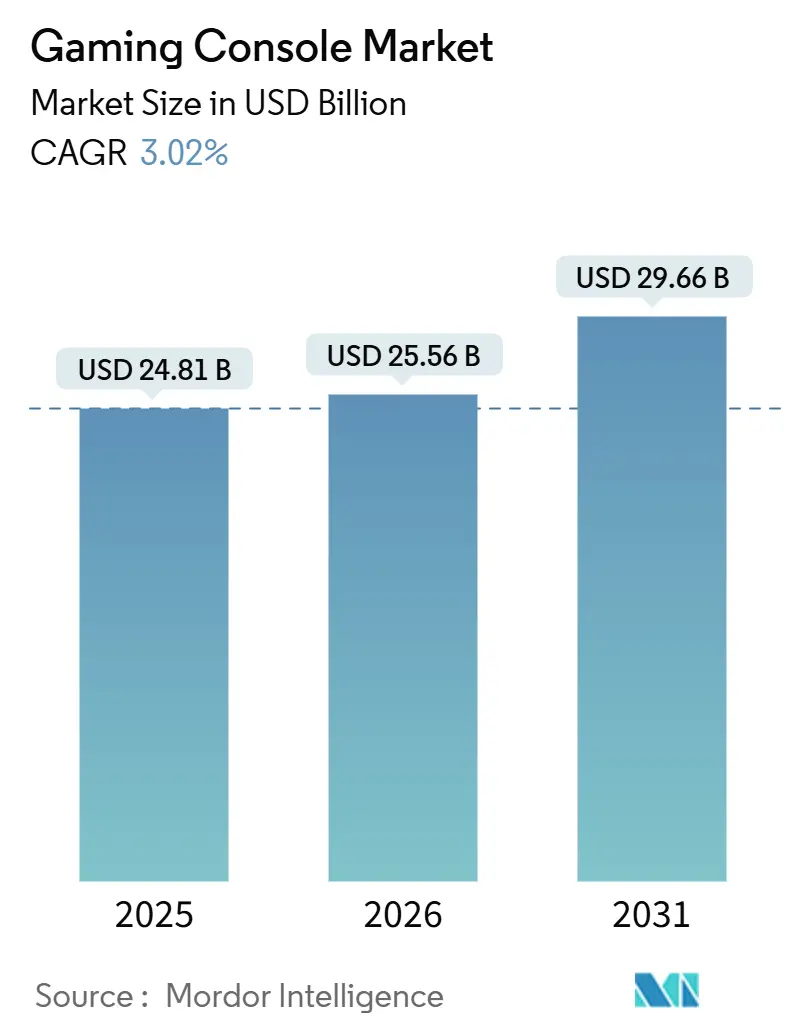
| Market Size (2026) | USD 25.56 Billion |
| Market Size (2031) | USD 29.66 Billion |
| Growth Rate (2026 - 2031) | 3.02% CAGR |
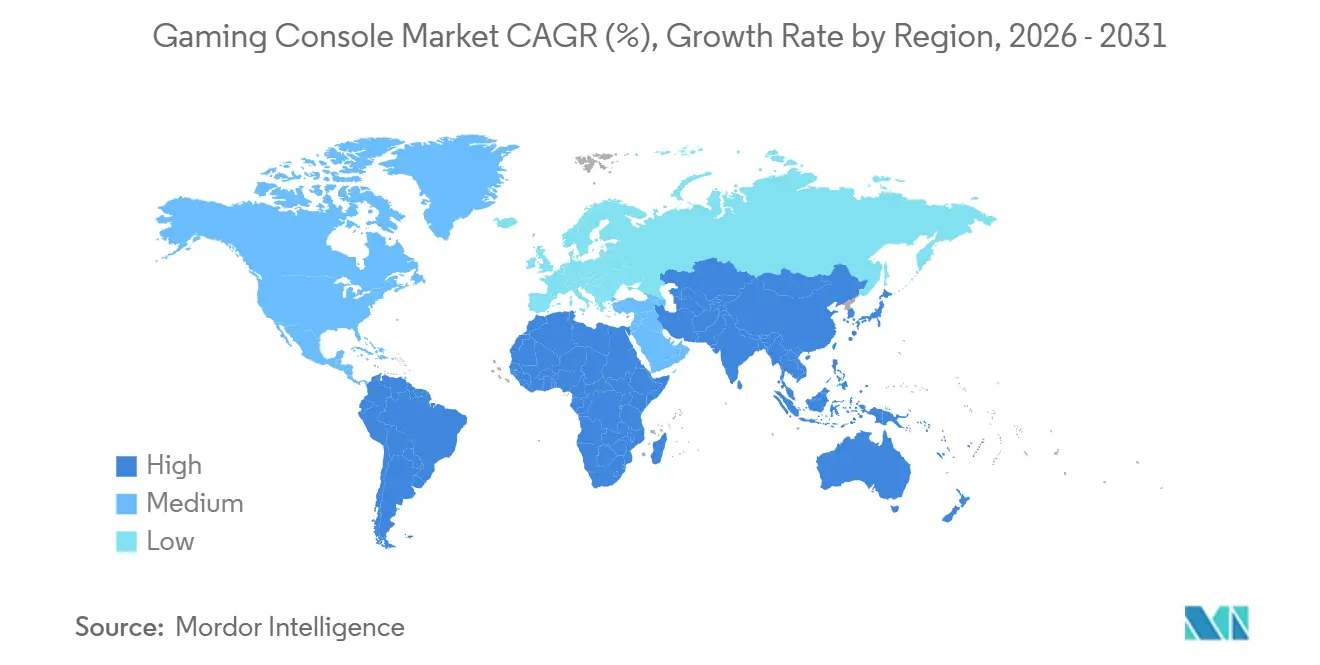
| Fastest Growing Market | Middle East |
| Largest Market | Asia Pacific |
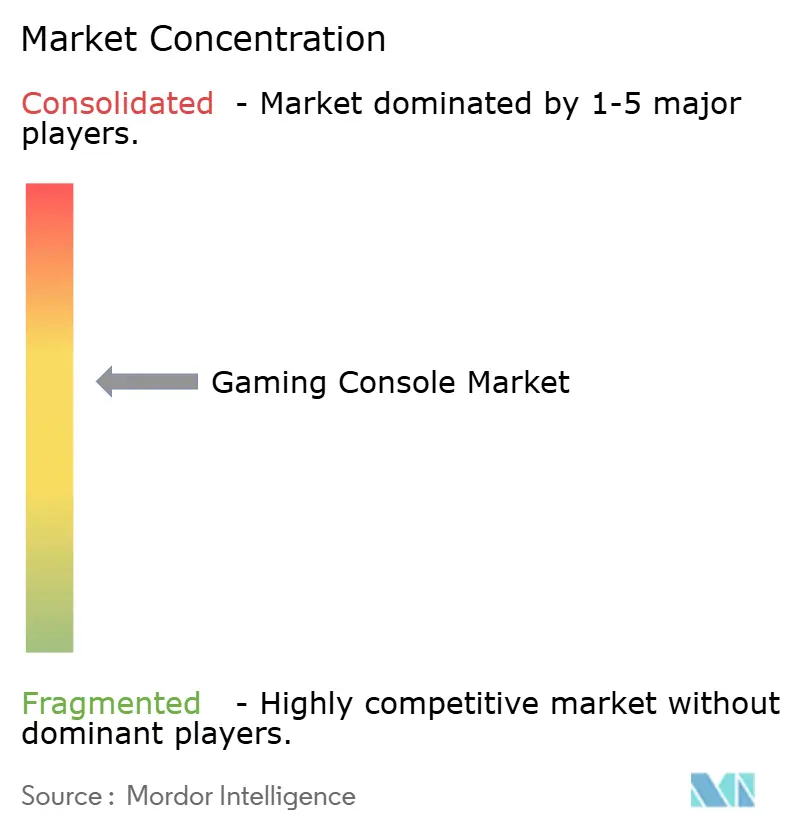
| Market Concentration | Medium |
Major Players *Disclaimer: Major Players sorted in no particular order Image © Mordor Intelligence. Reuse requires attribution under CC BY 4.0. | |
Gaming Console Market Analysis by Mordor Intelligence
The Gaming Console Market size is expected to grow from USD 24.81 billion in 2025 to USD 25.56 billion in 2026 and is forecast to reach USD 29.66 billion by 2031 at 3.02% CAGR over 2026-2031. The headline figure understates a structural pivot: hardware refresh cycles are compressing, subscription ecosystems are growing faster than device sales, and regional policy incentives are redrawing the cost map. On the demand side, premium-tier systems capture pricing power even as cloud-native and mobile competitors threaten mid-range consoles. Supply dynamics remain unpredictable because advanced 5 nm wafers are in short supply and memory prices climbed 30% in late 2024 with another 20% rise expected in early 2026. Despite the turbulence, 8K-ready devices and hybrid architectures help sustain value growth, and institutional purchases from esports programs add a new layer of buyer diversity.
Key Report Takeaways
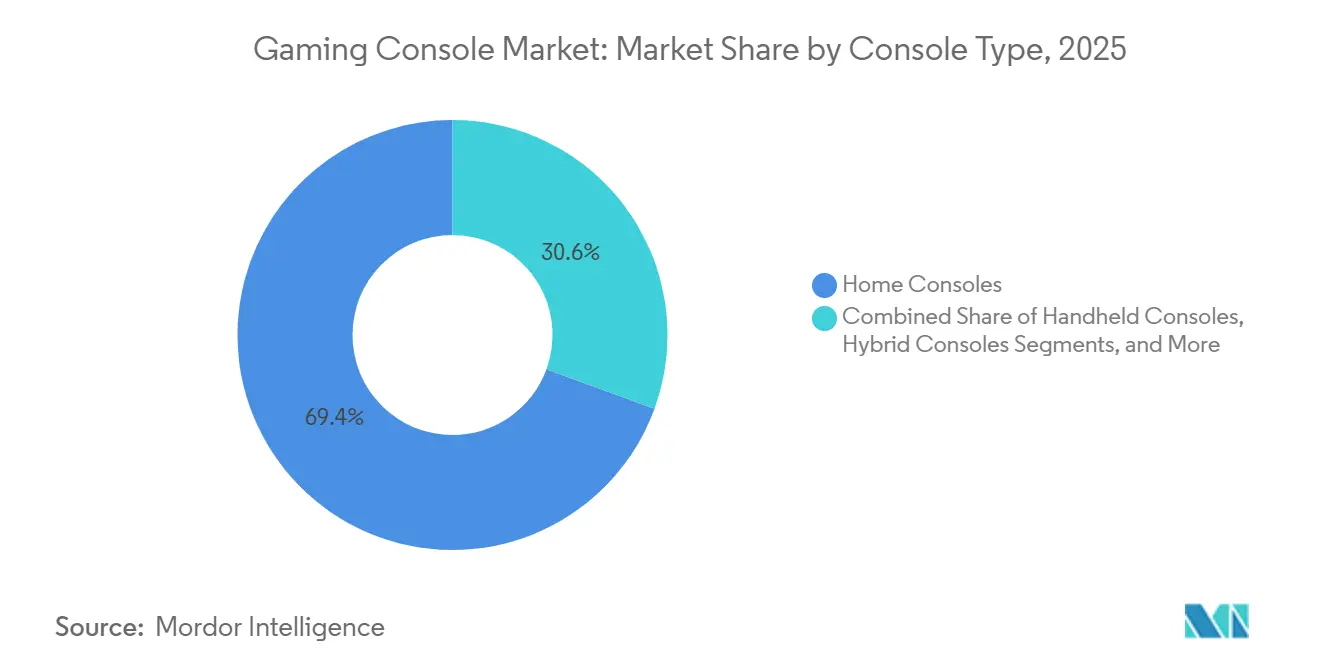
- By console type, home consoles led with 69.42% gaming console market share in 2025, while hybrid designs are on track for a 3.46% CAGR through 2031.
- By technology, 4K-capable systems captured 58.26% of the gaming console market size in 2025 yet 8K-ready models are expanding at a 4.56% CAGR to 2031.
- By processor architecture, x86 platforms held 84.18% share of the gaming console market size in 2025; custom system-on-chip designs record the fastest growth at 4.86% CAGR through 2031.
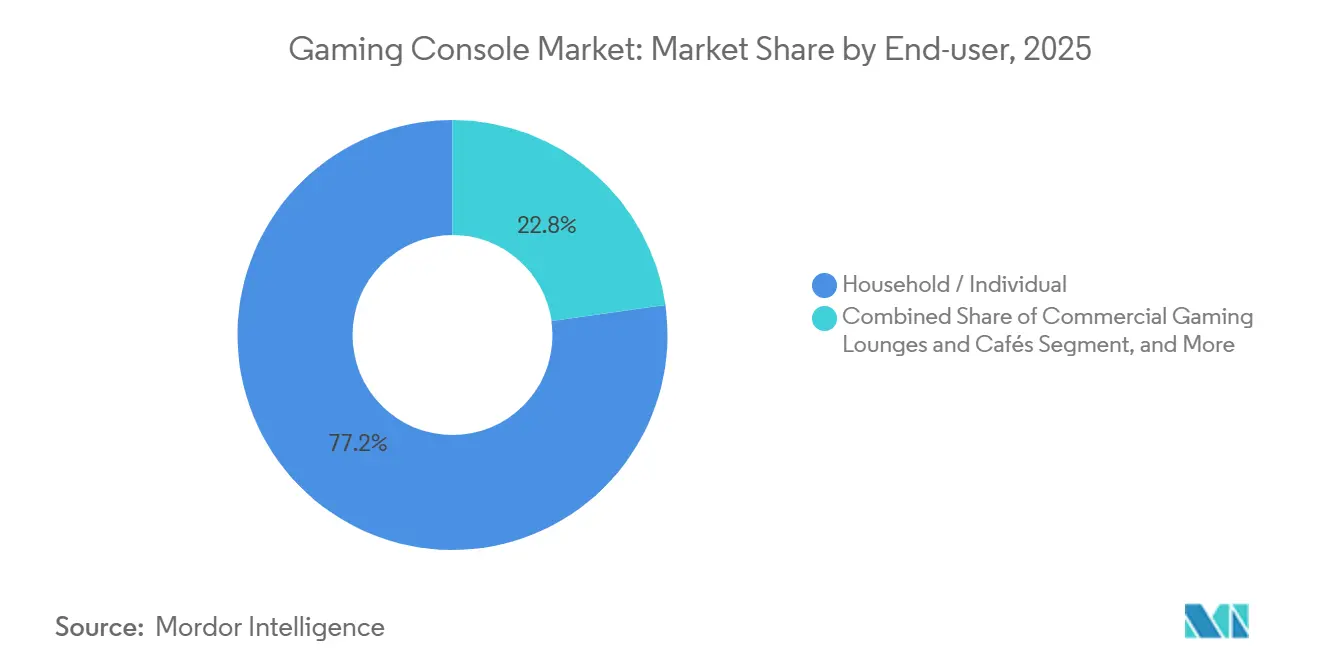
- By end-user, households accounted for 77.22% of 2025 demand, whereas institutional buyers are growing at 3.26% CAGR to 2031.
- By geography, North America retained 40.13% share in 2025, but the Middle East is advancing at a 4.96% CAGR as Saudi Arabia invests USD 38 billion in gaming facilities.
Note: Market size and forecast figures in this report are generated using Mordor Intelligence’s proprietary estimation framework, updated with the latest available data and insights as of January 2026.
Global Gaming Console Market Trends and Insights
Drivers Impact Analysis
| Driver | (~) % Impact on CAGR Forecast | Geographic Relevance | Impact Timeline |
|---|---|---|---|
| Launch of AAA-Grade Photorealistic Titles Driving Hardware Refresh Cycles | +0.6% | Global, notably North America, Europe, Japan | Medium term (2-4 years) |
| Proliferation of 8K UHD TVs in Asia Accelerating Premium-Console Demand | +0.5% | Asia Pacific core, especially China, Japan, South Korea | Medium term (2-4 years) |
| Esports Franchise Licensing Boosting Console Penetration in Emerging Markets | +0.4% | Middle East and North Africa, South America, Southeast Asia | Long term (≥ 4 years) |
| Rise in Subscription-Based Console Ecosystems | +0.7% | Global, led by North America and Europe | Short term (≤ 2 years) |
| Cloud-Agnostic Silicon Designs Lowering BOM Costs for Hybrid Consoles | +0.5% | Global, manufacturing hubs in Asia Pacific | Medium term (2-4 years) |
| Government Subsidies on Locally Assembled Consoles in Brazil and India | +0.3% | South America (Brazil) and Asia Pacific (India) | Long term (≥ 4 years) |
| Source: Mordor Intelligence | |||
Launch of AAA-Grade Photorealistic Titles Driving Hardware Refresh Cycles
Record-setting franchises are shortening replacement intervals because their technical demands exceed prior-generation capabilities. Grand Theft Auto VI is on track for 2025 release after its predecessor sold 205 million units and generated roughly USD 9 billion, proving that blockbuster IP can pull consumers into new hardware cycles.[1]Lewis Krauskopf, “GTA VI Trailer Smashes YouTube Record,” Reuters, reuters.com Sony’s USD 700 PlayStation 5 Pro, introduced in late 2024, illustrates how performance-driven players accept higher price points when marquee titles promise ray-traced 4K visuals. Microsoft, by contrast, counters with Game Pass subscriptions that already produce USD 5 billion in annual recurring revenue, demonstrating software’s capacity to offset shrinking hardware margins. Advances in Unreal Engine 5, notably Nanite and Lumen, raise baseline GPU requirements, compressing refresh cycles from seven to roughly five years. The net effect is a predictable cadence of hardware demand whenever new photorealistic IP reaches the market.
Rise in Subscription-Based Console Ecosystems
Subscription libraries recast consoles as high-engagement service nodes instead of one-off devices. Xbox Game Pass reached USD 5 billion in revenue by 2025, while PlayStation Plus added tiered plans that segment casual and power users. Nintendo prices its Switch Online service at USD 20 per year, emphasizing classic catalogs over day-one AAA drops. Attach rates matter more than raw unit numbers: a 50-million install base with 40% subscription penetration yields steadier cash flow than a larger base with weaker service adoption. Amazon’s October 2025 re-launch of Luna, bundled into Prime, signals that non-traditional players can exploit existing subscribers to bypass hardware requirements. Consequently, incumbents must compete on exclusive IP and differentiated online features to retain customers inside the gaming console market.
Esports Franchise Licensing Boosting Console Penetration in Emerging Markets
Esports leagues that license franchise slots normalize console hardware inside arenas and training centers. Saudi Arabia earmarked USD 38 billion to grow gaming and expects a USD 13.3 billion GDP lift by 2030. Formal recognition of esports athletes in France, Denmark, South Korea, and Japan unlocks visas and sponsorships that professionalize console play. Institutional buyers order consoles in bulk, valuing warranty length and standardized configurations over bleeding-edge specs. Brazil’s Zona Franca de Manaus continues to waive duties on electronics components, making locally assembled systems price-competitive for gaming cafés. The long-run impact is a diversified demand base that extends beyond the living room, lifting the gaming console market in emerging regions.
Proliferation of 8K UHD TVs in Asia Accelerating Premium-Console Demand
Shipments of 8K panels cluster in China, Japan, and South Korea, creating immediate pull-through for consoles capable of 4320p output. Sony’s PS5 Pro already supports 8K passthrough, positioning it as a living-room showcase even though true 8K content remains scarce.[2] Alexander George, “Sony PS5 Sales Down but Software Outlook Strong,” CNBC, cnbc.com Manufacturers use the 8K badge more for future-proofing than for current gameplay, yet the marketing appeal lifts average selling prices. GPU vendors align roadmaps with the display trend, embedding hardware scalers and HDMI 2.1 chipsets. Early adopters in Asia Pacific demonstrate willingness to pay premiums that help absorb rising component costs, supporting revenue growth inside the gaming console market despite modest volume gains.
Restraints Impact Analysis
| Restraint | (~) % Impact on CAGR Forecast | Geographic Relevance | Impact Timeline |
|---|---|---|---|
| Intensifying Substitution Threat from Cloud-Gaming-Only Sticks in North America | -0.4% | North America, with emerging adoption in Europe | Short term (≤ 2 years) |
| Rising Mobile Gaming Stickiness Among Gen-Z in Europe | -0.3% | Europe, with spillover to North America and Asia Pacific | Medium term (2-4 years) |
| Supply-Chain Volatility of Advanced 5 nm GPU Wafers | -0.5% | Global, concentrated impact on premium console tiers | Short term (≤ 2 years) |
| Persistent Scalper Bot Resales Hindering Retail Availability | -0.3% | Global, most acute in North America and Europe | Short term (≤ 2 years) |
| Source: Mordor Intelligence | |||
Intensifying Substitution Threat from Cloud-Gaming-Only Sticks in North America
Bandwidth-rich households can now experience mid-tier game fidelity via USD 50 dongles coupled with subscription libraries. Amazon Luna’s 2025 shift to a Prime-bundled model collapses the cost-of-entry and circumvents dedicated hardware. Microsoft’s cloud streaming upgrades to 4K server blades further narrow the experiential gap. Boston Consulting Group forecasts cloud gaming revenue rising from USD 1.4 billion in 2025 to USD 18.3 billion by 2030, a trajectory that far outpaces console hardware. Casual players who once bought USD 300-500 consoles now view streaming devices as good-enough alternatives, eroding unit demand inside the gaming console market.
Rising Mobile Gaming Stickiness Among Gen-Z in Europe
Gen-Z consumers split screen time among social media, video, and mobile games, leaving consoles with a smaller share of daily engagement. Video Games Europe valued console revenue at EUR 11.1 billion (USD 12.0 billion) in 2024 yet mobile penetration continues to rise. YouGov found that 46% of global gamers use mobile compared with 40% on consoles, a gap that widens among younger cohorts. Console makers respond with companion apps and cross-progression, but attention fragmentation pressures single-platform loyalty. With the gaming console market depending on high use intensity to justify USD 400-700 purchases, any decline in session frequency undermines replacement intent.
Segment Analysis
By Console Type: Hybrid Architectures Elevate Portable Premium
Hybrid systems already account for a rising share of the gaming console market as Nintendo targets 25 million Switch 2 units by March 2026. Home consoles still dominated revenue in 2025 but now rely on mid-cycle refreshes to unlock growth. Handheld-PC entrants, such as Valve’s Steam Deck, blur category lines and pull established PC libraries into the console space, further fragmenting buyer choices. Micro-consoles, though small in volume, illustrate how streaming sticks and lightweight Android boxes nibble at entry-level segments. Overall, hybrid devices help preserve margin because consumers value play-anywhere flexibility enough to pay USD 350-400, supporting value expansion even when shipment growth lags.
Demand dispersion favors brands that supply accessories and digital storefronts. For example, Switch OLED’s USD 50 premium over the base model shows that screen upgrades alone can lift average selling price. The gaming console market therefore tilts toward design innovation that justifies pricing rather than raw component horsepower. Looking forward, battery-efficient SoCs will strengthen the hybrid value proposition, narrowing perceived gaps between portable and living-room play.
Note: Segment shares of all individual segments available upon report purchase
By Technology: 8K-Ready Hardware Creates a Halo Effect
In 2025, 4K devices represented the majority of active units, yet 8K-capable consoles command headlines and higher shelf prices. Display economics in China, South Korea, and Japan reinforce this trend as panel makers push 8K adoption. The gaming console market size attached to 8K-ready systems is still modest, but the growth rate leads all technology tiers. Meanwhile, HD consoles sustain budget buyers in markets where 4K televisions remain sparse, but component price declines steadily siphon users upward.
Manufacturers leverage 8K branding for future-proof marketing even when real-world gameplay remains 4K. Hardware scalers and AI-based upscaling let brands promise next-generation clarity without waiting for native 8K content. Consequently, early-adopter demand reduces the elasticity of pricing, making high-end consoles a protective hedge against slower mid-tier growth.
By Processor Architecture: Custom SoCs Capture Vertical Margin
x86 still concentrates 84.18% of 2025 volume, anchored by AMD designs inside PlayStation and Xbox. Even so, custom ARM and RISC-based SoCs are the fastest-growing slice of the gaming console market. Nintendo’s Samsung-produced chip and Qualcomm’s Snapdragon G3x exemplify cost-efficient, battery-aware design strategies. An integrated approach reduces bill-of-materials, captures licensing margin, and lowers power draw.
Yet foundry shortages hamper smaller volume players. TSMC’s tight 5 nm capacity prioritizes AI accelerators, forcing console vendors to extend lead times. For incumbents with large guaranteed wafer orders, scarcity is manageable. For challengers, it jeopardizes launch windows, illustrating how supply chain constraints shape competitive hierarchy inside the gaming console market.
By End-User: Institutional Buyers Formalize Esports Infrastructure
Households still spent most of the gaming console market dollars in 2025, but institutional demand is structurally important. Esports arenas, university leagues, and gaming lounges often buy dozens of identical units and negotiate enterprise service terms. Saudi Arabia’s arena roll-out and government grants in India highlight policy-driven fleet purchases. Bulk orders stabilize quarterly revenue flows for manufacturers accustomed to consumer seasonality.
Schools integrate consoles into curricular offerings, prompting software publishers to develop age-appropriate content and teacher dashboards. Such institutional traction creates halo effects: students exposed to console titles at school lobby parents for the same hardware at home, reinforcing the installed base. Accordingly, platform holders tailor firmware to support multi-profile administration and warranty extensions, layering incremental value on top of existing ecosystems.
Note: Segment shares of all individual segments available upon report purchase
By Distribution Channel: Online Platforms Mitigate Scalping Risk
Online sellers captured nearly two-thirds of 2025 units as brands pivoted to direct-to-consumer storefronts. Automated allocation tools verify human purchasers, lowering but not eliminating scalper bot success rates. Walmart blocked 20 million bot pings during a single restock, illustrating the scale of the threat. Online platforms respond with waiting-room queues, purchase-history gating, and CAPTCHA layers.
Physical retail still matters in markets where cash-on-delivery dominates, yet square-foot economics and inventory risk discourage expansion. Pure-play e-commerce gains incremental advantage by bundling financing and subscription offers at checkout. Over time, persistent bot activity in brick-and-mortar channels may accelerate consumer migration to verified online queues, raising the digital share of the gaming console market even further.
Geography Analysis
North America, with 40.13% share in 2025, remains the largest regional slice of the gaming console market. The United States anchors premium demand, driven by widespread 4K television ownership and high broadband penetration. Yet Microsoft’s 29% drop in hardware revenue during fiscal 2024 signals shifting economics as cloud subscriptions absorb entertainment budgets. Canadian players benefit from integrated e-commerce logistics, while Mexican tariffs encourage parallel imports and local refurbishment businesses.
Europe contributes stable albeit slower growth. Console turnover reached EUR 11.1 billion (USD 12.0 billion) in 2024 and is projected to hit EUR 13.5 billion (USD 14.6 billion) by 2027. Germany and the United Kingdom lead spending, while regulatory fragmentation across 27 member states complicates uniform marketing strategies. Official recognition of esports athletes in several EU countries supports institutional console demand. Southern Europe, constrained by disposable income, favors prior-generation hardware traded on secondary markets.
Japan’s console heritage sustains premium uptake, South Korea’s broadband culture encourages digital-only SKUs, and China’s regulatory climate restricts foreign content. India’s Electronics Component Manufacturing Scheme allocated INR 22,919 crore (USD 2.76 billion) to support domestic electronics assembly, lowering landed costs for consoles.[3]Ministry of Electronics and Information Technology, “Electronics Component Manufacturing Scheme,” meity.gov.in The Middle East, led by Saudi Arabia, is the fastest-growing subregion at 4.96% CAGR. Massive public investment in gaming arenas and training facilities aims to deliver USD 13.3 billion to national GDP by 2030. Latin America’s growth centers on Brazil, where Manaus free-trade incentives encourage local builds, though macro volatility in Argentina tempers broader expansion. Africa remains small but urban clusters in South Africa and Nigeria present early adopter pockets, constrained by inconsistent power supply and limited broadband.
Competitive Landscape
The gaming console market features three titans: Sony, Microsoft, and Nintendo, yet competitive boundaries blur. Sony chases high-margin enthusiasts with the USD 700 PS5 Pro, while Microsoft prioritizes service revenue, evidenced by a USD 5 billion Game Pass stream that cushions a 29% hardware decline. Nintendo banks on hybrid appeal, targeting 25 million Switch 2 shipments by early 2026 through Samsung foundry diversification.
New entrants such as Valve and ASUS exploit open PC ecosystems in handheld formats, challenging proprietary storefronts. Qualcomm’s Snapdragon G3x provides silicon for OEMs aiming at 15-watt thermals, underscoring chipmakers’ direct influence on form-factor innovation. Amazon’s Luna bundles cloud gaming into Prime, threatening to commoditize mid-range hardware in bandwidth-rich markets.
Supply constraints color strategy. TSMC’s allocation pressures steer vendors toward dual-sourcing or larger prepaid wafer orders, options small challengers can scarcely afford. Escalating memory costs further squeeze margins, forcing aggressive price management or service bundling to defend profitability. Overall, scale advantages in R&D, exclusive IP, and logistics remain decisive, but the ceiling on device growth accelerates the pivot toward subscriptions and cloud ecosystems.
Gaming Console Industry Leaders
Sony Corporation
Microsoft Corporation
Nintendo Co. Ltd.
Sega Sammy Holdings Inc.
Valve Corporation
- *Disclaimer: Major Players sorted in no particular order
Recent Industry Developments
- October 2025: Amazon redesigned Luna, bundling cloud gaming with Prime memberships and introducing GameNight social features, effectively removing standalone subscription fees and lowering the entry barrier to a USD 50 controller and existing Fire TV hardware.
- September 2025: Microsoft announced that Xbox Cloud Gaming would upgrade to PC-based server blades capable of 4K streaming, targeting tiered pricing models that monetize performance without requiring console purchases.
- June 2025: Rockstar Games confirmed Grand Theft Auto VI would launch in fall 2025 for PlayStation 5 and Xbox Series X|S, with the franchise's predecessor having sold 205 million units and generated approximately USD 9 billion in revenue, establishing unprecedented demand expectations that are projected to drive console hardware purchases among lapsed gamers.
- March 2025: Saudi Arabia's Public Investment Fund allocated an additional USD 5 billion tranche of its USD 38 billion gaming commitment to construct 12 esports arenas across Riyadh, Jeddah, and Dammam, with each facility standardized for console-based competitive gaming and designed to host international tournaments.
Research Methodology Framework and Report Scope
Market Definitions and Key Coverage
According to Mordor Intelligence, we treat the global gaming console market as the yearly factory-gate value of newly manufactured home, handheld, and hybrid consoles that output a visual game signal to an external or integrated display; revenue is captured in USD before retail mark-ups. The model tracks units multiplied by average selling price and excludes second-hand trade and in-app or game software spend.
Scope exclusion: Peripherals, retro mini-arcade machines, cloud-only dongles, and subscription software fees are kept outside the core console valuation.
Segmentation Overview
- By Console Type
- Home Consoles
- Handheld Consoles
- Hybrid Consoles
- Other Console Types (Micro-Consoles / TV Boxes)
- By Technology
- HD (>1080 p) Consoles
- 4K-Capable Consoles
- 8K-Ready Consoles
- By Processor Architecture
- x86-Based Consoles
- ARM-Based Consoles
- Custom SoC-Based Consoles
- By End-User
- Household / Individual
- Commercial Gaming Lounges and Cafes
- Institutional (Esports Clubs, Schools)
- By Distribution Channel
- Online Retailers and Marketplaces
- Offline
- By Geography
- North America
- United States
- Canada
- Mexico
- Europe
- Germany
- United Kingdom
- France
- Nordics
- Rest of Europe
- Asia-Pacific
- China
- India
- Japan
- South Korea
- South-East Asia
- Rest of Asia-Pacific
- South America
- Brazil
- Argentina
- Rest of South America
- Middle East
- Saudi Arabia
- United Arab Emirates
- Turkey
- Rest of Middle East
- Africa
- South Africa
- Nigeria
- Rest of Africa
- North America
Detailed Research Methodology and Data Validation
Primary Research
Mordor analysts spoke with hardware product managers, semiconductor suppliers, regional distributors, and esports-venue owners across North America, Europe, and key Asia-Pacific hubs. Interviews and short buyer surveys helped us validate channel sell-through, replacement cycles, and price movements that were only partially visible in secondary sources.
Desk Research
Our analysts began with open statistics from bodies such as the US Consumer Technology Association, Japan's Ministry of Internal Affairs and Communications, Eurostat's PRODCOM electronics tables, UN Comtrade shipment records, and gamer-demographic studies published by ESA and UKIE. Trade press release scrapes, company 10-Ks, and investor decks added insight into launch roadmaps and regional channel inventory. Where brand-level financial splits were needed, data was verified through D&B Hoovers and news archives in Dow Jones Factiva. This list is indicative, not exhaustive; many additional public and paywalled references informed data checks and clarifications.
Market-Sizing & Forecasting
A top-down construct starts with production and trade data to rebuild the global shipment pool, which we align with household console penetration and average selling prices. Bottom-up spot checks, supplier roll-ups, sampled retailer ASP multiplied by volume, and lounge-level demand probes anchor the totals. Core drivers inside the model include: 1) yearly console launch cadence, 2) semiconductor wafer allocation per SKU, 3) gamer base growth in 4K TV households, 4) currency-adjusted ASP drift, and 5) import duty swings on electronics. A multivariate regression with ARIMAX terms projects each driver to 2030, and gap areas in bottom-up samples are bridged through weighted averages of credible ranges cross-confirmed by primary experts.
Data Validation & Update Cycle
Outputs pass variance tests against historical sales, install-base ratios, and shipment signals; anomalies trigger re-contact with sources before senior review signs off. Reports refresh annually, with interim tweaks if a material event, such as a mid-cycle console refresh, is observed.
Why Mordor's Gaming Console Baseline delivers confidence
Published market figures often diverge because studies pick dissimilar scopes, price bases, and refresh rhythms.
Key gap drivers include whether accessories and game software are bundled, if retail or factory values are used, and how quickly new exchange rates or launch events flow into models. Mordor's scope isolates hardware only, uses manufacturer value, and is updated every twelve months, which narrows volatility and keeps comparability intact.
Benchmark comparison
| Market Size | Anonymized source | Primary gap driver |
|---|---|---|
| USD 24.80 B | Mordor Intelligence | - |
| USD 28.28 B | Regional Consultancy A | Bundles controllers and headsets with consoles, inflating base value |
| USD 31.37 B | Trade Journal B | Applies retail prices and includes plug-and-play retro devices |
| USD 45.90 B | Global Tracker C | Counts console game software and subscription services alongside hardware |
Taken together, the comparison shows that wider scopes naturally lift totals, while our disciplined hardware-only lens, cross-checked with both supply and demand signals, offers decision-makers a balanced, transparent baseline they can replicate and trust.
Key Questions Answered in the Report
How large is the gaming console space in 2026 and what value is forecast for 2031?
It is valued at USD 25.56 billion in 2026 and is projected to reach USD 29.66 billion by 2031.
What compound annual growth rate is expected for the sector during 2026-2031?
A CAGR of 3.02% is forecast for the period.
Which geography is recording the fastest increase in console sales?
The Middle East leads with a 4.96% CAGR, buoyed by Saudi Arabia’s large-scale gaming investments.
Which console form factor is growing most quickly?
Hybrid portable-dockable systems are rising at a 3.46% CAGR, outpacing home and handheld categories.
How are subscriptions reshaping revenue models?
Services such as Xbox Game Pass and PlayStation Plus generate predictable cash flow that offsets flatter hardware margins.
Which companies command the majority of global console shipments?
Sony, Microsoft, and Nintendo together control close to 60% of annual unit sales.


