Fusion Bonded Epoxy Coatings Market Size and Share
Market Overview
| Study Period | 2020 - 2031 |
|---|---|
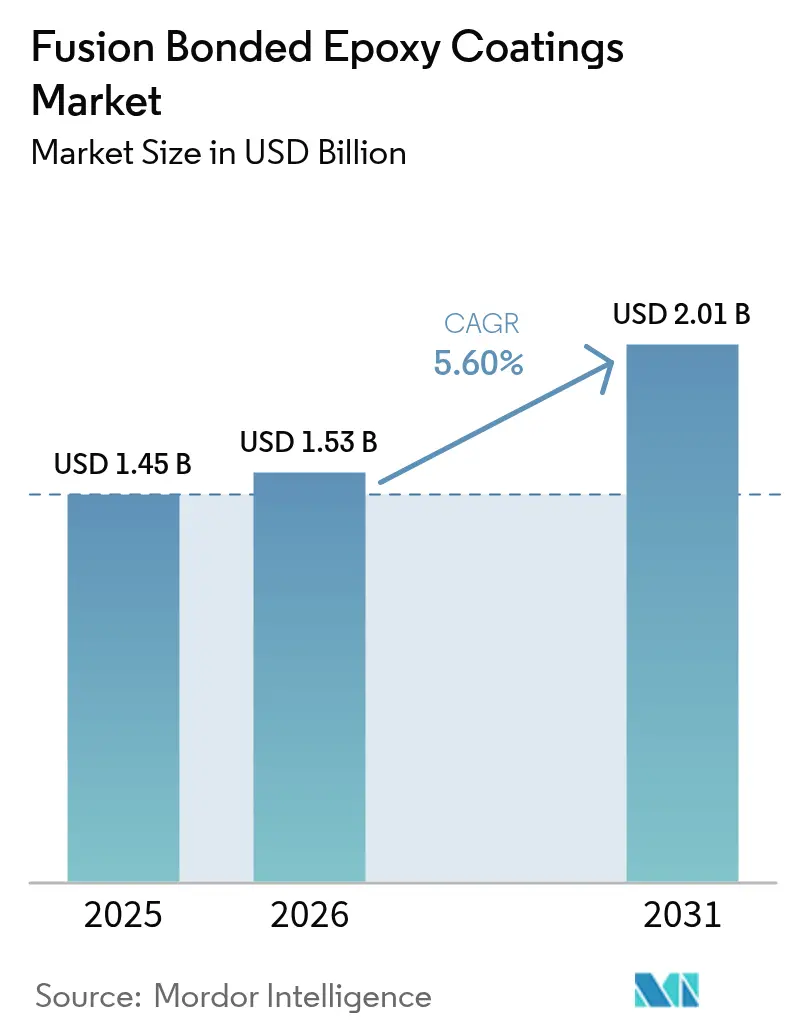
| Market Size (2026) | USD 1.53 Billion |
| Market Size (2031) | USD 2.01 Billion |
| Growth Rate (2026 - 2031) | 5.60% CAGR |
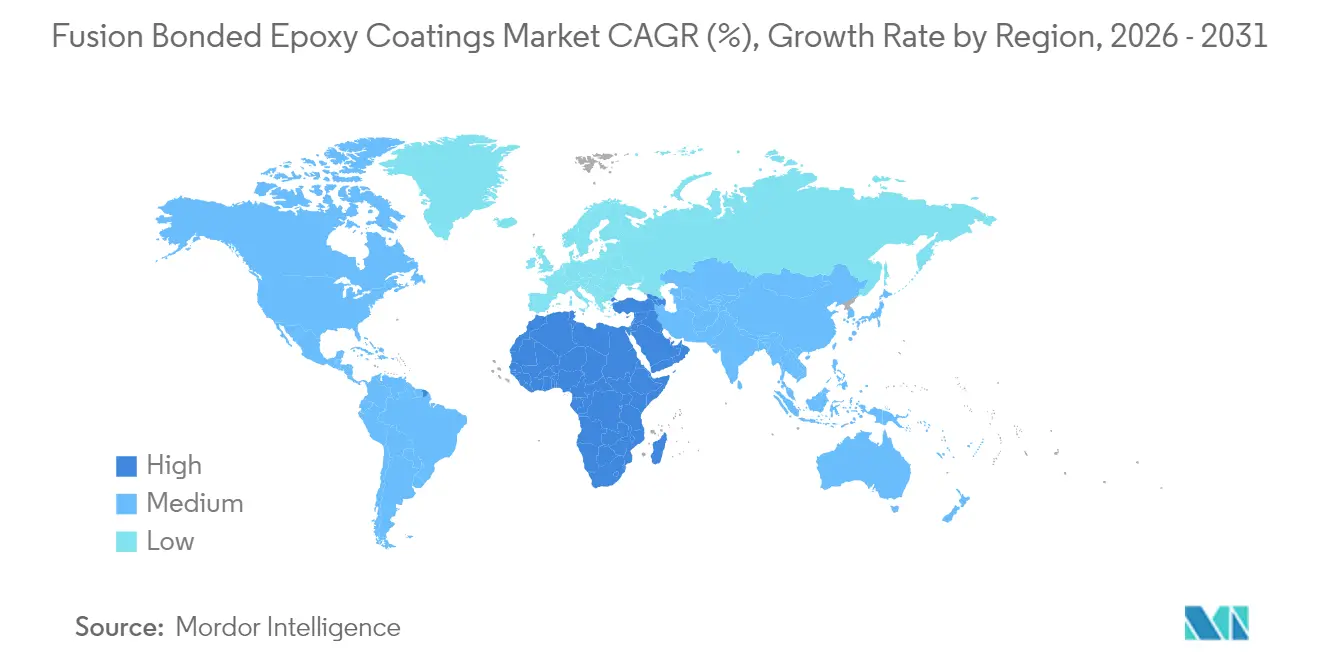
| Fastest Growing Market | Middle East and Africa |
| Largest Market | Asia Pacific |
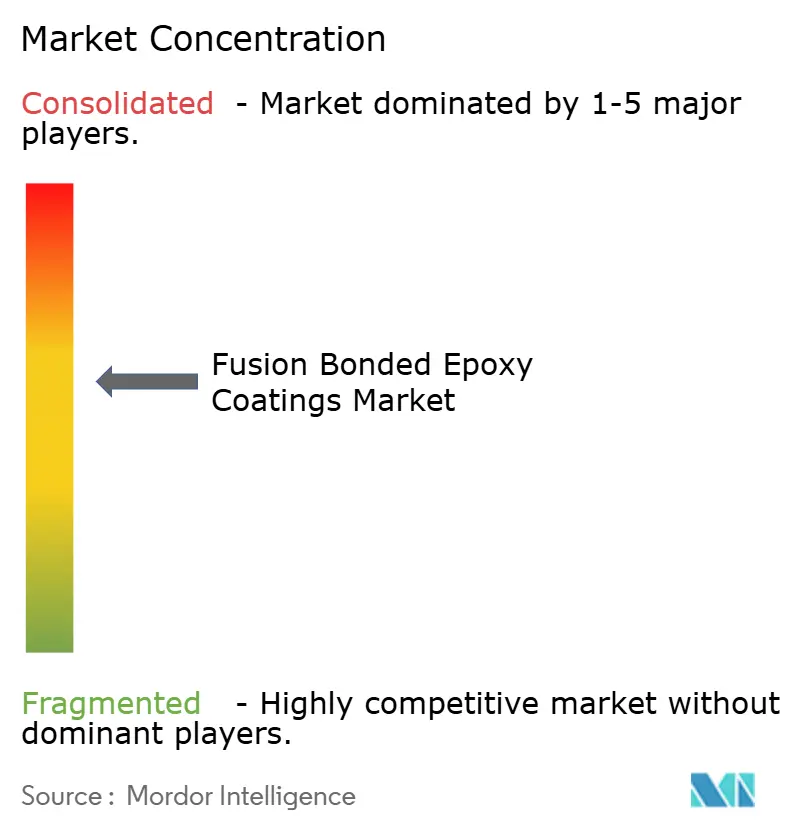
| Market Concentration | Medium |
Major Players *Disclaimer: Major Players sorted in no particular order Image © Mordor Intelligence. Reuse requires attribution under CC BY 4.0. | |
Fusion Bonded Epoxy Coatings Market Analysis by Mordor Intelligence
The Fusion Bonded Epoxy Coatings Market size is expected to grow from USD 1.45 billion in 2025 to USD 1.53 billion in 2026 and is forecast to reach USD 2.01 billion by 2031 at 5.60% CAGR over 2026-2031. Demand centers on pipeline corrosion protection, with large-scale oil, gas and water infrastructure projects in the Middle East, Asia and North America anchoring near-term volume. Saudi Aramco’s 4,000-kilometer Jafurah build-out, India’s 9,630-mile national gas grid and the United States’ lead service-line replacement initiative exemplify multi-year pipelines that lock in fusion-bonded epoxy powder offtake. Margins, however, are compressed by epoxy-resin price spikes and sustained competition from three-layer polyethylene (3-LPE) and polyurethane systems. Growth opportunities are shifting toward hydrogen-ready retrofits, potable-water mandates and sensor-embedded smart coatings that extend inspection intervals.
Key Report Takeaways
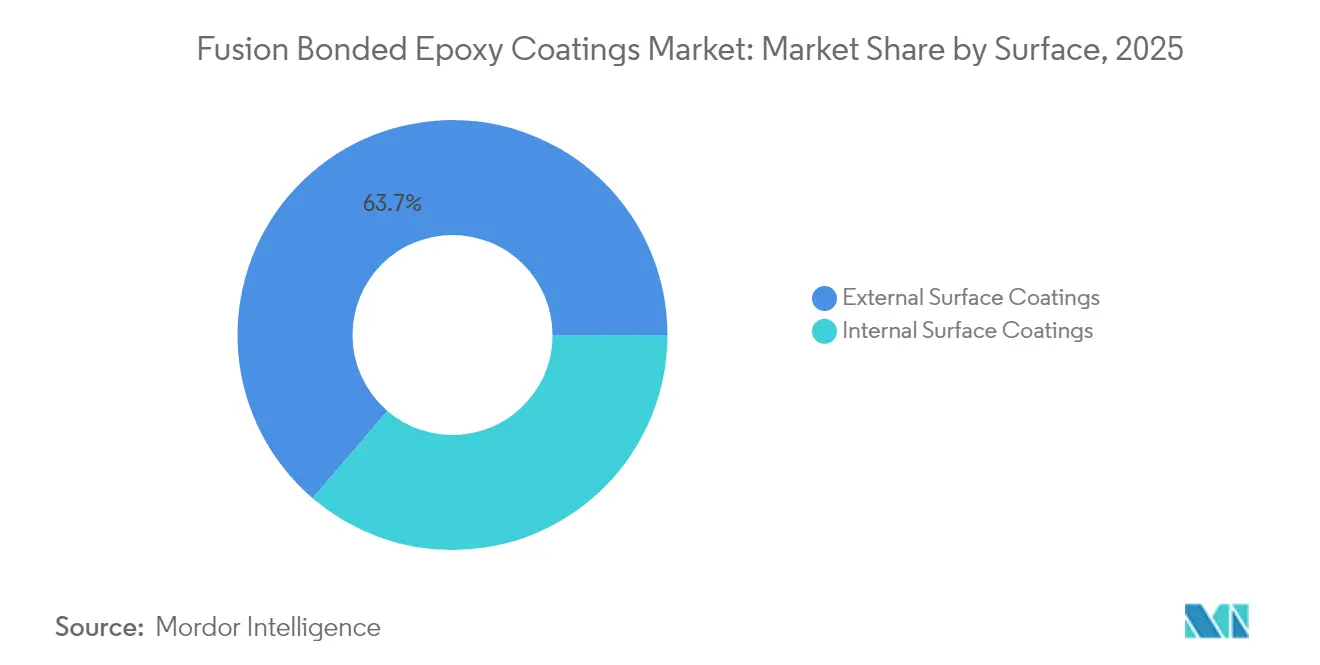
- By surface, external surface coatings led with 63.72% of the fusion-bonded epoxy coatings market share in 2025, while internal surface coatings are poised to advance at a 5.74% CAGR through 2031.
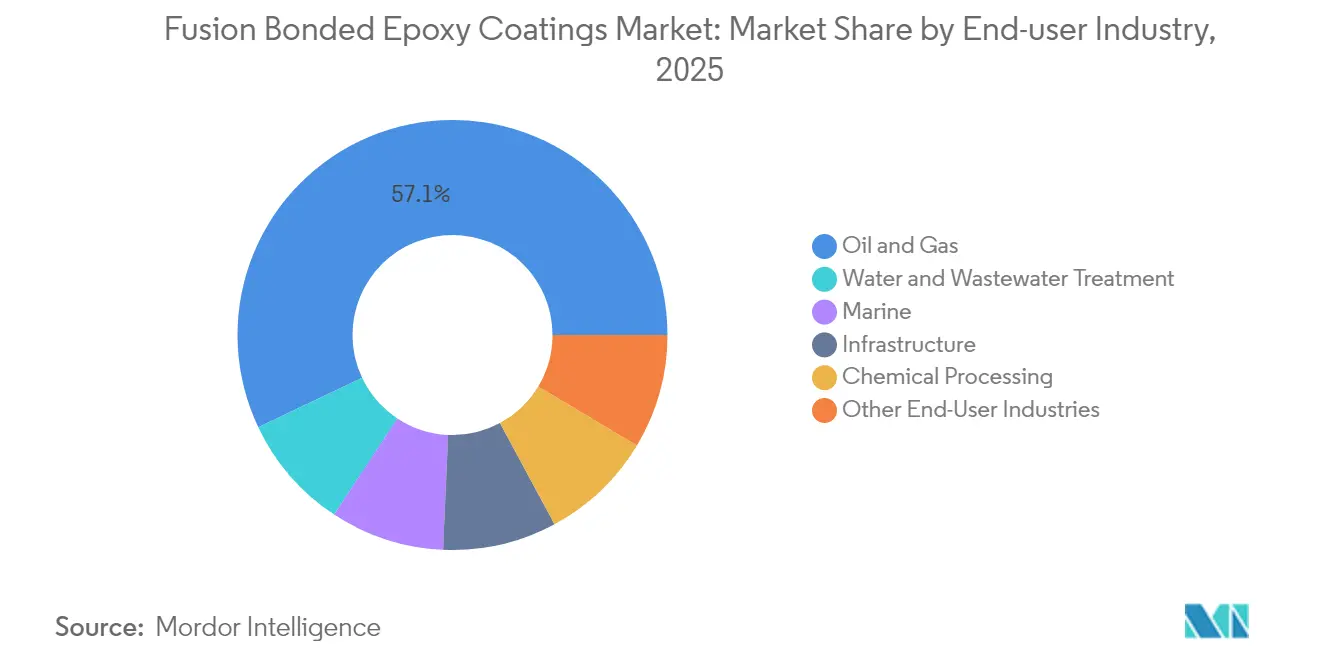
- By end-user industry, the oil and gas sector accounted for 57.05% of the fusion-bonded epoxy coatings market size in 2025; water and wastewater treatment is the fastest-growing end-user, expanding at a 5.98% CAGR to 2031.
- By geography, Asia-Pacific captured 45.86% revenue in 2025 and remains the largest regional contributor; the Middle East and Africa are the fastest-growing regions, set to climb at a 6.03% CAGR through 2031.
Note: Market size and forecast figures in this report are generated using Mordor Intelligence’s proprietary estimation framework, updated with the latest available data and insights as of 2026.
Global Fusion Bonded Epoxy Coatings Market Trends and Insights
Drivers Impact Analysis*
| Driver | (~) % Impact on CAGR Forecast | Geographic Relevance | Impact Timeline |
|---|---|---|---|
| Accelerating oil and gas pipeline expansions | +1.3% | Middle East, North America, Asia-Pacific | Medium term (2-4 years) |
| Rapid urban-water and wastewater projects | +1.5% | North America, Europe, India | Short term (≤ 2 years) |
| Infrastructure stimulus in India and Southeast Asia | +1.2% | India, ASEAN | Medium term (2-4 years) |
| Hydrogen-ready pipeline retrofits | +0.8% | Europe, Middle East, Japan, South Korea | Long term (≥ 4 years) |
| Smart FBE coatings with embedded sensors | +0.6% | North America, Europe, Middle East pilots | Long term (≥ 4 years) |
| Source: Mordor Intelligence | |||
Accelerating Oil and Gas Pipeline Expansions
Newbuild hydrocarbon corridors dominate large-diameter demand. Saudi Aramco committed USD 12.5 billion to Jafurah gas-field infrastructure in January 2024, requiring dual-layer coatings rated to 120°C for sour-gas service. In North America, 36-inch crude pipelines leaving the Permian Basin are specified to have 400-600 microns of external fusion-bonded epoxy to meet API RP 5L3. India’s Paradip–Hyderabad–Vijaypur–Bengaluru line stipulates fusion-bonded epoxy across 2,600 kilometers of monsoon-prone terrain. Film builds are thickening to 800 microns in high-consequence areas, effectively doubling resin consumption per meter. These projects underpin near-term revenue despite global drilling volatility.
Rapid Urban-Water and Wastewater Projects
Municipal replacement cycles are converging with health mandates. The U.S. Environmental Protection Agency’s USD 50 billion Bipartisan Infrastructure Law budget earmarks lead pipe replacement and wastewater upgrades, both requiring NSF/ANSI 61-certified internal fusion-bonded epoxy coatings[1]Environmental Protection Agency, “Bipartisan Infrastructure Law Investments,” EPA, epa.gov . Ofwat’s GBP 104 billion (USD 131 billion) United Kingdom water program covers 12,000 kilometers of trunk mains, with fusion-bonded epoxy chosen over cement mortar for high-velocity abrasion resistance. Utilities now apply oil-and-gas-grade specifications—AWWA C213 is converging with ISO 21809-1—justifying a 15–20% coating premium for a 1% reduction in leakage.
Infrastructure Stimulus in India and Southeast Asia
South Asia’s USD 1.4 trillion National Infrastructure Pipeline includes USD 67 billion for new gas lines such as the North Eastern Gas Grid. ASEAN’s Trans-ASEAN Gas Pipeline Phase 3 adds offshore and swamp crossings where cathodic protection is impractical. Pertamina’s 1,200-kilometer refined-product network chose fusion-bonded epoxy over polyethylene to combat tropical soil bacteria. Domestic Indian applicators compress lead times to 15 days, putting pressure on multinational margins.
Hydrogen-Ready Pipeline Retrofits
The transition to hydrogen as an energy carrier is driving the need to reassess pipeline coating systems due to risks like hydrogen embrittlement and permeation. The International Energy Agency's Global Hydrogen Review 2024 highlights that repurposing natural gas pipelines for hydrogen blends above 20% requires specialized internal coatings. Germany's 9,700-kilometer hydrogen core network, slated for completion by 2032, utilizes modified FBE formulations to minimize hydrogen uptake. The India-Middle East-Europe Economic Corridor, announced in 2024, includes hydrogen pipelines linking Saudi Arabia's NEOM green hydrogen hub to Europe, requiring coatings tested under ISO 15156 conditions. Japan is piloting hydrogen blending in city gas networks, with FBE coatings undergoing permeation testing at a pressure of 10 MPa. Hydrogen's smaller molecular size enables it to diffuse through polymer matrices, prompting early adopters to layer FBE with aluminum barrier films. This hybrid approach increases costs by 30-40% but extends inspection intervals from 5 to 15 years.
Restraints Impact Analysis*
| Restraint | (~) % Impact on CAGR Forecast | Geographic Relevance | Impact Timeline |
|---|---|---|---|
| Competition from 3-LPE and polyurethane coatings | -0.9% | North America, Europe, global subsea | Short term (≤ 2 years) |
| Volatile epoxy-resin input costs | -0.7% | Global, higher in Asia-Pacific | Medium term (2-4 years) |
| Capital-intensive powder-coating plants | -0.5% | India, Southeast Asia, Middle East | Long term (≥ 4 years) |
| Source: Mordor Intelligence | |||
Competition from 3-LPE and Polyurethane Coatings
Three-layer polyethylene systems outperform single-layer fusion-bonded epoxy in high-temperature offshore projects, delivering 40% lower cathodic disbondment in Gulf of Mexico trials[2]International Association of Oil & Gas Producers, “Coating Performance in Offshore Pipelines 2024,” IOGP, iogp.org. Polyurethane’s 300% elongation is suitable for pipelines in seismic zones. Price gaps narrowed to USD 8–12 per meter, prompting operators to absorb premiums to avoid mid-life recoating.
Volatile Epoxy-Resin Input Costs
Bisphenol-A-based resin prices rose 15–20% after China opened an anti-dumping probe against Korean and Taiwanese suppliers in August 2024. Fixed-price pipeline contracts squeezed applicator margins; Shawcor’s Composite Systems segment margin slipped to 12.3% in Q3 2024 despite revenue gains. Bio-based resins under development promise stability but require new ASTM D3963 benchmarks.
*Our forecasts treat driver/restraint impacts as directional, not additive. The impact forecasts reflect baseline growth, mix effects, and variable interactions.
Segment Analysis
By Surface: External Coatings Anchor Revenue, Internal Segment Gains Traction
External surface coatings captured 63.72% of the fusion-bonded epoxy coatings market share in 2025, driven by pipeline designers specifying 600-micron films for buried and subsea lines. Saudi Aramco’s Master Gas System expansion alone demands 400,000 tons of powder between 2024 and 2028, reinforcing the segment’s scale. Internal coatings, although smaller, are growing at a 5.74% CAGR. Hydrogen blending above 20% and US lead-service replacements mandate NSF/ANSI 61-certified fusion-bonded epoxy that resists hydrogen permeation.
Premium pricing for internal systems averages 25% above that of external programs due to migration testing and potable-water certifications. Offshore wind monopiles now specify internal fusion-bonded epoxy to combat seawater condensation, contributing to AkzoNobel’s 7% coatings growth in Q3 2024. Dual-layer internal builds extend the life of transition pieces to 35 years, lowering total ownership costs.


By End-User Industry: Oil and Gas Dominates, Water Treatment Accelerates
Oil and gas accounted for 57.05% of the fusion-bonded epoxy coatings market size in 2025, as unconventional gas and export corridors required 120 °C dual-layer systems. The India–Middle East–Europe Economic Corridor and the Fujairah bypass pipeline are expected to expand demand through 2031. Water and wastewater outpace at a 5.98% CAGR, propelled by Ofwat’s GBP 104 billion trunk-main overhaul.
Marine and subsea applications face substitution by 3-LPE yet retain niches in deep-water acid-gas lifts. Chemical processing and district heating remain smaller, steady outlets where the chemical resistance of fusion-bonded epoxy offsets the higher up-front cost.
Geography Analysis
Asia-Pacific accounted for 45.86% of revenue in 2025. India’s USD 67 billion gas grid and China’s pending West-East Phase 4 provide multi-year certainty. Domestic Indian applicators cut lead times to 15 days but still trail multinational quality benchmarks. Japan and South Korea focus on rehabilitation, leveraging the cathodic-protection compatibility of the fusion-bonded epoxy.
The Middle East and Africa register the fastest expansion at a 6.03% CAGR. Jafurah’s sour-gas network, ADNOC’s Fujairah crude line, and the 300-kilometer Ras Mohaisen water pipeline collectively exceed USD 500 million in coating value. Hydrogen corridors linking NEOM to Europe will demand ISO 15156-tested formulations.
North America and Europe exhibit replacement dynamics. The US EPA’s USD 50 billion water program funnels internal fusion-bonded epoxy into lead-service replacements. Europe’s 9,700-kilometer hydrogen grid promises long-term demand once embrittlement protocols are finalized. South America remains lumpy; Petrobras' capital discipline and Argentina’s pipeline deficits delay large-scale awards.

Competitive Landscape
The Fusion Bonded Epoxy Coatings market is moderately consolidated. Shawcor’s CAD 224.5 million Composite Systems revenue in Q3 2024 underscores the value of integrated pipe-coating hubs adjacent to mills. AkzoNobel’s protective coatings franchise leverages offshore wind synergies for 30% price premiums. PPG cross-sells fusion-bonded epoxy into petrochemical revamps, though margins remain undisclosed. Sensor-enabled smart coatings, bio-based resins, and modular applicators are white-space arenas. University-validated surface-acoustic-wave sensors lack commercial rollout, while BASF’s 2024 backward integration into epoxy precursors signals cost hedging for large players. Indian fabricators erode price points but still face gaps in adhesion quality, thereby preserving their incumbent share in high-spec projects.
Fusion Bonded Epoxy Coatings Industry Leaders
3M
The Sherwin-Williams Company,
Akzo Nobel N.V.
Tenaris
PPG Industries, Inc.
- *Disclaimer: Major Players sorted in no particular order

Recent Industry Developments
- May 2025: The Association for Materials Protection and Performance (AMPP) launched a new Fusion Bonded Epoxy (FBE): Application and Inspection course to meet growing industry demand for qualified professionals. This course addresses a critical training gap. This initiative can propel the global market for fusion-bonded epoxy coatings.
- April 2024: Sherwin-Williams Protective & Marine unveiled its latest innovation, Sher-Bar TEC, a textured epoxy coating (TEC) specifically designed for the concrete sector. This product boasts enhanced bond strength, superior damage tolerance, and heightened corrosion resistance, making it ideal for both horizontal and vertical concrete endeavors.


Global Fusion Bonded Epoxy Coatings Market Report Scope
The fusion-bonded epoxy coatings market report includes:
| Internal Surface Coatings |
| External Surface Coatings |
| Oil and Gas |
| Marine |
| Water and Wastewater Treatment |
| Chemical Processing |
| Infrastructure |
| Other End-User Industries |
| Asia-Pacific | China |
| India | |
| Japan | |
| South Korea | |
| ASEAN Countries | |
| Rest of Asia-Pacific | |
| North America | United States |
| Canada | |
| Mexico | |
| Europe | Germany |
| United Kingdom | |
| Italy | |
| France | |
| Spain | |
| Russia | |
| NORDIC Countries | |
| Rest of Europe | |
| South America | Brazil |
| Argentina | |
| Rest of South America | |
| Middle-East and Africa | Saudi Arabia |
| United Arab Emirates | |
| South Africa | |
| Rest of Middle-East and Africa |
| By Surface | Internal Surface Coatings | |
| External Surface Coatings | ||
| By End-User Industry | Oil and Gas | |
| Marine | ||
| Water and Wastewater Treatment | ||
| Chemical Processing | ||
| Infrastructure | ||
| Other End-User Industries | ||
| By Geography | Asia-Pacific | China |
| India | ||
| Japan | ||
| South Korea | ||
| ASEAN Countries | ||
| Rest of Asia-Pacific | ||
| North America | United States | |
| Canada | ||
| Mexico | ||
| Europe | Germany | |
| United Kingdom | ||
| Italy | ||
| France | ||
| Spain | ||
| Russia | ||
| NORDIC Countries | ||
| Rest of Europe | ||
| South America | Brazil | |
| Argentina | ||
| Rest of South America | ||
| Middle-East and Africa | Saudi Arabia | |
| United Arab Emirates | ||
| South Africa | ||
| Rest of Middle-East and Africa | ||


Key Questions Answered in the Report
How big is the fusion-bonded epoxy coatings market in 2026?
The fusion-bonded epoxy coatings market size is USD 1.53 billion in 2026.
What is the expected growth rate for fusion-bonded epoxy coatings through 2031?
The market is forecast to expand at a 5.60% CAGR to reach USD 2.01 billion by 2031 over 2026-2031.
Which region generates the most revenue for fusion-bonded epoxy coatings?
Asia-Pacific leads, accounting for 45.86% of 2025 revenue due to extensive gas-pipeline expansion.
Which application segment grows the fastest?
Internal pipeline coatings are set to grow at 5.74% annually through 2031, driven by hydrogen blends and potable-water mandates.
Why are resin costs a concern for fusion-bonded epoxy producers?
Epoxy resins form over half of coating costs, and recent anti-dumping actions in China raised prices 15–20%, squeezing applicator margins.
Page last updated on:


