
Epoxy Coatings Market Size and Share
Market Overview
| Study Period | 2021 - 2031 |
|---|---|
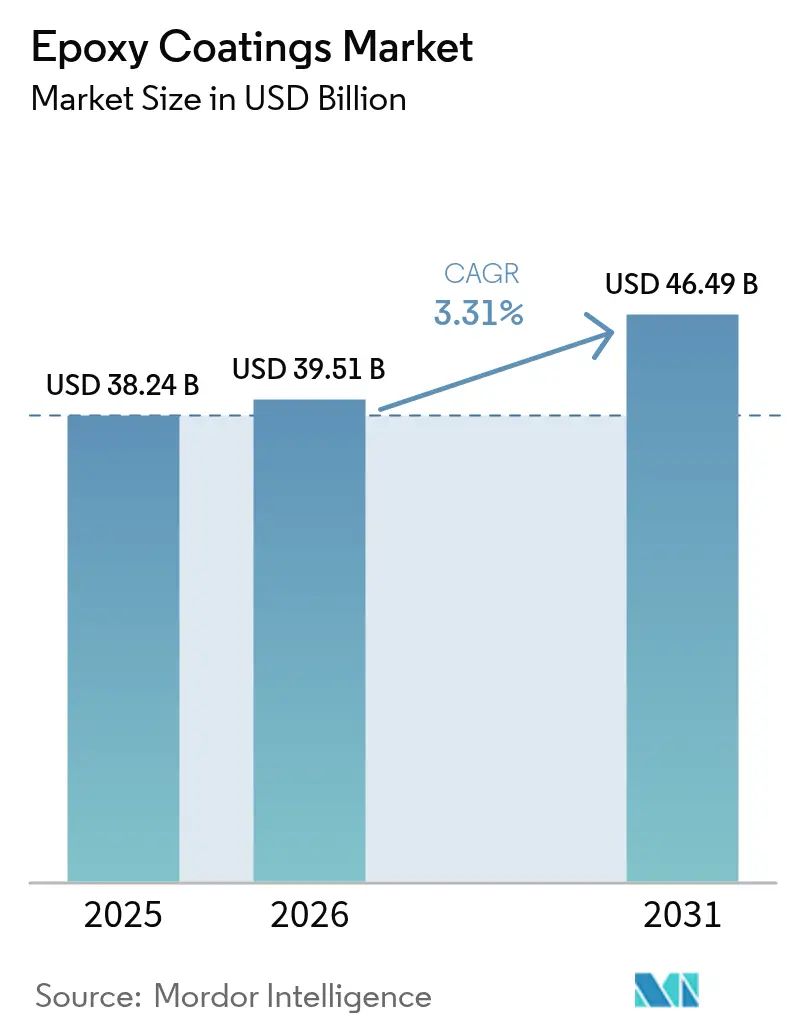
| Market Size (2026) | USD 39.51 Billion |
| Market Size (2031) | USD 46.49 Billion |
| Growth Rate (2026 - 2031) | 3.31 % |
| Fastest Growing Market | Asia Pacific |
| Largest Market | Asia Pacific |
| Market Concentration | Medium |
Major Players *Disclaimer: Major Players sorted in no particular order Image © Mordor Intelligence. Reuse requires attribution under CC BY 4.0. | |
Epoxy Coatings Market Analysis by Mordor Intelligence
The Epoxy Coatings Market size is expected to grow from USD 38.24 billion in 2025 to USD 39.51 billion in 2026 and is forecast to reach USD 46.49 billion by 2031 at 3.31% CAGR over 2026-2031. Demand is shifting toward low-VOC products as water-based systems already command 41.81% of 2025 technology revenue and are expanding at 4.38% CAGR because REACH Annex XVII caps solvent content in protective finishes. Asia-Pacific remains the primary growth engine due to India’s USD 1.3 trillion National Infrastructure Pipeline and ASEAN’s sizeable infrastructure gap that governments aim to close by 2030. Industrial retrofits in food and beverage plants, spurred by updated USDA sanitation standards, are pulling through higher-margin floor coatings. Automotive OEMs are installing UV and LED-curable epoxy lines that cut energy use by 70%, which is helping producers protect margins despite raw-material cost swings.
Key Report Takeaways
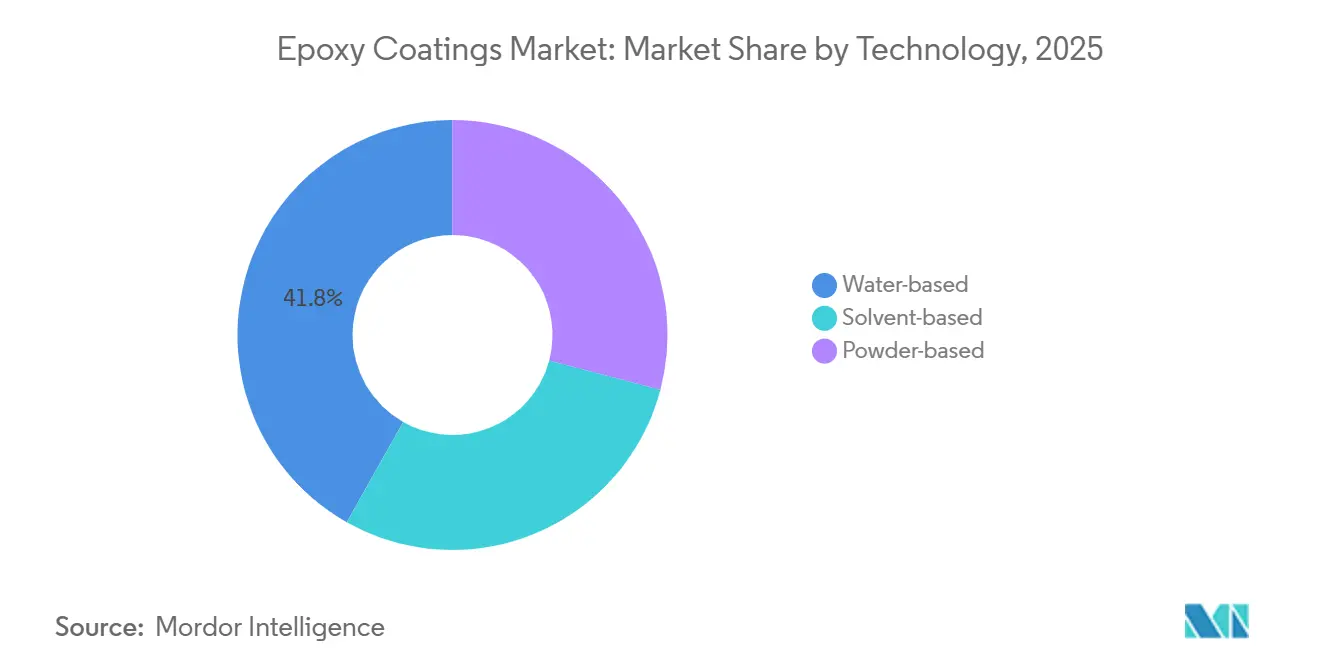
- By technology, water-based systems led with 41.81% of 2025 revenue and expanding at a 4.38% CAGR to 203.
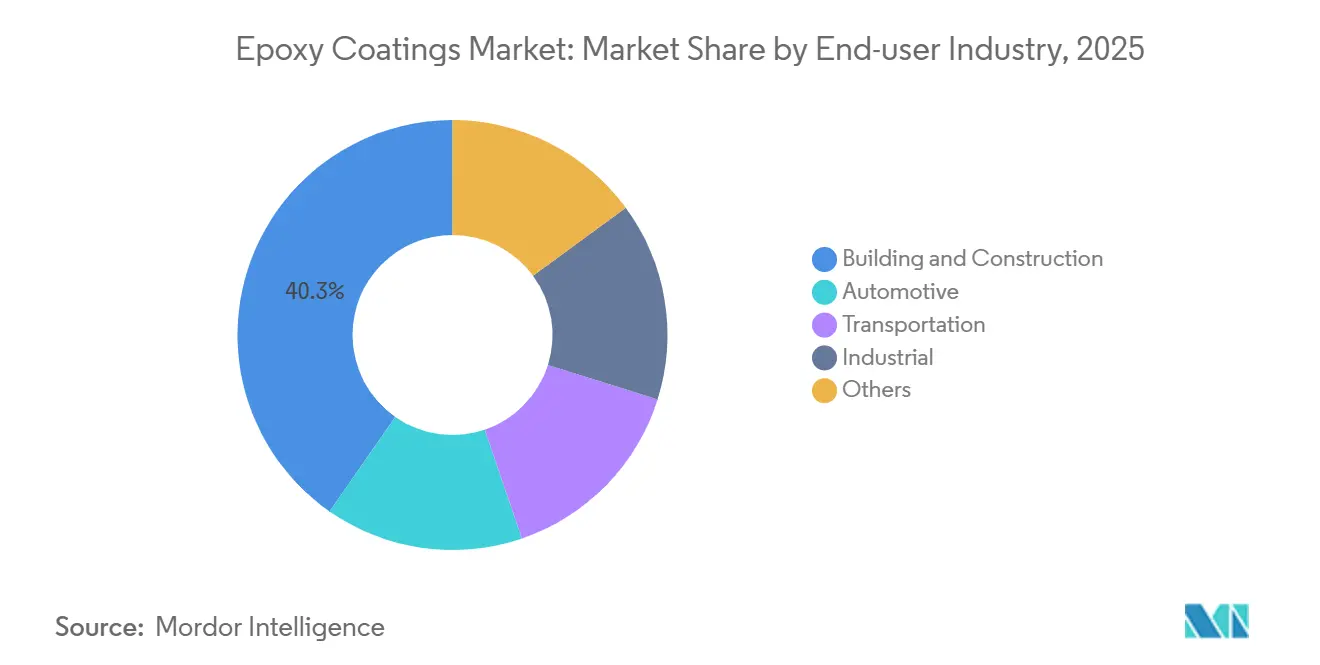
- By end-user, building and construction held 40.31% epoxy coatings market share in 2025; industrial applications are the fastest expanding segment at 3.61% CAGR through 2031.
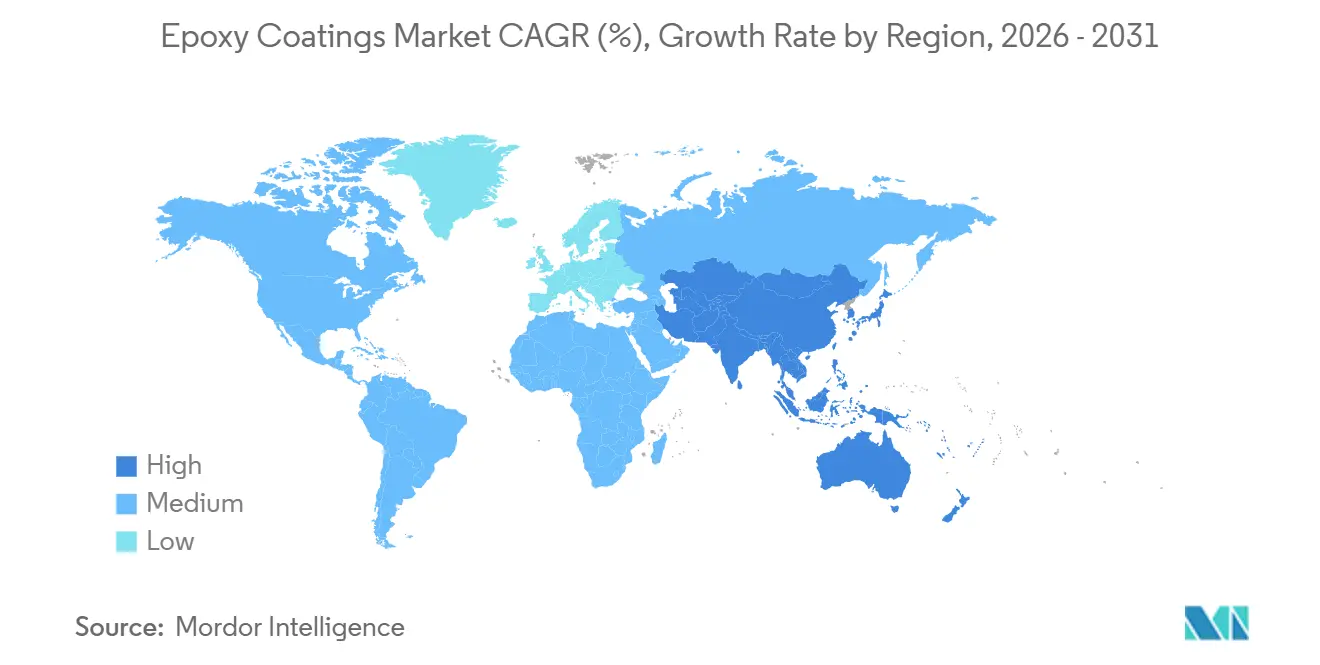
- By geography, Asia-Pacific contributed 46.55% of 2025 revenue and is on track for a 3.68% CAGR to 2031.
Note: Market size and forecast figures in this report are generated using Mordor Intelligence’s proprietary estimation framework, updated with the latest available data and insights as of 2026.
Market Trends and Insights
Drivers Impact Analysis of Epoxy Coatings Market*
| Drivers | (~) % Impact on CAGR Forecast | Geographic Relevance | Impact Timeline |
|---|---|---|---|
| Waterborne Epoxy Penetration Rising in Industrial Protective Coatings | +1.2% | Global, strongest in EU and North America | Medium term (2-4 years) |
| Construction Sector Expansion in Asia-Pacific and Africa | +0.9% | India, ASEAN, Saudi Arabia, South Africa | Long term (≥ 4 years) |
| Industrial Flooring Upgrades in Food and Beverage Plants | +0.5% | North America, EU, ASEAN | Short term (≤ 2 years) |
| Rapid-Cure UV/LED-Curable Epoxy Technologies | +0.4% | Major automotive clusters | Medium term (2-4 years) |
| EV Battery Casings and Motor Housings | +0.3% | China, South Korea, United States, EU | Long term (≥ 4 years) |
| Source: Mordor Intelligence | |||
Waterborne Epoxy Penetration Rising in Industrial Protective Coatings
Two-component waterborne systems now deliver dry-film uniformity within ±5 µm, matching solvent grades while cutting VOCs by 80% to meet the 420 g/L REACH limit[1]European Chemicals Agency, “REACH Annex XVII Entries,” echa.europa.eu. Propylene-carbonate co-solvents keep 20-minute open times without breaching CARB rules, enabling full U.S. roll-out. Petro-chemical and wastewater firms value the zero-flash-point profile, which lowers insurance premiums by up to 15%. Germany recorded a 28% rise in waterborne tank-lining volumes during 2025. Price parity with solvent systems, reached in late 2024, removed the final barrier to mainstream adoption.
Construction Sector Expansion in Asia-Pacific and Africa
India’s pipeline dedicates USD 1.3 trillion to highways, metros, and airports that specify epoxy primers on steel rebar. ASEAN attracted USD 240 billion of FDI in 2025, and 42% funded factories and data centers needing chemical-resistant floors. Saudi Arabia’s USD 500 billion NEOM allocates marine-grade coatings for high-salinity zones. The African Development Bank pegs the continent’s infrastructure deficit at USD 100 billion per year, much of which will require corrosion-resistant epoxy systems. South Africa’s ports are also upgrading with epoxy layers that prolong steel life in coastal humidity.
Industrial Flooring Upgrades in Food and Beverage Plants
The Food Safety Modernization Act mandates seamless, non-porous floors, driving processors from vinyl tile toward epoxy terrazzo. USDA audits in 2025 cited 34% of plants for floor cracking, accelerating retrofit cycles[2]United States Department of Agriculture, “FSIS Compliance Data,” usda.gov. Silver-ion antimicrobial additives now cut microbial counts by 99.9% within 24 hours, allowing monthly deep-cleans. Rapid-cure mortars resurface 1,000 m² overnight, so downtime falls to eight hours. Thailand’s CP Foods alone invested USD 120 million to refit 22 facilities during 2025.
Rapid-Cure UV/LED-Curable Epoxy Technologies
UV-curable chemistries polymerize in 3–10 s under 395 nm lamps, removing ovens and cutting energy use by 70%. German OEMs trimmed coating cycles from 45 min to 12 min after LED line installation in 2025. New photoinitiators now enable through-cure of 200 µm films for electronics encapsulation. Japan saw a 41% jump in UV-line adoptions across electronics plants in 2025. LED lamp life beyond 50,000 h keeps operating costs below USD 0.02 per m² coated.
Restraints Impact Analysis of Epoxy Coatings Market*
| Restraints | (~) % Impact on CAGR Forecast | Geographic Relevance | Impact Timeline |
|---|---|---|---|
| BPA and Epichlorohydrin Price Volatility | –0.6% | EU and North America | Short term (≤ 2 years) |
| PFAS and Microplastic Rules Threatening Powder Epoxy | –0.4% | EU and California | Medium term (2-4 years) |
| Shortage of Skilled Robotics Applicators | –0.2% | North America, Western Europe, ASEAN | Long term (≥ 4 years) |
| Source: Mordor Intelligence | |||
BPA and Epichlorohydrin Price Volatility Disrupting Cost Structures
Bisphenol A prices in Europe rose 22% during 2025 after provisional anti-dumping duties on Chinese epoxy imports. U.S. epichlorohydrin jumped 18% as Gulf Coast producers trimmed output on expensive natural gas. Indian vendors exploited duty-free feedstocks to undercut European suppliers by 12% in Middle East bids. Most formulators now favor quarterly instead of spot contracts, sacrificing flexibility. Raw materials consequently rose to 62% of finished-goods cost, squeezing mid-tier margins.
PFAS and Microplastic Rules Threatening Powder Epoxy Adoption
EU microplastics rules, effective January 2025, restrict powders that release particles under 5 mm unless overspray capture exceeds 95%. California placed fluorinated epoxy hardeners on its PFAS work plan, extending development cycles by up to two years. Anti-static additives help meet dust standards but add USD 0.40 per kg and lower gloss retention by 10% after 2,000 h QUV-A. Germany proposes extending similar limits to industrial coatings in 2026, forcing booth retrofits that cost up to USD 150,000 UBA.DE. Regulatory uncertainty is nudging automakers back toward low-VOC liquid grades despite powder’s 30% lower emissions.
*Our forecasts treat driver/restraint impacts as directional, not additive. The impact forecasts reflect baseline growth, mix effects, and variable interactions.
Epoxy Coatings Market Segment Analysis
By Technology:
Waterborne Systems Outpace Solvent AlternativesWater-based formulations seized 41.81% of 2025 revenue and are advancing at a 4.38% CAGR to 2031, owing to REACH caps of 420 g/L VOC for protective and 250 g/L for architectural coatings. Solvent-based blends cure faster below 10 °C and tolerate salt-contaminated steel, which offshore and winter jobs require. Powder grades face EU microplastics restrictions that push automakers toward low-VOC liquids. UV systems remain niche at under 1% yet deliver three-second cures for printed-circuit boards, offering future upside.
Waterborne chemistries have reached cost parity since late 2024 as scale economies emerged, and they achieve ISO 4624 adhesion above 3.5 MPa, matching solvent peers. Solvent-borne epoxies, however, still dominate marine tanks where surface salts up to 50 mg/m² exceed waterborne tolerance limits. Powder suppliers are trialing ultra-low-dust recipes with anti-static aids but accept a USD 0.40/kg cost penalty and 10% gloss fade after 2,000 h QUV-A. UV-curable grades gained traction in electronics because inline processing boosts board throughput to 120 units/h and slashes energy consumption.



By End-User Industry:
Industrial Segments Accelerate Past ConstructionBuilding and construction retained 40.31% of 2025 revenue on the back of mega-projects across India and ASEAN. Industrial users are the fastest expanding group at 3.61% CAGR because USDA sanitation audits trigger flooring retrofits. Automotive held an 18% share, driven by electric-vehicle battery casings that must survive aggressive thermal cycling. Transportation, including aerospace and rail, contributed 12% of revenue, fueled by Boeing and Airbus production ramps that specify corrosion-inhibiting primers.
Construction demand clusters in Asia-Pacific, where Belt and Road financed USD 28 billion of projects across 18 countries in 2025, each specifying epoxy protection on rebar. Industrial flooring upgrades accelerate in North America and Europe as processors shift to antimicrobial epoxies with silver ions that extend cleaning intervals. German automakers’ LED lines raised single-shift output to 180 vehicles, deepening reliance on fast-cure primers. Offshore wind growth in the North Sea and the South China Sea keeps marine-grade epoxies in demand for turbine towers enduring 5,000 h salt spray per ISO 9227.
Geography Analysis
APAC Epoxy Coatings Market
Asia-Pacific contributed 46.55% of 2025 revenue and is expected to grow 3.68% CAGR to 2031, propelled by India’s infrastructure push and USD 240 billion of FDI into ASEAN factories. India’s epoxy coatings market size is rising fastest as domestic players leverage distribution density in tier-2 cities. The Chinese market is supported by semiconductor cleanrooms that need ISO Class 5 compliant floors. LG Energy Solution's scaled battery-coat capacity is driving the South Korean market.
North America Epoxy Coatings Market
North America’s market growth is anchored by the USD 110 billion U.S. infrastructure law that mandates epoxy deck sealers for freeze–thaw resilience. The United States delivered 78% of regional sales, followed by Canada at 14% where Toronto’s CAD 25 billion transit expansion relies on tunnel linings with moisture barriers. Mexico benefited from USD 35 billion of nearshoring investment in aerospace and auto plants that specify epoxy floors.
Europe Epoxy Coatings Market
Europe accounted for significant revenue but faces margin pressure from VOC caps that require EUR 8–15 million reformulation outlays per product line. Germany led with 28% of regional sales thanks to automotive LED lines that sliced cure cycles to 12 min. The United Kingdom followed at 18%, boosted by GBP 44 billion of rail upgrades that need corrosion-proof steel coatings. France, Italy, and the Nordic zone round out the region with major metro, cruise, and offshore wind projects requiring epoxy protection.

Value Chain Analysis
Epoxy coatings value creation starts upstream with petrochemical and chlor-alkali feedstocks that are converted into epoxy resins and curing agents. Bisphenol A (BPA) and epichlorohydrin (ECH) dominate cost exposure, which links to the volatility referenced across 2025. Resin producers then supply liquid, solid, water-dispersible, and specialty semiconductor-grade epoxies to formulators, which blend pigments, fillers, and performance additives (including antimicrobial and rapid-cure packages) into water-based, solvent-based, powder-based, and UV/LED-curable coatings.
Midstream, formulators and large integrated coatings manufacturers run dispersion, let-down, and packaging lines, then sell product through direct-to-project channels (industrial flooring, marine, and infrastructure) and distributor networks. This determines how upstream and channel actions translate into end-customer availability: distribution expansion, such as Westlake Epoxy extending coverage in India, improves local access, while upstream rationalization, including the October 2025 shutdown of INEOS Rheinberg ECH and chlorine units, tightens European supply options. That shift raises the value of qualified purification capacity and specialized logistics, such as heated ISO tanks, to maintain consistent quality and on-time delivery.
Competitive Landscape
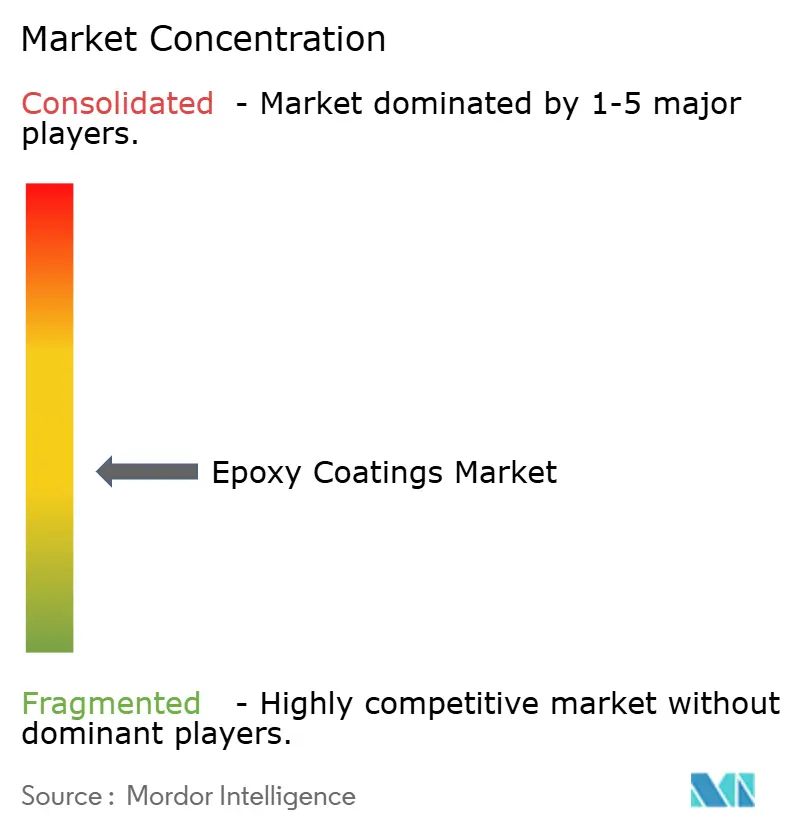
The epoxy coatings market is moderately consolidated. Bio-based epoxies from lignin and vegetable oils remain a white space with fewer than 50 active patents worldwide, offering startups fertile ground. Strategically, majors are deepening vertical integration and adding local production. Sherwin-Williams allotted USD 350 million to its Pune waterborne plant, shaving logistics costs by 18%.
Emerging disruptors such as Cardolite introduced cashew-shell-derived hardeners that meet USDA BioPreferred rules and command 12% price premiums in green buildings. Meanwhile, regional suppliers in Latin America and Africa gain share through fast service and private-label agreements with retailers. Despite rising raw-material volatility, mid-sized players prosper by tailoring niche formulations for local climate or regulatory quirks, keeping the epoxy coatings market competitive yet profitable.
Epoxy Coatings Industry Leaders
PPG Industries, Inc.
AkzoNobel N.V.
The Sherwin-Williams Company
Kansai Paint Co., Ltd.
Jotun
- *Disclaimer: Major Players sorted in no particular order
Epoxy Coatings Market Companies Covered in this Report
- AkzoNobel N.V.
- Asian Paints
- Axalta Coating Systems LLC
- BASF
- Berger Paints India
- Diamond Vogel
- DuluxGroup Ltd
- Hempel A/S
- Jotun
- Kansai Paint Co., Ltd.
- Koster Bauchemie AG
- Nippon Paint Holdings Co., Ltd.
- Pidilite Industries Limited
- PPG Industries, Inc.
- RPM International Inc.
- Sika AG
- The Euclid Chemical Company
- The Sherwin-Williams Company
- Tikkurila

Market Opportunities and Future Outlook
Near-term whitespace is concentrated in low-VOC and waterborne protective epoxies that can match solvent performance while meeting tightening solvent limits. Water-based systems already account for 41.81% of 2025 technology revenue, and supplier investments in capacity and route-to-market offer clear openings to localize supply and shorten lead times in high-growth consuming regions. PPGs January 2026 expansion in Sumare, Brazil, and Asian Paints November 2025 commissioning of a new epoxy plant in Visakhapatnam show how regional production is being used to improve cost-to-serve and VOC performance.
Upstream and intermediate expansions also support opportunities for differentiated formulations where raw-material availability and curing chemistry remain binding constraints. India is a focal point for integration and supply security after DCM Shriram commissioned full capacity of its Jhagadia ECH plant in April 2026, strengthening local resin and coating output and reducing import dependence for a key epoxy building block. On the performance side, specialty amine and additive availability is expanding, including Evonik starting operations at an expanded specialty amine facility in Nanjing in April 2026, which supports faster-cure and higher-durability systems used in industrial maintenance, infrastructure, and automotive applications where throughput and energy reduction are prioritized.
Recent Industry Developments in Epoxy Coatings Market
- May 2026: AkzoNobel made commercially available Interzone 954 protective coating enhanced with an ecosparc graphene-based additive manufactured in Australia. The update differentiates high-build epoxy performance in abrasion and corrosion-prone service, supporting premium positioning in heavy-duty protective segments.
- March 2025: Sherwin-Williams launched Heat-Flex Advanced Energy Barrier (AEB) for corrosion under insulation mitigation, recommending epoxy-based primers including Heat-Flex 750 and Heat-Flex ACE. The launch targets high-temperature industrial maintenance where downtime is costly, expanding epoxy usage beyond conventional ambient-cure protective systems.
- May 2024: Sherwin-Williams completed expansions at Deeside (UK) and Tournus (France) to increase production of valPure V70, a non-BPA epoxy coating for metal packaging. Added European capacity strengthens supply for regulatory-driven material shifts in packaging and supports customers seeking alternatives to BPA-based chemistries.


Epoxy Coatings Market Report Scope and Research Methodology
Market Definition and Coverage
This market covers the value of epoxy-based coating systems sold for protective and decorative use on substrates such as metal and concrete, across industrial and commercial end uses, measured as supplier revenues in USD.
Scope exclusions: It does not count epoxy resins sold mainly for adhesives, composites, or flooring mortars unless they are formulated and sold as coatings.
Segments Covered in This Report
- By Technology
- Water-based
- Solvent-based
- Powder-based
- By End-user Industry
- Building and Construction
- Automotive
- Transportation
- Industrial
- Others
- By Geography
- Asia-Pacific
- China
- India
- Japan
- South Korea
- ASEAN
- Rest of Asia-Pacific
- North America
- United States
- Canada
- Mexico
- Europe
- Germany
- United Kingdom
- France
- Italy
- NORDIC
- Russia
- Rest of Europe
- South America
- Brazil
- Argentina
- Rest of South America
- Middle-East and Africa
- Saudi Arabia
- United Arab Emirates
- South Africa
- Rest of Middle-East and Africa
- Asia-Pacific
Data Sources, Market Sizing, and Validation
Desk Research
Desk research is used to set the structure of the market model and to anchor demand signals that are visible in public data. We mainly relied on sources such as USGS mineral and materials statistics, US Census construction spending series, OECD and national statistics offices for industrial output, and customs and tariff databases for trade flows of relevant chemicals and coatings intermediates.
To keep assumptions realistic, we also reviewed company annual reports and investor presentations, technical papers and patents on epoxy coating formulations, and updates from industry associations and reputable business press on VOC rules and infrastructure programs. Where useful, analysts cross-checked supplier footprints and financial context using paid subscriptions for company financials and news intelligence, plus a patent database and an import-export shipment-level database to validate directional movement. These desk sources are illustrative, and other public references were also used for collection, validation, and clarification during the work.
Primary Interviews and Surveys
Primary work was used to pressure-test what desk sources cannot fully show, especially mix shifts between water-based, solvent-based, and powder systems and pricing behavior in protective maintenance cycles. Interviews covered raw material participants, coating formulators, distributors, and large end users across APAC, EMEA, and the Americas. Follow-up calls were then used to reconcile conflicting views on utilization rates and margin-led price resets.
Distribution of primary research fieldwork respondents
| Company type | Respondent position | Region |
|---|---|---|
| Top tier: 32% | CXOs: 15% | APAC: 45% |
| Mid tier: 50% | Functional/Unit leaders: 34% | EMEA: 34% |
| Smaller Players: 18% | Managers: 51% | Americas: 21% |
Market-Sizing & Forecasting
The model is built using a top-down approach where construction activity, industrial production, and protective maintenance intensity are converted into an addressable coating demand pool, then filtered for epoxy share by end use and technology. Once that foundation was in place, results were corroborated with selective bottom-up approximations using sampled supplier revenue splits, channel feedback on regional volumes, and an ASP-by-technology check to confirm totals remain within a believable range.
Key inputs tracked (as illustrative examples) include infrastructure and non-residential construction spend, steel and fabricated metal output, automotive and transportation production indicators, marine and energy maintenance cycles, and VOC-driven technology shifts that change the mix between water-based, solvent-based, and powder coatings. When bottom-up reference points had gaps, proxy penetration rates from comparable end uses were used, and then the estimates were adjusted after primary checks on local substitution and repaint frequency.
For forecasting, scenario analysis was applied around a central path, since epoxy demand is sensitive to uneven capex cycles and regulatory-driven mix changes. Assumptions for growth, technology mix, and pricing were reviewed with primary experts and then applied consistently year by year so the forecast stays repeatable and easy to audit.
Data Validation & Update Cycle
Outputs are triangulated through multiple checks, including consistency against regional construction and industrial indicators and reasonableness tests on implied volume and implied pricing by technology. If a country or end-use result appears out of line, the driver is traced back to the input sheet, and the assumption is either corrected or re-confirmed through a targeted re-contact.
Before sign-off, a second analyst reviews the logic, units, and currency treatment, followed by a final pass to ensure the narrative matches the numbers. Reports are refreshed annually, and interim updates are triggered when material events occur, such as sharp raw material swings or major regulatory changes that shift the technology mix.
Mordor Intelligence's Epoxy Coatings Market Size Versus Other Published Estimates
Published market sizes for epoxy coatings often vary even when the topic sounds identical, because the counted boundary can shift between coatings only versus broader epoxy materials, and because the assumed price path can differ by technology mix. Differences also show up when one estimate anchors to a different base year, or when currency conversion timing is not aligned across regions.
The table shows a tighter spread in the mid-2020s than in long-horizon forecasts, and in Mordor Intelligence's model the value is tied to epoxy coatings revenues across water-based, solvent-based, and powder technologies, rather than folding in non-coating epoxy uses or extrapolating a single aggressive price curve across all applications.
Benchmark comparison
| Source | Market Size | Gaps in Research Methodology |
|---|---|---|
| Mordor Intelligence | USD 39.51 B (2026) | |
| Regional Consultancy A | USD 41.28 B (2024) | Uses an earlier base year and a longer runway, and the scope is presented broadly by application and region, which can pull in adjacent epoxy product revenues and a different pricing mix by technology. |
| Trade Journal B | USD 40.79 B (2024) | Relies on a press-release style scope by product and application with a high growth arc to 2034, and the method is less clear on how technology mix and currency timing are normalized across regions. |
Taken together, the comparison suggests that base-year choice and what is counted as epoxy coatings versus nearby epoxy products explain most of the gap. By grounding the estimate in observable construction and industrial signals and then validating mix and pricing through primary checks, we keep the final number traceable to clear variables and repeatable steps.


Key Questions Answered in the Report
How large will epoxy coatings demand be by 2031?
The epoxy coatings market size is forecast to reach USD 46.49 billion by 2031, reflecting a 3.31% CAGR from 2026.
Which technology segment is expanding the fastest?
Water-based systems show the highest momentum at 4.38% CAGR because tightened VOC limits are accelerating their adoption.
Why are food plants replacing older floors?
Updated USDA sanitation audits found floor cracks in 34% of facilities in 2025, prompting a shift to seamless antimicrobial epoxy terrazzo that minimizes bacterial harborage.
How will European regulation affect suppliers?
REACH Annex XVII VOC caps force reformulation costs of EUR 8–15 million per product line, compressing margins and favoring firms with strong R&D funding.
What drives epoxy demand in electric vehicles?
Battery casings and motor housings require coatings that survive –40 °C to 85 °C cycling and resist dielectric breakdown above 10 kV/mm, needs met by cycloaliphatic epoxy chemistries.
Page last updated on:


 Your data is secure and never sold or shared.


