Market Overview
| Study Period | 2021 - 2031 |
|---|---|
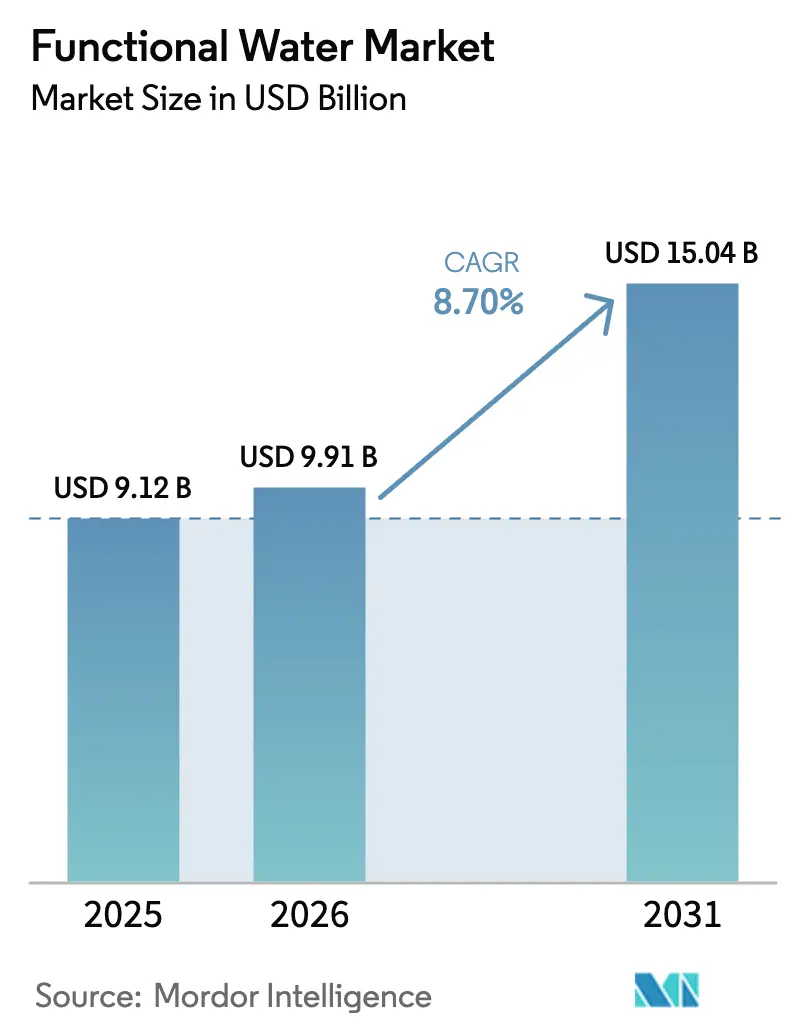
| Market Size (2026) | USD 9.91 Billion |
| Market Size (2031) | USD 15.04 Billion |
| Growth Rate (2026 - 2031) | 8.70% CAGR |
| Fastest Growing Market | Europe |
| Largest Market | North America |
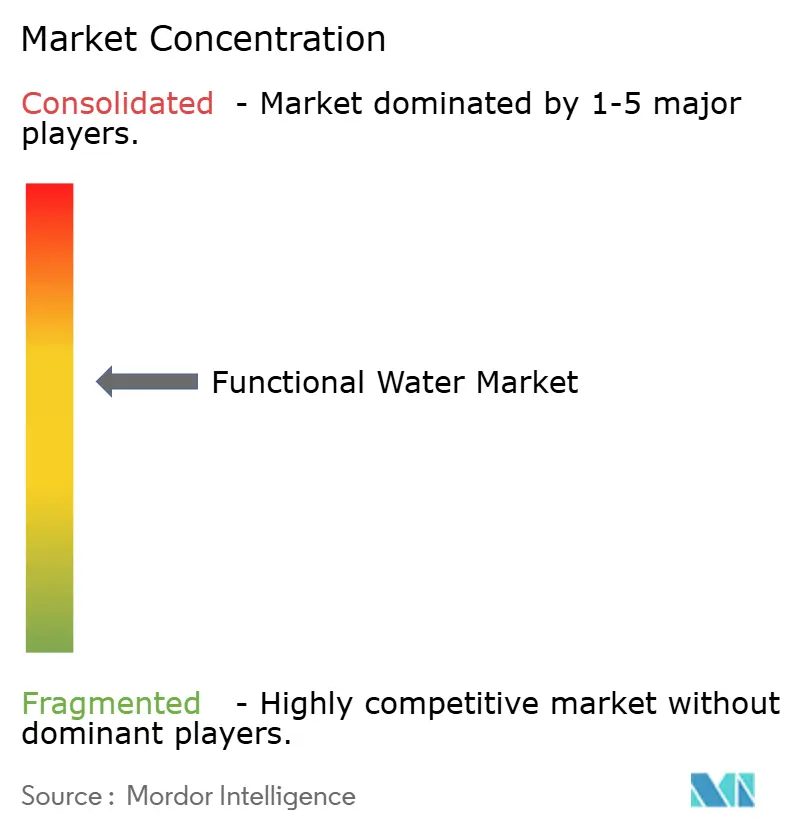
| Market Concentration | Medium |
Major Players
*Disclaimer: Major Players sorted in no particular order Image © Mordor Intelligence. Reuse requires attribution under CC BY 4.0. |
|
Functional Water Market Analysis by Mordor Intelligence
The Functional Water Market size is expected to increase from USD 9.12 billion in 2025 to USD 9.91 billion in 2026 and reach USD 15.04 billion by 2031, growing at a CAGR of 8.70% over 2026-2031. Once a niche segment, it has become mainstream due to rising demand for beverages offering health benefits beyond hydration. The market has evolved from basic vitamin and mineral enhancements to advanced formulations targeting immunity, energy, digestion, cognition, and skin health. Companies are incorporating innovative ingredients like electrolytes, botanicals, antioxidants, proteins, and probiotics. Competition is growing as established players use strong distribution networks and brand recognition, while new entrants focus on clean-label and natural products. Growth is driven by increasing health awareness, preventive healthcare trends, and demand for ready-to-drink options. Supermarkets and hypermarkets dominate sales, but online retail and specialty health stores are gaining traction due to changing shopping habits and direct-to-consumer models.
Key Report Takeaways
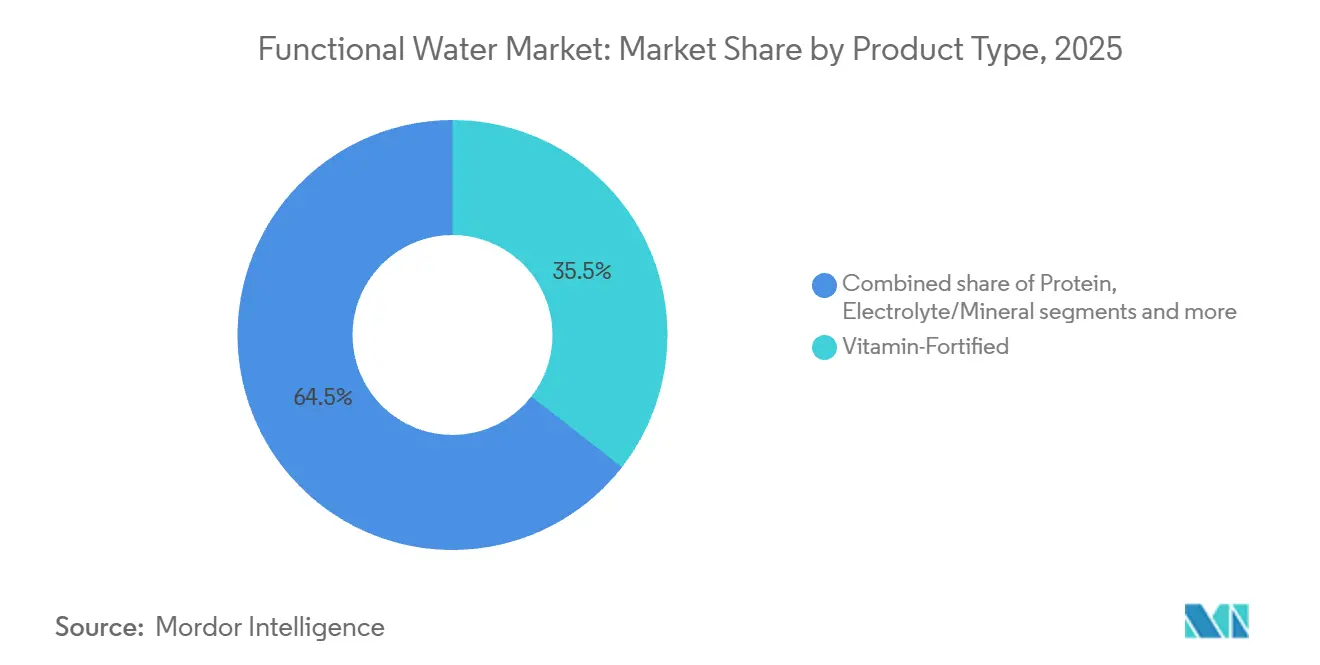
- By product type, vitamin-fortified variants captured 35.54% of the functional water market share in 2025 and are projected to grow at a 9.65% CAGR to 2031.
- By packaging, PET bottles held 85.12% revenue in 2025, while aluminum cans are forecast to post the fastest 10.43% CAGR from 2026 to 2031.
- By flavor, flavored waters led with a 75.43% share in 2025; the non-flavored sub-segment is set to rise at an 11.43% CAGR to 2031.
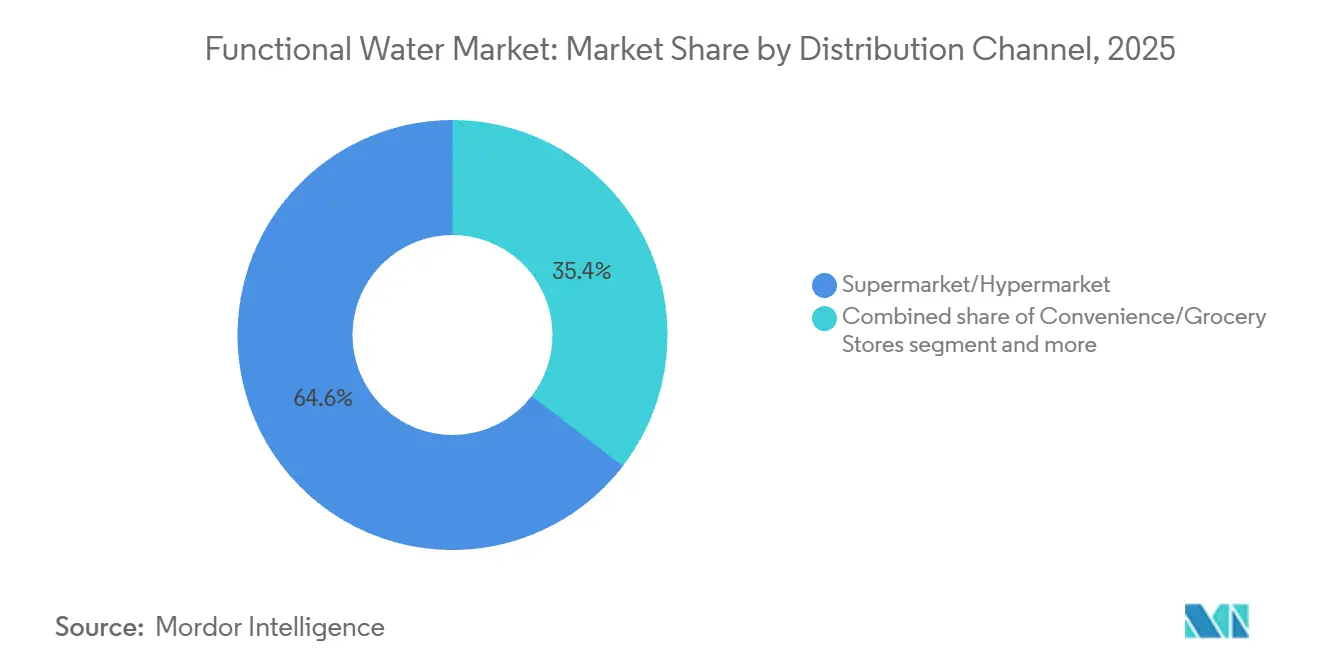
- By distribution channel, supermarkets and hypermarkets accounted for 64.56% of 2025 sales; online retail will expand the quickest with a 10.04% CAGR through 2031.
- By geography, North America commanded 51.22% of 2025 revenue, while Europe is projected to post a 9.17% CAGR from 2026 to 2031.
Note: Market size and forecast figures in this report are generated using Mordor Intelligence’s proprietary estimation framework, updated with the latest available data and insights as of January 2026.
Global Functional Water Market Trends and Insights
Drivers Impact Analysis*
| Driver | (~) % Impact on CAGR Forecast | Geographic Relevance | Impact Timeline |
|---|---|---|---|
| Rising Health Awareness Fuels Demand for Beverages with Added Vitamins, Minerals, And Electrolytes | +2.4% | Global, with strongest impact in North America and Europe | Long term (≥ 4 years) |
| Increasing Preference for Low-Calorie Alternatives Boosts Functional Water Consumption | +1.7% | North America, Europe, Urban Asia-Pacific | Medium term (2-4 years) |
| Busy Lifestyles Increase Demand for Convenient and Portable Health Beverages | +1.2% | Global, with emphasis on urban centers | Medium term (2-4 years) |
| Strategic Endorsements and Marketing by Celebrities and Athletes Enhance Brand Appeal | +0.8% | North America, Europe, Developed Asia-Pacific | Short term (≤ 2 years) |
| Product Innovations with Botanical Extracts and Nootropics Attract Wellness-Oriented Consumers | +1.3% | North America, Europe, Australia | Medium term (2-4 years) |
| Expansion of Modern Retail and Online Channels Improves Product Accessibility Globally | +0.9% | Global, with emphasis on emerging markets | Medium term (2-4 years) |
| Source: Mordor Intelligence | |||


Rising Health Awareness Fuels Demand for Beverages with Added Vitamins, Minerals, And Electrolytes
Since the pandemic, consumers have become more focused on checking ingredient labels. Functional water has gained popularity as a low-calorie option for delivering essential nutrients. The FDA's 21 CFR 165.110 standards allow bottled water to include safe ingredients like vitamins and minerals, as long as the labels clearly show the nutrient content. This regulation enables brands to add B-vitamins, vitamin C, zinc, and magnesium without classifying the products as dietary supplements, which would require stricter approval processes. Similarly, in Europe, EFSA's health claims regulation (EC No 1924/2006) allows nutrient function claims if specific minimum levels are met, supporting market growth in the region. Additionally, electrolyte-enhanced water has become a favorite among fitness enthusiasts who want hydration without the high sugar content of traditional sports drinks. This shift has significantly boosted functional beverage sales in the U.S., which grew by over 54% between March 2020 and March 2024.
Increasing Preference for Low-Calorie Alternatives Boosts Functional Water Consumption
Health-conscious consumers are increasingly moving away from sugary beverages and opting for zero- or low-calorie functional waters. These drinks offer perceived health benefits while supporting weight management goals. To meet this demand, The Coca-Cola Company plans to launch "vitaminwater zero sugar" variants in March 2025. These beverages provide vitamin fortification without calories, using stevia and erythritol as sweeteners. In the European Union, the Sweeteners Directive (94/35/EC) allows the use of approved non-nutritive sweeteners in beverages, enabling companies to innovate while staying compliant with regulations. This trend is also gaining traction in urban markets across the Asia Pacific, where rising diabetes rates and government-led sugar reduction campaigns are driving changes in beverage offerings. The segment's 1.5% CAGR highlights its growth potential, supported by faster reformulation processes and increasing consumer awareness of sugar alternatives.
Busy Lifestyles Increase Demand for Convenient and Portable Health Beverages
The growing need for convenient health beverages, driven by fast-paced lifestyles, is boosting the functional water market. As urbanization increases, people are managing work, family, and social responsibilities, creating a higher demand for portable hydration options with added benefits. Functional water, packaged in bottles or cans, is fortified with vitamins, minerals, electrolytes, and botanical extracts that help improve immunity, energy levels, digestion, and athletic recovery. These features appeal to millennials, fitness enthusiasts, and health-conscious consumers looking for low-calorie, efficient alternatives to traditional soft drinks. Furthermore, the expanding workforce is playing a significant role in driving the growth of the functional water market. As of October 2024, the United States Bureau of Labor Statistics reported 161.94 million employed individuals, highlighting the substantial consumer base managing structured routines with limited time for comprehensive hydration planning [1]Source: Bureau of Labor Statistics, "The Employment Situation - April 2025", bls.gov.
Strategic Endorsements and Marketing by Celebrities and Athletes Enhance Brand Appeal
Brands in the functional water market are increasingly using celebrity and athlete partnerships to stand out in a competitive space. These endorsements enhance the credibility of wellness claims while adding aspirational value to the brand. They also boost visibility on social media and in retail stores, particularly among younger consumers who value authentic brands that align with their lifestyles. Although companies often reveal specific endorsement deals in filings or press releases, the overall trend is clear in their marketing budgets and brand strategies. This approach contributes 0.8% to the CAGR and has a medium-term impact, as endorsement agreements typically last several years and require ongoing investment to keep the brand fresh in consumers' minds. The impact is strongest in North America and Europe, where influencer marketing is well-established. However, as digital adoption grows, this trend is beginning to gain traction in Latin American markets as well.
Restraints Impact Analysis*
| Restraint | (~) % Impact on CAGR Forecast | Geographic Relevance | Impact Timeline |
|---|---|---|---|
| High Product Prices Limit Accessibility in Price-Sensitive Markets | -1.2% | Emerging markets, price-sensitive segments in developed markets | Medium term (2-4 years) |
| Brand Differentiation in a Crowded Functional Beverage Market Hinders Growth | -0.8% | North America, Europe | Short term (≤ 2 years) |
| Intense Competition from Flavored Water, Sports Drinks, And Energy Beverages | -0.9% | Global | Medium term (2-4 years) |
| Lack of Consumer Awareness in Rural and Underdeveloped Regions Hampers Market Growth | -0.6% | Rural areas in Asia-Pacific, Africa, parts of Latin America | Long term (≥ 4 years) |
| Source: Mordor Intelligence | |||
High Product Prices Limit Accessibility in Price-Sensitive Markets
The higher cost of functional waters compared to regular bottled water creates a significant challenge for market growth in price-sensitive regions. Although premium pricing boosts brand profitability, it limits these products to higher-income consumers. This issue is particularly prominent in emerging economies, where affordability often takes precedence over functional benefits. The market's vulnerability becomes more apparent during economic downturns, as seen during recent inflationary periods. Manufacturers who adopt tiered pricing models while maintaining product quality can expand their reach to a broader audience. This strategy is especially important in emerging markets, where price remains the primary obstacle to growth.
Brand Differentiation in a Crowded Functional Beverage Market Hinders Growth
The functional water market faces significant challenges in standing out within the highly competitive functional beverage segment. Many companies are introducing products with similar health claims, such as improved hydration, energy enhancement, immune support, and detoxification. This overlap has blurred the distinctions between functional waters, energy drinks, vitamin-infused beverages, and flavored waters, making it harder for brands to establish a unique identity that consistently attracts consumers. Major players like PepsiCo, Coca-Cola, and Nestlé dominate the market by leveraging their extensive distribution networks, large marketing budgets, and strong brand loyalty. These companies fill store shelves with comparable products, including PepsiCo's VitaminWater and LIFEWTR, Coca-Cola's Glaceau Smart Water and VitaminWater, and Nestlé's mineral-enriched waters. This dominance creates significant barriers for smaller companies like Hint Inc. and Nirvana Water Sciences, which must rely on innovative ingredient combinations or specific wellness claims to compete effectively.
*Our forecasts treat driver/restraint impacts as directional, not additive. The impact forecasts reflect baseline growth, mix effects, and variable interactions.
Segment Analysis
By Product Type: Vitamin Variants Lead Innovation Wave
In 2025, vitamin-fortified functional water made up 35.54% of the market revenue, showcasing strong consumer interest in hydration products with added health benefits. This segment's leadership is supported by clear regulations from the FDA and EFSA, which allow vitamin fortification as long as product labels are accurate and not misleading. In March 2025, Coca-Cola Company introduced a refreshed 'vitaminwater' line, featuring zero-sugar options fortified with B-vitamins and vitamin C. These products target calorie-conscious consumers looking for functional benefits without compromising their weight management goals. The segment is expected to grow at a 9.65% CAGR through 2031, driven by advancements in bioavailable vitamin forms, such as methylcobalamin over cyanocobalamin for B12, and nutrient combinations that improve absorption.
Consumers are already familiar with the benefits of vitamins, which reduces the need for extensive education compared to newer ingredients like nootropics or adaptogens. Brands can use health claims approved under EFSA Regulation (EC) No 1924/2006, such as "Vitamin C supports the normal function of the immune system," to effectively communicate their value to health-conscious shoppers. With a projected 9.65% CAGR—the highest among product types—vitamin-fortified functional water is positioned as the primary growth driver in the category. Innovations are focusing on clean-label formulations, natural colorants, and sustainable packaging to meet evolving consumer preferences.


By Packaging: Sustainability Reshapes Container Strategies
PET bottles commanded 85.12% of 2025 functional water sales, entrenched by their lightweight, shatter-resistant properties and established manufacturing infrastructure. However, aluminum cans are set to expand at 10.43% CAGR through 2031, driven by sustainability mandates and consumer perception of aluminum as infinitely recyclable compared to plastic's lower recycling rates. Ball Corporation and Crown Holdings have both reported capacity expansions to meet surging demand for aluminum beverage packaging, with Ball announcing investments in new can production lines across North America and Europe in 2024.
The shift toward cans is most pronounced among younger demographics who prioritize environmental sustainability and associate aluminum packaging with premium positioning. Liquid Death's January 2026 launch of caffeinated functional water in 16-ounce aluminum cans exemplifies how brands are leveraging packaging format to differentiate in crowded retail environments. According to the International Aluminium Institute, aluminum's 76% global recycling rate substantially exceeds PET's recycling performance, presenting both environmental advantages and strategic marketing opportunities for brands prioritizing sustainability initiatives [2]Source: The International Aluminium Institute, "Aluminium Recycling", international-aluminium.org.
By Distribution Channel: Online Growth Disrupts Traditional Retail Dominance
In 2025, supermarkets and hypermarkets accounted for 64.56% of functional water sales, benefiting from their wide reach and ability to offer a variety of products in one place. These stores play a key role in increasing brand visibility and driving promotions. Strategies like end-cap displays and in-store sampling effectively encourage customers to try and repurchase products. However, the market is evolving, with online retail stores expected to grow at a strong 10.04% CAGR through 2031. Online platforms are changing the distribution model by eliminating traditional retail mark-ups and introducing subscription-based loyalty programs. For instance, Vita Coco experienced a 31% increase in volume in Q3 2025, partly due to improved e-commerce capabilities and partnerships with online grocery platforms.
Online channels are making functional water more accessible in areas where modern retail infrastructure is still developing, such as tier-2 and tier-3 cities in Asia Pacific and regions across the Middle East and Africa. These platforms also help educate consumers by providing detailed product information, transparent ingredient lists, and user reviews, which build trust and guide purchase decisions. The projected 10.04% CAGR for online retail highlights the growing importance of this channel, supported by advancements in digital payment systems, last-mile delivery, and increasing consumer confidence in online grocery shopping. Brands that focus on enhancing their e-commerce presence—through better product listings, influencer collaborations, and subscription models—are well-positioned to capitalize on this high-growth opportunity.
By Flavor: Non-Flavored Segment Accelerates Despite Flavored Dominance
In 2025, flavored functional water led the market, contributing 75.43% of the total revenue. This category appeals to consumers who enjoy a variety of flavors and a more engaging drinking experience compared to plain water. However, non-flavored functional water is expected to grow at a faster pace. This growth is driven by health-conscious consumers who prefer clean-label products without natural or artificial flavorings. Fitness enthusiasts and wellness-focused individuals, in particular, see added flavors as unnecessary and believe they detract from the product's functional benefits. To address these differing preferences, The Coca-Cola Company offers both flavored and non-flavored options in its zero-sugar vitaminwater line.
The rising demand for non-flavored functional water reflects a broader shift toward simpler, more transparent ingredient lists. Consumers are increasingly avoiding unnecessary additives and choosing products with minimal ingredients. This segment benefits from lower production costs, as removing flavor systems simplifies formulations and reduces potential allergen risks, while still providing essential nutrients like vitamins, electrolytes, or proteins. With its 11.43% CAGR, non-flavored functional water is becoming a key growth area, especially in Europe, where strict clean-label regulations and skepticism toward synthetic ingredients are more prevalent. Brands that effectively communicate the purity and functional benefits of non-flavored options are well-positioned to gain market share from both traditional bottled water and flavored functional water segments.
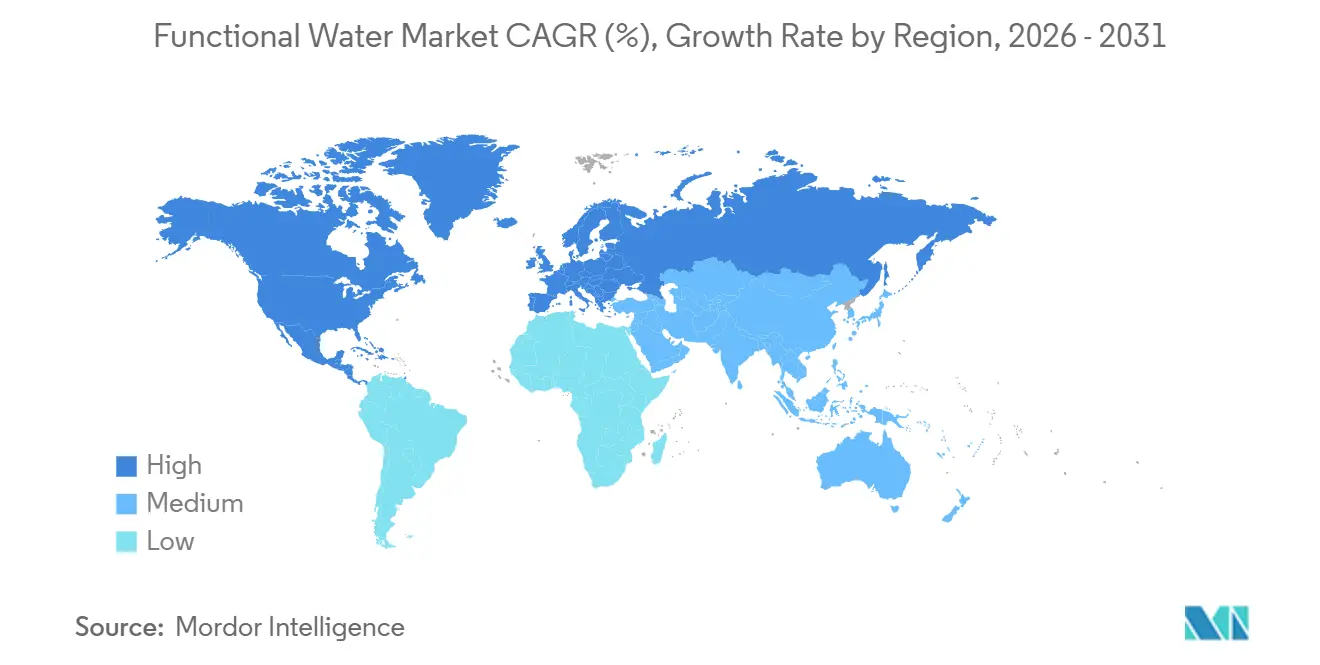
Geography Analysis
In 2025, North America dominated the functional water market, capturing a substantial 51.22% share. This leadership is attributed to factors such as high consumer awareness about health benefits, well-established retail distribution networks, and a strong fitness-oriented culture that values functional beverages. Furthermore, North America plays a critical role as an innovation hub, where leading companies like PepsiCo and Coca-Cola introduce and test new functional water products before expanding them to global markets.
Europe represents the fastest-growing regional market with a projected CAGR of 9.17% from 2026-2031. The region benefits from established regulatory frameworks for health claims and increasing consumer understanding of functional ingredients. European consumers demonstrate heightened scrutiny of health claims, leading to an emphasis on scientific substantiation and clean-label formulations. The EU's Nutrition and Health Claims Regulation influences the market by requiring scientific validation of functional claims, creating opportunities for brands meeting these standards [3]Source: European Commission, "Nutrition and Health Claims", commission.europa.eu. In the Asia-Pacific region, factors such as urbanization, rising disposable incomes, and growing health consciousness are fueling demand, particularly in countries like Japan, South Korea, and Australia.
The Middle East and Africa present emerging opportunities, although growth patterns vary across these regions. Urban areas are adopting functional water at a faster pace, while rural areas face challenges such as limited distribution networks and price sensitivity. In the Middle East, concerns over water scarcity are driving demand for functional water brands that offer premium hydration while promoting water conservation. Globally, the functional water market is shifting toward localized products tailored to regional tastes and specific functional needs, moving away from standardized global offerings.

Competitive Landscape
The functional water market is moderately consolidated, with major players like Coca-Cola, PepsiCo, and Nestlé holding a significant share alongside smaller, specialized brands. Large companies are actively acquiring niche players to expand their functional water portfolios, driving changes in the market structure. The competition highlights the production and distribution strengths of these large corporations, while smaller brands bring innovation by introducing unique functional concepts, often becoming acquisition targets for industry leaders.
The market is growing, especially in areas like cognitive function, stress relief, hydration, and immune support. As consumers pay closer attention to product labels, companies are focusing on functional claims backed by scientific evidence, such as clinical trials or peer-reviewed research, instead of vague wellness promises. This science-based approach is particularly appealing to health-conscious millennials and Gen Z. Additionally, advancements in ingredient technology, longer shelf life, and sustainable packaging are creating new opportunities for brands to stand out.
Although established companies dominate, the moderate market concentration leaves room for both consolidation and new entrants. Direct-to-consumer (DTC) models, social media marketing, and subscription-based sales are lowering entry barriers, enabling startups with clear positioning and strong consumer engagement to compete effectively. As health trends become more personalized, innovations like data-driven customization and combining multiple benefits in one product (functional stacking) are expected to drive the next phase of growth in the functional water market.
Functional Water Industry Leaders
-
The Coca-Cola Company
-
PepsiCo, Inc.
-
Danone S.A.
-
Nestle S.A.
-
Hint Inc.
- *Disclaimer: Major Players sorted in no particular order

Recent Industry Developments
- April 2025: Powerade expanded into functional water with the new Power Water launch. According to the brand, Power Water is a zero-sugar, electrolyte-enhanced flavoured water designed to meet the hydration needs of today’s active consumers.
- April 2025: Wet Hydration launched Build, a kiwi passionfruit-flavored protein water, expanding its beverage portfolio. The company also introduced new varieties of canned still and sparkling waters to cater to diverse consumer preferences in the hydration market.
- March 2025: Rubicon Spring Vits has launched its functional water in three delightful flavors: Black Cherry Pomegranate, Mango Passion, and Strawberry Watermelon. Made with spring water, fruit juice, and natural flavors, this beverage is enriched with essential vitamins to enhance energy and boost immunity. Each flavor contains only 15 calories and fully complies with HFSS standards.
- April 2024: Plus Brand expanded its Agua Plus product line by introducing four new functional beverages. The company offers Agua Plus in 355 mL bottles (8-pack) and 1 L bottles (6-pack).


Research Methodology Framework and Report Scope
Market Definitions and Key Coverage
Our study treats the functional water market as all packaged, ready-to-drink, non-alcoholic waters that are purposely fortified with vitamins, minerals, electrolytes, botanicals, proteins, probiotics, or similar actives that claim benefits beyond basic hydration. Products can be still or lightly sparkling, flavored or plain, and are typically sold through retail and food-service channels worldwide.
(Exclusion) Waters marketed solely as purified, mineral, spring, or flavored without any added functional ingredient are outside our scope.
Segmentation Overview
-
By Product Type
- Vitamin
- Protein
- Electrolyte/Mineral
- Others
-
By Packaging
- PET Bottle
- Can
- Others
-
By Flavor
- Flavored
- Non-Flavored
-
By Distribution Channel
- Supermarkets/Hypermarkets
- Convenience/Grocery Stores
- Online Retail Stores
- Other Distribution Channels
-
By Geography
-
North America
- United States
- Canada
- Mexico
- Rest of North America
-
Europe
- Germany
- United Kingdom
- Italy
- France
- Spain
- Netherlands
- Poland
- Belgium
- Sweden
- Rest of Europe
-
Asia Pacific
- China
- India
- Japan
- Australia
- Indonesia
- South Korea
- Thailand
- Singapore
- Rest of Asia-Pacific
-
South America
- Brazil
- Argentina
- Colombia
- Chile
- Peru
- Rest of South America
-
Middle East and Africa
- South Africa
- Saudi Arabia
- United Arab Emirates
- Nigeria
- Egypt
- Morocco
- Turkey
- Rest of Middle East and Africa
-
North America
Detailed Research Methodology and Data Validation
Primary Research
Mordor analysts interviewed brand managers, contract bottlers, ingredient formulators, and large grocery buyers across North America, Europe, and Asia Pacific. These conversations revealed real-world average selling prices, emerging formulation preferences such as collagen peptides, and regional retailer mark-up norms, which we then used to fine-tune desk-derived assumptions.
Desk Research
We start with open datasets such as UN Comtrade trade code 2202, USDA FoodData Central, and the United States CDC Beverage Consumption surveys, which give us baseline volume and intake trends. Trade association portals, for example, the International Bottled Water Association and the European Federation of Bottled Waters, provide shipment and packaging splits, while national statistics offices track PET resin usage that hints at bottling output. Paid libraries like D&B Hoovers and Dow Jones Factiva let our analysts validate company revenues and new launch news flows. The sources listed illustrate, not exhaust, the references tapped during data collection, cross-checks, and definition clarifications.
Market-Sizing & Forecasting
A top-down build links per-capita packaged water consumption to the functional water share captured from ingredient adoption surveys. Volumes are multiplied by country-specific average retail prices and converted to USD to create the 2025 baseline. Supplier roll-ups of leading SKUs and selective channel checks act as a bottom-up reasonableness filter. Key variables in the forecast include gym membership penetration, sugar-tax intensity, PET packaging cost trends, online grocery share, and disposable income growth. A multivariate regression model projects how those drivers shift functional water's penetration through 2030. Any gaps in SKU data are bridged using weighted ASP brackets confirmed during primary calls.
Data Validation & Update Cycle
Outputs pass a two-step analyst peer review, anomaly flags trigger re-checks with source files, and material news such as a sugar-tax rollout prompts an interim refresh. All figures are revisited annually, so clients always receive the most current view.
Why Our Functional Water Baseline Inspires Confidence
Published estimates often diverge because firms choose different product mixes, price points, and refresh cadences.
Key gap drivers include whether protein waters are counted, how flavored-only SKUs are handled, the currency conversion year, and the depth of primary validation that backs modeled average prices.
Benchmark comparison
| Market Size | Anonymized source | Primary gap driver |
|---|---|---|
| USD 9.91 B (2025) | Mordor Intelligence | - |
| USD 17.12 B (2024) | Global Consultancy A | Includes flavored water without actives and applies single global ASP |
| USD 7.02 B (2025) | Research Publisher B | Uses export volumes only and omits online retail sales |
The comparison shows that when scope is tightened to truly functional formulations and validated with on-ground price checks, Mordor's balanced figure sits between over-inclusive and under-reported totals, giving decision-makers a dependable starting point.


Key Questions Answered in the Report
What is the current value of the functional water market?
The functional water market size is valued at USD 9.91 billion in 2026 and is forecast to reach USD 15.04 billion by 2031.
Which region leads global sales?
North America holds the largest regional share at 51.22% of global revenue due to high health literacy and extensive retail infrastructure.
Which product type is growing the fastest?
Vitamin-fortified functional waters lead both share and growth, recording a 9.65% projected CAGR through 2031.
How are packaging trends changing?
PET bottles remain dominant, but cans are set to grow at a 10.43% CAGR owing to superior recycling rates and premium branding appeal.
Page last updated on:


