
Food Waste Disposers Market Size and Share
Market Overview
| Study Period | 2020 - 2031 |
|---|---|
| Market Size (2026) | USD 3.71 Billion |
| Market Size (2031) | USD 4.89 Billion |
| Growth Rate (2026 - 2031) | 5.68 % |
| Fastest Growing Market | Asia Pacific |
| Largest Market | North America |
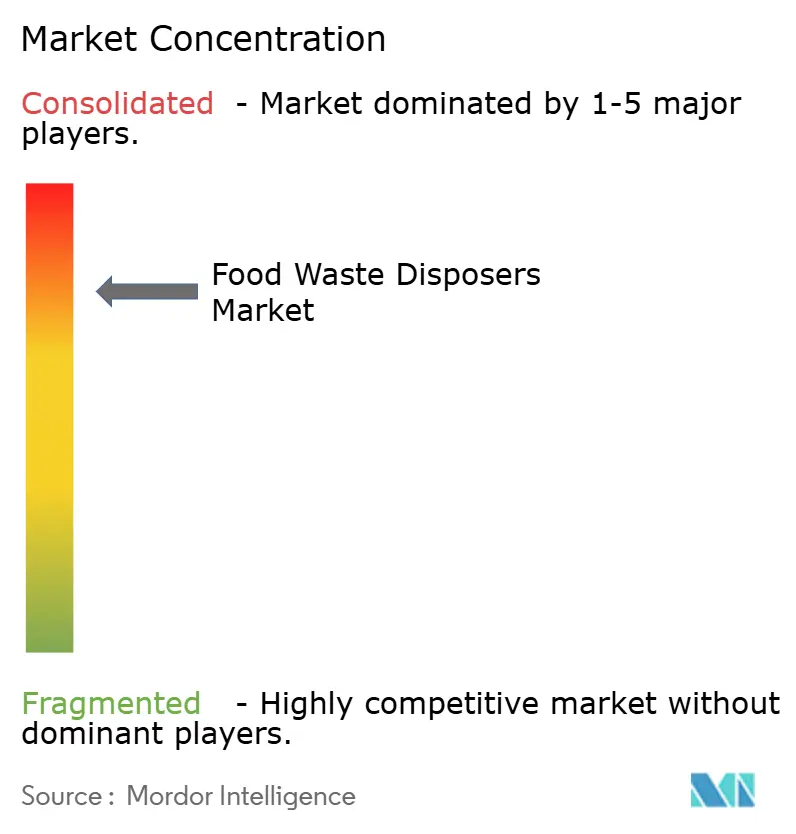
| Market Concentration | High |
Major Players *Disclaimer: Major Players sorted in no particular order Image © Mordor Intelligence. Reuse requires attribution under CC BY 4.0. | |
Food Waste Disposers Market Analysis by Mordor Intelligence
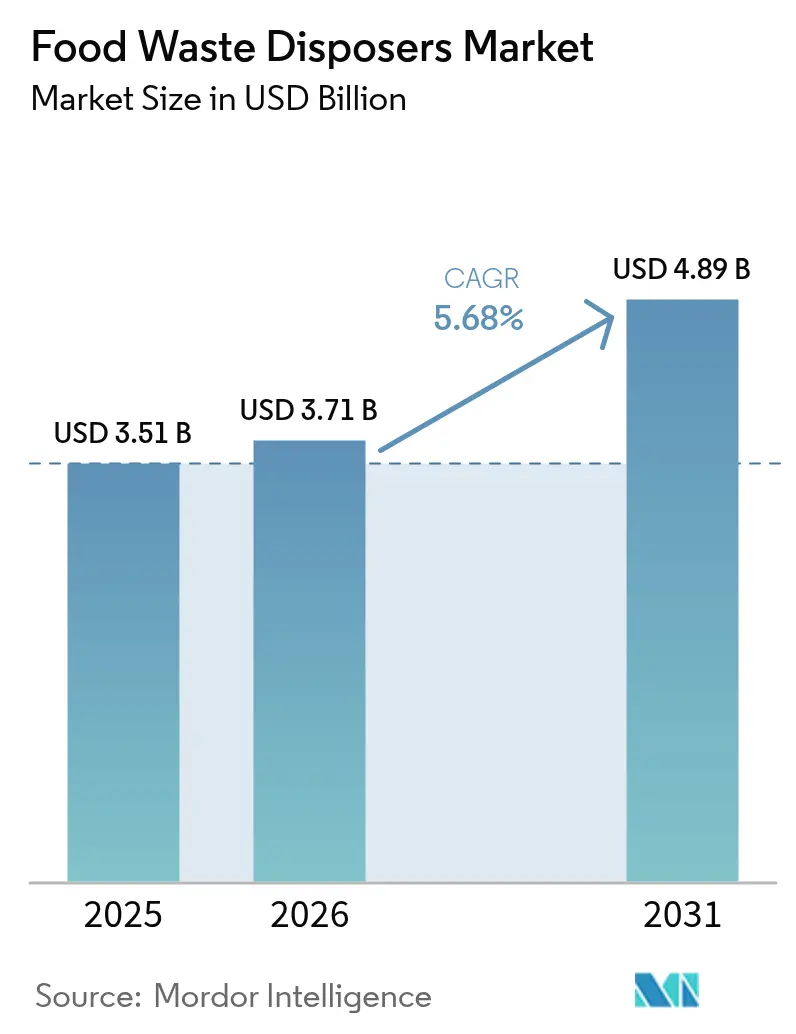
The food waste disposers market size in 2026 is estimated at USD 3.71 billion, growing from 2025 value of USD 3.51 billion with 2031 projections showing USD 4.89 billion, growing at 5.68% CAGR over 2026-2031. Stringent landfill-diversion mandates, the steady rollout of municipal anaerobic-digestion capacity, and rising consumer demand for connected kitchen appliances are reinforcing a multiyear growth runway for the food waste disposers market. The California SB 1383 framework has become a template for other jurisdictions, accelerating adoption cycles and shortening payback periods for disposer investments. Technology shifts—particularly MultiGrind cutters, torque-managed permanent-magnet motors, and real-time IoT telemetry—help vendors defend margin while converting latent demand into installed base. Additionally, drought-prone regions now reward water-saving impellers, linking disposer uptake with broader resource-efficiency goals that were once viewed in isolation.
Key Report Takeaways
- By product type, grinding units contributed 69.20% revenue of the food waste disposers market in 2025; bio-degradable alternatives are expanding at a 7.32% CAGR toward 2031.
- By feed type, continuous-feed models represented 54.40% of the food waste disposers market size in 2025, with batch-feed units advancing at a 6.52% CAGR.
- By daily processing capacity, 75-400 kg systems captured 64.30% share of the food waste disposers market size in 2025 and are growing at a 6.85% CAGR.
- By operation, electric units secured 64.20% revenue of the food waste disposers market in 2025 and sustained a 6.45% CAGR outlook through 2031.
- By end user, commercial facilities held 74.10% of the food waste disposers market share in 2025, while residential installations are projected to rise at a 6.75% CAGR through 2031.
- By distribution channel, B2B/Directly from the Manufacturers held 67.25% of the food waste disposers market share in 2025, while B2C/Retail (online) is projected to rise at an 8.05% CAGR through 2031.
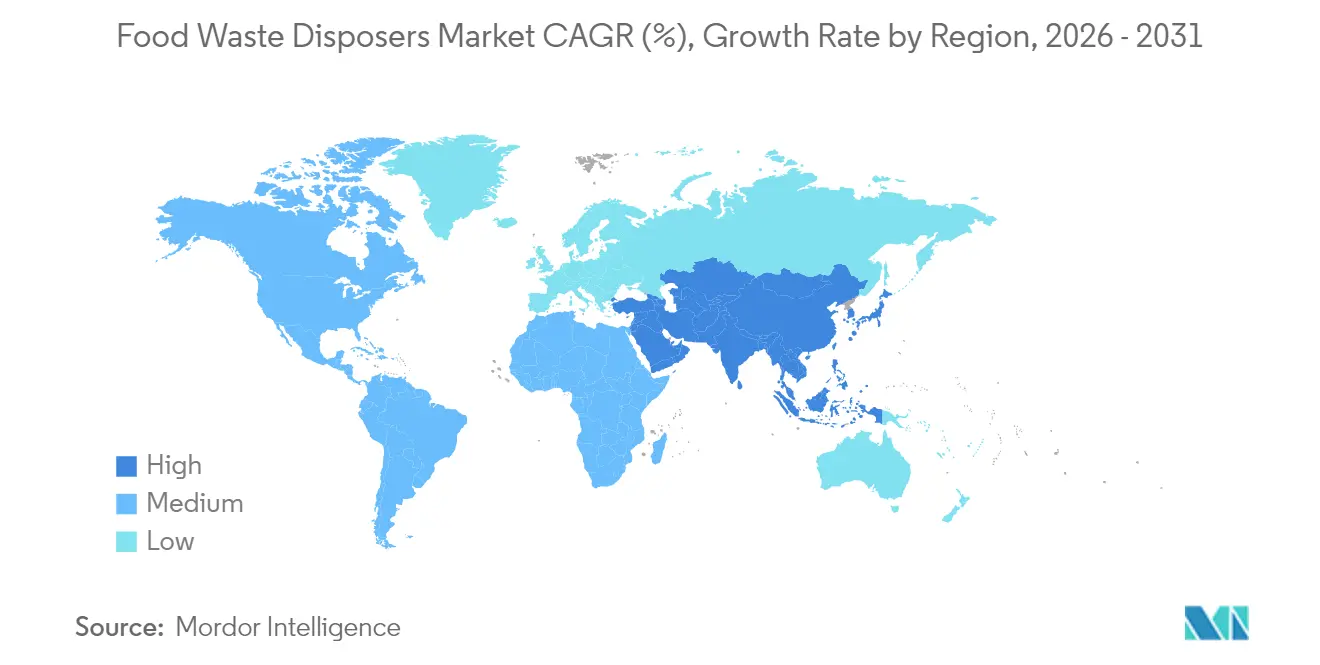
- By region, North America led with 37.45% revenue of the food waste disposers market in 2025, whereas Asia-Pacific is on track for a 7.05% CAGR to 2031.
Note: Market size and forecast figures in this report are generated using Mordor Intelligence’s proprietary estimation framework, updated with the latest available data and insights as of 2026.
Market Trends and Insights
Drivers Impact Analysis of Food Waste Disposers Market*
| Driver | % Impact on CAGR Forecast | Geographic Relevance | Impact Timeline |
|---|---|---|---|
| Rising household demand for convenience-oriented kitchen appliances | +1.2% | Global, with a concentration in North America & Europe | Medium term (2-4 years) |
| Stringent landfill-diversion mandates & municipal incentives | +1.8% | North America core, expanding to APAC & Europe | Short term (≤ 2 years) |
| Expansion of anaerobic-digestion facilities accepting disposer slurry | +0.9% | North America & Europe, emerging in APAC | Long term (≥ 4 years) |
| Proliferation of zero-waste certification programs in foodservice chains | +0.7% | Global, led by North America & Europe | Medium term (2-4 years) |
| Emergence of smart, IoT-enabled premium disposers | +0.6% | Developed markets, premium segments globally | Medium term (2-4 years) |
| Water-efficient disposer designs gaining approval in drought-prone regions | +0.4% | Western North America, Australia, select EU regions | Long term (≥ 4 years) |
| Source: Mordor Intelligence | |||
Rising Household Demand for Convenience-Oriented Kitchen Appliances
Connected homes have normalized fixture-level sensing, prompting consumers to elevate disposers from optional accessories to baseline utilities. Mill Industries’ February 2024 AI-driven recycler shortens cycle time while logging diversion metrics compliant with SB 1383, showing how data transparency converts sustainability intent into measurable results [1]. Voice-assistant integration allows hands-free activation that meshes with modern cooking routines and hygiene expectations. Real-time monitoring encourages correct loading behavior, curbing clogs and warranty claims. Accordingly, premium SKUs achieve higher attachment rates in new-home packages, cementing long-term growth for the food waste disposers market. Appliance retailers report that disposer attach rates rise 18 percentage points when bundled with smart faucets, underscoring ecosystem pull-through.
Stringent Landfill-Diversion Mandates & Municipal Incentives
Policy intervention remains the chief accelerator for the food waste disposers market. New Hampshire’s February 2025 disposal ban for generators exceeding 1 ton of weekly food waste within 20 miles of an organics facility instantly redirected procurement budgets to in-sink solutions [2]. California’s SB 1383 enforces escalating fines, pushing municipalities to subsidize disposers' retrofits for low-income multifamily units. Industrial parks in Texas and Arizona negotiate sewer-rate discounts for verified disposer effluent routed to biogas partners, translating regulations into direct OPEX savings. Analysts tracking state-level legislative calendars expect five additional U.S. states to introduce partial organics bans by 2027, extending the compliance-driven adoption cycle. Similar momentum is evident in Australia, where the National Food Waste Strategy Action Plan 2026 drafts diverted-tonnage targets that explicitly name disposers among acceptable on-site technologies.
Proliferation of Zero-Waste Certification Programs in Food-Service Chains
The hospitality sector views third-party certification as competitive currency. SCS-110 v4.0 extends zero-waste auditing to events and projects, prompting chain-wide retrofit mandates across quick-service restaurants [3]. Starbucks’ 2024 pledge under the U.S. Food Waste Pact sets a precedent for peers racing to memorialize diversion achievements. Disposers simplify audit workflows by providing digital logs of processed tonnage, replacing manual bin-weighing. Corporate sustainability officers highlight these logs in ESG disclosures, reinforcing board-level support for ongoing upgrades. As GHG-linked performance bonuses proliferate, disposer adoption becomes both an operational and financial imperative.
Emergence of Smart, IoT-Enabled Premium Disposers
Whirlpool’s InSinkErator MultiGrind platform garnered a 2025 Fortune innovation award for integrating accelerometers that detect vibration anomalies and trigger self-clearing reversals. Firmware updates delivered over Wi-Fi fine-tune torque curves based on aggregated usage patterns across thousands of units, embodying the shift toward continuous product-as-a-service. Predictive maintenance scheduling shaves field-service visits, decreasing downtime for high-throughput commissaries. Homeowners benefit from push notifications that advise optimal water flow, reducing environmental impact. These new capabilities anchor premium price tiers and cement brand loyalty in the increasingly data-centric food waste disposers market.
Restraints Impact Analysis of Food Waste Disposers Market*
| Restraint | % Impact on CAGR Forecast | Geographic Relevance | Impact Timeline |
|---|---|---|---|
| Plumbing-code bans & building-level restrictions | -0.8% | Select municipalities globally, concentrated in older urban areas | Long term (≥ 4 years) |
| Water-use / septic compatibility concerns among homeowners | -0.6% | Rural North America, emerging markets with limited infrastructure | Medium term (2-4 years) |
| Rapid urban compost-collection roll-outs cannibalising demand | -0.4% | Urban centers in developed markets | Short term (≤ 2 years) |
| Stainless-steel & rare-earth price volatility pressuring BOM costs | -0.3% | Global manufacturing, concentrated impact on premium segments | Short term (≤ 2 years) |
| Source: Mordor Intelligence | |||
Plumbing-Code Bans & Building-Level Restrictions
Section 416 of the 2021 International Plumbing Code stipulates indirect drainage and specific trap arm geometry for disposers, complicating upgrades in pre-1970 high-rises. New York statutes reinforce indirect waste-pipe requirements, driving up retrofit costs for brownstone conversions. Boston’s Back Bay still restricts disposers due to undersized sewer laterals that risk surcharge during storm events. Manufacturers address these zones through low-flow, batch-feed units but concede slower adoption curves. Regulatory advocacy committees are pushing pilot studies that show negligible hydraulic load increases when grinders operate within revised water-usage standards, yet code changes move slowly.
Water-Use / Septic Compatibility Concerns Among Homeowners
In rural North America, septic drain fields designed decades ago can fail under incremental hydraulic loads, heightening homeowner anxiety. Field trials in Ontario reveal that proper enzyme dosing and tank pumping schedules accommodate disposer inflow without compromising effluent clarity, but myths persist. Awareness campaigns led by county health departments are beginning to show impact, with webinar attendance topping 2,000 participants in 2024. Still, negative perceptions limit the food waste disposers market in off-grid communities and emerging economies where sanitation infrastructure lags. Vendors respond with dual-mode appliances offering dehydration cycles for septic settings, but uptake remains incremental.
*Our forecasts treat driver/restraint impacts as directional, not additive. The impact forecasts reflect baseline growth, mix effects, and variable interactions.
Food Waste Disposers Market Segment Analysis
By Product Type:
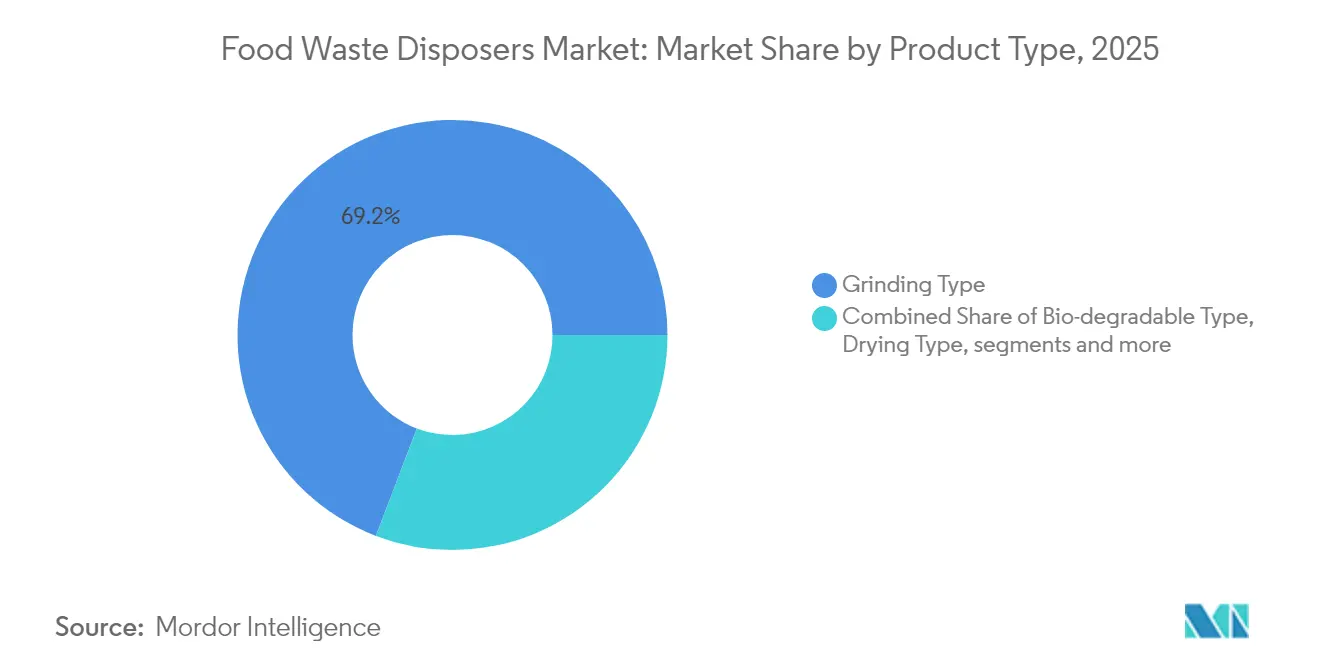
Grinding Dominance Faces Bio-Degradable DisruptionIn 2025, grinding disposers accounted for 69.20% of the market revenue, driven by their longstanding recognition in building codes and widespread consumer trust. The introduction of advanced four-stage cutting technology has significantly reduced particle sizes, streamlining sewer transport processes, and addressing utility concerns. These disposers continue to dominate due to their established infrastructure compatibility and operational efficiency. In contrast, biodegradable presses, which compress food scraps into odorless pucks, are experiencing a robust 7.32% CAGR, reflecting growing demand for sustainable waste management solutions. Their compostable outputs align with zero-waste initiatives, making them increasingly popular in high-standard certifications such as LEED Platinum projects.
Emerging start-ups are capitalizing on this segment by developing odor-adsorption substrates that extend cartridge lifespans to 90 days, reducing the frequency of filter replacements and enhancing user convenience. Established grinding disposer manufacturers are responding by introducing enzyme-based cartridges that pre-treat waste slurry, optimizing its suitability for digesters, and maintaining their competitive edge. The market is expected to evolve toward multi-modal hybrid devices capable of switching between grinding and dehydrating functions to comply with varying local regulations. This adaptability not only protects customer investments but also extends product lifecycles, ensuring sustained vendor relevance. Such innovations are likely to reinforce vendor lock-in by addressing diverse regulatory requirements and enhancing operational flexibility.

By Feed Type:
Continuous Systems Drive Operational EfficiencyIn 2025, continuous-feed models accounted for 54.40% of the revenue, driven by their capability to ensure uninterrupted processing, which enables quick-service restaurants to meet stringent sanitation timeframes. The operational efficiency of these models aligns with the fast-paced requirements of the foodservice industry, making them a preferred choice. On the other hand, batch-feed units are projected to grow at a 6.52% CAGR, primarily due to their enhanced safety features. These units are particularly favored in environments like schools and elder-care facilities, where lid-based activation mechanisms mitigate the risk of accidental operation. The contrasting growth trajectories of these feed types highlight the varying priorities of end-users, ranging from operational speed to safety considerations.
Technological advancements, such as enhanced interlocks capable of detecting metal cutlery, have significantly improved product reliability by reducing jam incidents by one-third. Retailers are increasingly adopting augmented-reality demonstrations to address consumer concerns about under-sink clearance, thereby simplifying the decision-making process. This strategic use of technology not only educates consumers but also reduces perceived installation complexities, fostering greater adoption. Feed-type segmentation reflects a nuanced understanding of factors such as operational risk tolerance, energy tariff structures, and compliance with local plumbing codes. Manufacturers are optimizing their production processes by utilizing modular motor housings compatible with both feed mechanisms, which helps streamline inventory management and reduce lead times.
By Daily Processing Capacity:
Mid-Range Dominance Reflects Market MaturityIn 2025, mid-range units within the 75-400 kg range generated 64.30% of the market's revenue, reflecting their dominant position in the segment. These units are forecasted to expand at a CAGR of 6.85% through 2031, driven by their compatibility with standard 90 mm sink flanges, which minimizes the need for costly counter modifications during retrofitting. The integration of six-kilowatt motors with gear-drive reducers enhances operational efficiency by increasing blade dwell time, enabling effective processing of fibrous materials without blockages. This segment's growth is further supported by its ability to meet the specific requirements of retrofit crews, who prioritize ease of installation and performance reliability. As a result, mid-range units continue to solidify their role as a preferred choice in the food waste disposers market.
Smaller units (≤ 50 kg) remain prevalent in single-family homes, but their growth potential is constrained by market saturation in developed economies. In contrast, ultra-large systems (≥ 500 kg) cater to niche industrial and institutional applications, such as naval galleys and amusement parks, where centralized slurry recovery systems justify higher capital investments. The introduction of cascaded mid-range units operating in parallel offers a cost-effective alternative to larger industrial models by providing redundancy and simplifying maintenance processes. Lifecycle-cost calculators, now integrated into OEM quoting tools, increasingly default to mid-range units for most applications, reinforcing their market leadership. These advancements highlight the strategic importance of mid-range systems in addressing diverse operational needs while maintaining cost efficiency.

By Operation:
Electric Systems Leverage Infrastructure MaturityIn 2025, electric-drive disposers accounted for 64.20% of the revenue share, driven by the reliability of power grids in developed economies. The adoption of permanent-magnet motors, which achieve a 0.95 power factor, has significantly reduced reactive power penalties, optimizing commercial utility expenses. Variable-frequency drives have further enhanced operational efficiency by managing inrush currents, enabling the integration of disposers and dishwashers on 20-amp circuits without requiring costly panel upgrades. These advancements underscore the growing preference for electric-drive systems in markets with stable infrastructure. The combination of technological innovation and infrastructure reliability continues to position electric-drive disposers as a leading choice in the market.
Manual crank and hydraulic drives maintain relevance in niche applications such as off-grid resorts, disaster-response kitchens, and regions with inconsistent power supply, particularly in emerging markets. Hybrid hydro-mechanical units, which leverage pressurized water jets to amplify torque, provide a viable alternative by reducing electrical consumption by 24%. However, these systems face operational challenges, including higher maintenance requirements due to nozzle scaling in areas with hard water. Despite these limitations, hybrid units cater to specific market needs where electricity access is limited or unreliable. The ongoing trends in global electrification and decreasing motor costs are expected to sustain the competitive advantage of electric systems, while tailored innovations will ensure market segmentation remains adaptable.
By End User:
Commercial Leadership Faces Residential AccelerationIn 2025, commercial venues contributed 74.10% of the total revenue, underscoring the impact of high waste density and stringent regulatory requirements in food-service operations. The rapid growth of ghost kitchens, a niche yet expanding subsegment, is driving the adoption of disposers as landlords enforce restrictions on organic bin storage to mitigate pest issues. Institutions such as schools, prisons, and hospitals are adopting batch-feed disposers, prioritizing safety while maintaining operational efficiency. This preference highlights the balance these institutions seek between compliance with safety standards and throughput optimization. The commercial segment's dominance reflects its critical role in addressing waste management challenges in high-density environments.
Residential demand is witnessing robust growth, supported by a 6.75% CAGR, as smart kitchen remodeling trends gain traction among homeowners. Homebuilders are increasingly integrating disposers into sustainability-focused packages, targeting eco-conscious millennials entering the housing market. This demographic shift is driving the adoption of disposers as a standard feature in modern, environmentally friendly homes. Over the long term, the market is expected to transition toward a 65/35 revenue split between commercial and residential segments, signaling a gradual diversification of the market base. While commercial applications will remain significant, the growing residential adoption will contribute to a more balanced and sustainable growth trajectory for the food waste disposers market.

By Distribution Channel:
B2B Dominance Reflects Commercial FocusIn 2025, B2B factory-direct contracts accounted for 67.25% of shipments, driven by the specific requirements of commercial kitchens for site surveys, customized flange fabrication, and preventive maintenance guarantees. These contracts enable OEMs to secure consistent parts revenue and maintain stable cash flow through multiyear service agreements. The demand for tailored solutions highlights the critical role of direct engagement in addressing the operational needs of commercial kitchens. This approach ensures a reliable supply chain while fostering long-term partnerships between OEMs and their clients. The factory-direct model remains a cornerstone strategy in meeting the specialized demands of the food waste disposers market.
Online D2C portals are expanding at a CAGR of 8.05%, as consumers increasingly trust configurators to select horsepower, sound-shielding, and sink-mount kits. The convenience of e-commerce reduces search costs and enhances customer experience by offering detailed installation tutorials, which in turn minimizes reliance on professional plumbers. Big-box retailers continue to capture a share of casual replacement purchases, although their growth rate lags behind that of online channels. Professional installer networks, in collaboration with OEMs, facilitate same-day drop shipments, reducing lead times and safeguarding profit margins. This diversified channel strategy ensures broad market coverage while preserving the integrity of factory-direct relationships, a critical factor in the concentrated food waste disposers market.
Geography Analysis
North America Food Waste Disposers Market
In 2025, North America contributed 37.45% to the total revenue, reflecting its significant market share. The Canadian market exhibits a mixed adoption pattern, with Metro Vancouver banning disposers due to concerns over pipe capacity. In contrast, Toronto is actively piloting an in-sink disposal program for high-rise condominiums, scheduled for implementation in 2025. Mexico's updated solid-waste regulation, NOM-251, introduces stringent hygienic disposal requirements for food processors. This regulatory change is expected to drive early-stage growth in the region by promoting compliance and innovation in waste management practices.
APAC Food Waste Disposers Market
Asia-Pacific is the fastest-rising region, logging a 7.05% CAGR toward 2031. China’s November 2024 Anti-Food Waste Action Plan seeks to trim grain losses below OECD averages by 2027, sparking subsidies for hotel disposer installations in Beijing and Guangzhou. Shanghai’s Pudong district allows property-tax rebates for commercial buildings that send disposer slurry to the Laogang biogas park. India, grappling with 78.2 million tonnes of annual food waste, positions disposers within its Smart Cities Mission to modernize sanitation . Bengaluru amends building codes to award floor-area-ratio bonuses for large complexes installing on-site grinder-fed digesters. Southeast Asia follows a tourism-led pathway; Singapore’s hawker-centre pilot ties disposers to small-scale digesters to hit 2025 waste-cut targets.
Europe Food Waste Disposers Market
Europe maintains mid-single-digit expansion anchored by the EU Circular Economy Action Plan’s mandate for separate biowaste collection by 2025. Germany’s phosphorus-recovery regulations complicate grinder rollout, yet utility Emschergenossenschaft opened a three-year study on nutrient-loop impacts. Nordic uptake remains modest; Stockholm’s preference for vacuum tubes competes with disposers, but a 2025 city-funded LCA comparison may reopen the debate. Eastern-European markets show early promise, as Poland channels EU cohesion funds into wastewater-digester upgrades that welcome high-BOD inflows.
South America and MEA Food Waste Disposers Market
South America and Middle East & Africa are smaller today but feature growth pockets tied to hospitality construction and resource-conservation agendas. Chile’s Santiago concession agreements now incorporate renewable natural-gas quotas met via disposer-fed digesters. Brazil’s São Paulo ordinance 17.471/2024 incentivizes in-sink technologies in school kitchens to combat trash-truck strikes. Saudi Arabia’s Red Sea tourism megaproject specifies premium disposers across 50 planned hotels, signalling region-wide adoption potential. Water-scarce Gulf states will likely bundle grinders with greywater-recycling systems to close resource loops.
Value Chain Analysis
Upstream, materials such as stainless steel, engineered plastics for grinding chambers and housings, permanent-magnet motors, bearings, seals, electronics (sensors and connectivity modules), and acoustic insulation form the core supply base. Component manufacturing and sub-assembly (motor/drive, impeller and cutter stacks, chamber and mount kits) are widely sourced across Asian hubs, supporting OEM/ODM assembly and export programs. Product differentiation now centers on integrated electronics for torque management, anti-jam algorithms, and IoT telemetry, plus hygiene or odor-control add-ons that broaden the supplier ecosystem into firmware, connectivity, and specialty materials.
Downstream, channels split between B2B factory-direct programs for commercial kitchens (often with installation surveys, service contracts, and spare-parts logistics) and B2C retail/remodel demand. Installer networks (plumbers, kitchen remodelers, and facility-maintenance contractors) are key intermediaries because correct mounting, trap geometry, and grease management impact performance and compliance. End-use integration extends beyond the sink to municipal wastewater and organics infrastructure, where local rules on liquid trade waste can constrain commercial discharge and push sites toward pre-treatment (for example, grease arrestors) or alternative handling routes; this creates a bifurcated go-to-market strategy between residential-friendly SKUs and commercial systems engineered for stricter discharge controls.
Competitive Landscape
The food waste disposers market is highly consolidated; the top five players command the majority of the revenue. In 2024, Whirlpool's acquisition of InSinkErator strengthened its portfolio with advanced features, including multistage cutting, anti-jam algorithms, and vibration damping. Concurrently, Emerson retained ownership of specific sensor intellectual properties, leveraging licensing agreements to maintain a strategic presence in the technology domain. Salvajor doubles down on commercial IoT telemetry through its 2025 Guardian Gateway, connecting grinders to building-management systems for alert scheduling. Hobart leverages dish-room dominance to cross-sell disposers bundled with warewashing stations, shielding share from upstarts.
Innovation pipelines focus on water savings, noise suppression, and cloud-connected diagnostics. Patent litigation remains a strategic lever; 2024 U.S. district suits over splash-guard geometry resulted in preliminary injunctions against two low-cost importers, tightening market gatekeeping. Aftermarket ecosystems also matter: Whirlpool’s 24-hour part-fulfillment rate exceeds 98%, a hurdle that smaller players struggle to match. With water utilities nudging toward volume-based sewer charges, suppliers that integrate effluent-metering sensors may carve out fresh differentiation. Overall, incumbents combine brand equity, service networks, and regulatory lobbying to fortify their lead in the food waste disposers market.
Food Waste Disposers Industry Leaders
-
Emerson Electric (Co.) – InSinkErator
-
Moen Incorporated
-
Anaheim Mfg. – Waste King
-
Franke Holding AG
-
Whirlpool (KitchenAid)
- *Disclaimer: Major Players sorted in no particular order
Food Waste Disposers Market Companies Covered in this Report
- Emerson Electric (Co.) – InSinkErator
- Moen Incorporated
- Anaheim Mfg. – Waste King
- Franke Holding AG
- Whirlpool (KitchenAid)
- Haier (GE Appliances)
- Hobart (ITW)
- Joneca Corporation
- Teka Group
- Miele & Cie. KG
- Electrolux AB
- Salvajor Company
- Flanders Electric
- Sharp Crusher
- BinCrusher
- Becbas
- Hindware Appliances
- Seiko Commercial
- Xiaomi (Mijia)
- Bort
Market Opportunities and Future Outlook
Opportunities are expanding where source-separation rules and organics diversion programs convert waste management into an auditable, technology-enabled workflow. The EU Circular Economy Action Plan requires separate biowaste collection by 2025, and UK and Scottish waste separation actions push kitchens and facilities to consider on-site processing alongside collection, creating whitespace for disposer-plus-telemetry solutions that simplify reporting. Commercial environments with certification and ESG disclosure pressure benefit from connected grinders that generate diversion logs, and the market is also seeing adjacent categories (drying and hybrid processing) increase competitive intensity, reinforcing demand for clearer hygiene, automation, and water-use value propositions.
Product-led differentiation is moving beyond grinding power into hygiene, automation, and integration with broader circular infrastructure. In March 2026, InSinkErator introduced LEDefense with 405 nm antimicrobial light technology in collaboration with Vyv, highlighting a premium path centered on odor and cleanliness outcomes rather than purely mechanical specs. Infrastructure buildout adds another lever: Divert opened a 66,000-square-foot Integrated Diversion and Energy Facility in Longview, Washington (100,000 tons per year capacity) in April 2026 and also announced Mitsubishi-led Series C financing to scale circular food infrastructure, strengthening the downstream recovery pathway that makes disposer slurry and food waste streams more economically actionable. Partnerships that tie technology providers to large facility operators, such as Mill Industries and Compass Group North America (announced April 2026), further validate bundled equipment, service, and data models that can shape procurement in high-throughput foodservice accounts.
Recent Industry Developments in Food Waste Disposers Market
- April 2026: Divert opened a 66,000-square-foot Integrated Diversion and Energy Facility in Longview, Washington (100,000 tons per year capacity). The project strengthens the downstream recovery pathway by enabling larger-scale diversion-ready streams that align with municipal and facility waste-management programs.
- April 2026: Mitsubishi-led Series C financing to scale circular food infrastructure was announced, supporting expansion of projects that scale on-site diversion and waste-to-resource workflows. The funding broadens the economics of disposer plus telemetry solutions for large enterprise sites and accelerates deployment of data-driven waste management at scale.
- March 2026: InSinkErator launched LEDefense with Vyv 405 nm antimicrobial light technology to address odor-causing bacteria around the disposal area, signaling a shift toward hygiene and premium features in kitchen waste systems.
Food Waste Disposers Market Report Scope and Research Methodology
Market Definition and Coverage
This market covers food waste disposer units and related attachments sold for managing food scraps at the point of use, mainly in kitchens across homes and commercial sites. The sizing is reported in revenue terms, based on the sale of disposer equipment within the covered geographies.
Scope exclusions: We exclude municipal collection services, offsite composting or anaerobic digestion operations, and general plumbing repair services that are not linked to a disposer sale.
Segments Covered in This Report
- By Product Type
- Bio-degradable Type
- Drying Type
- Regrigerate/Cold Type
- Grinding Type
- By Feed Type
- Continuous Feed
- Batch Feed
- By Daily Processing Capacity
- Upto 50 Kg
- 75 to 400 Kg
- 500 to 1000 Kg
- Above 1000 Kg
- By Operation
- Manual
- Electric
- By End User
- Residential
- Commercial
- HoReCa
- Institutional (Schools, Hospitals, Office Canteens)
- Housing Societies
- Government (Municipal Wards, Defence, etc.)
- By Distribution Channel
- B2C/Retail Channels
- Home-Improvement Stores
- Specialty Appliance Stores
- Online
- Other Distribution Channels
- B2B/Directly from the Manufacturers
- B2C/Retail Channels
- By Geography
- North America
- United States
- Canada
- Mexico
- South America
- Brazil
- Peru
- Chile
- Argentina
- Rest of South America
- Europe
- United Kingdom
- Germany
- France
- Spain
- Italy
- BENELUX (Belgium, Netherlands, Luxembourg)
- NORDICS (Denmark, Finland, Iceland, Norway, Sweden)
- Rest of Europe
- Asia-Pacific
- India
- China
- Japan
- Australia
- South Korea
- South-East Asia (Singapore, Malaysia, Thailand, Indonesia, Vietnam, Philippines)
- Rest of Asia-Pacific
- Middle East and Africa
- United Arab Emirates
- Saudi Arabia
- South Africa
- Nigeria
- Rest of Middle East and Africa
- North America
Data Sources, Market Sizing, and Validation
Desk Research
Desk work started by grounding the model in public signals that explain where and why disposer demand exists. We used sources such as US EPA food waste and organics guidance, state level policy pages like California SB 1383 documentation, and local building or plumbing code references that affect installation. To size the broader addressable base, we reviewed housing stock and household counts from sources such as the US Census Bureau, and then used urbanization and household indicators from sources such as the World Bank.
To keep assumptions grounded, we also reviewed trade and manufacturing signals from sources such as UN Comtrade for relevant appliance trade flows, and standards and safety references from sources such as NSF or UL listings to interpret typical product requirements. Company annual reports, investor decks, and reputed press were used to understand channel mix and pricing direction. In addition, we referenced paid subscriptions for company financials and intelligence, shipment level import and export checks, and patent databases to sense product refresh cycles. These examples are not exhaustive, and other sources were also reviewed to support data collection, validation, and clarification.
Primary Interviews and Surveys
Primary work focused on turning broad indicators into usable sizing inputs, including adoption levels by end user, typical replacement cycles, and the price ladder across basic and premium models. We spoke with a mix of manufacturers, distributors, installers, commercial kitchen operators, and waste management focused stakeholders, then reconciled differences by geography so the demand story stays consistent across major regions.
Distribution of primary research fieldwork respondents
| Company type | Respondent position | Region |
|---|---|---|
| Top tier: 35% | CXOs: 12% | APAC: 50% |
| Mid tier: 45% | Functional/Unit leaders: 38% | EMEA: 30% |
| Smaller Players: 20% | Managers: 50% | Americas: 20% |
Market-Sizing & Forecasting
The core build uses a top-down approach where the demand pool is reconstructed from the installed base and new installation potential across households and commercial kitchens, then translated into annual unit demand using replacement and penetration assumptions. Those totals are converted to value using average selling prices that change by region and by end user. To keep the outcome anchored, we also ran selective bottom-up approximations using supplier revenue cues, sampled price checks across channels, and a units times ASP cross-check for a few key countries, which helped adjust the final totals where gaps appeared.
Key inputs included housing stock growth, the share of homes with compatible plumbing and kitchen layouts, commercial kitchen density (hotels, institutional kitchens, and restaurants), typical disposer replacement cycles, and the ASP spread between entry and premium models. We also tracked policy intensity around organic waste diversion, because it shifts commercial adoption more than residential in many markets. For forecasting, scenario analysis was used with base, conservative, and accelerated paths linked to housing completions, renovation activity, policy enforcement pace, and the expected direction of pricing. Where bottom-up cues were incomplete in smaller countries, interpolation was done using comparable penetration and income bands, followed by a final expert check before locking assumptions.
Data Validation & Update Cycle
Validation was handled through repeated cross-checks, not a single pass. We compared model outputs against independent signals such as housing and commercial foodservice growth, trade movement consistency, and whether price trends aligned with channel feedback. If a country showed an unusual jump or dip, the drivers were reviewed, assumptions were revisited, and experts were re-contacted when the variance could not be explained cleanly.
Before sign-off, the workbook goes through a multi-step analyst review so calculation logic, currency treatment, and year mappings stay consistent. Reports are refreshed annually, and interim updates are made when material events occur, such as a major regulation change or a noticeable demand shift. Right before delivery, an analyst runs a final check so the latest public and interview signals are reflected in the final numbers.
Mordor Intelligence's Food Waste Disposers Market Sizing Compared With Other Published Estimates
Published market sizes for food waste disposers can look far apart even when all studies aim to measure similar demand. The biggest reasons usually come from what gets counted as a disposer, which end users are emphasized, how prices are averaged, and whether the base year and exchange rates are aligned.
The table also shows that differences often trace back to scope and modeling choices that are easy to miss in headline numbers. Some estimates widen the definition to include adjacent food waste equipment types or they lean more heavily on long-range growth assumptions through the forecast window. Others use a single global ASP progression that does not fully reflect the regional shift between commercial and residential demand.
Benchmark comparison
| Source | Market Size | Gaps in Research Methodology |
|---|---|---|
| Mordor Intelligence | USD 3.71 B (2026) | |
| Global Consultancy A | USD 3.11 B (2025) | Uses an earlier base year and can blend a broader set of application buckets, which tends to shift ASP averaging and the commercial versus residential mix when rolled into one global total. |
| Industry Publisher B | USD 2.89 B (2024) | Centers the model on a different starting year and includes an industrial application layer, which can pull in equipment categories that behave differently from in-kitchen disposer demand. |
The spread across figures is mainly explained by base-year alignment, how end users are weighted, and whether adjacent equipment is pulled into the same bucket. The table points to this timing and scope effect clearly, and in Mordor Intelligence's model the value is counted for disposer equipment sold into residential and commercial end users, with pricing and mix built up by region rather than applied as a single global average.
Key Questions Answered in the Report
What is the 2031 forecast for the food waste disposers market?
The food waste disposers market is projected to reach USD 4.89 billion by 2031 on a 5.68% CAGR.
Which product type currently dominates?
Grinding disposers hold 69.20% revenue because multistage cutters deliver wastewater-compliant particle sizes and long-proven reliability.
Why is Asia-Pacific the fastest-growing region?
Regulatory initiatives like China’s Anti-Food Waste Action Plan and rapid food-service expansion underpin a 7.05% CAGR for Asia-Pacific.
How do landfill-diversion mandates affect adoption?
Policies such as California’s SB 1383 and New Hampshire’s organics ban force waste generators to adopt disposers or face escalating penalties.
Are disposers safe for septic systems?
Field studies show properly maintained septic tanks handle disposer effluent well, and daily water use rises by less than 1%.
What new technology drives premium pricing?
IoT-enabled disposers with cloud diagnostics, torque-adaptive motors, and WaterSense-certified impellers justify higher margins through efficiency and real-time insights.