Food Traceability Market Size and Share
Market Overview
| Study Period | 2020 - 2031 |
|---|---|
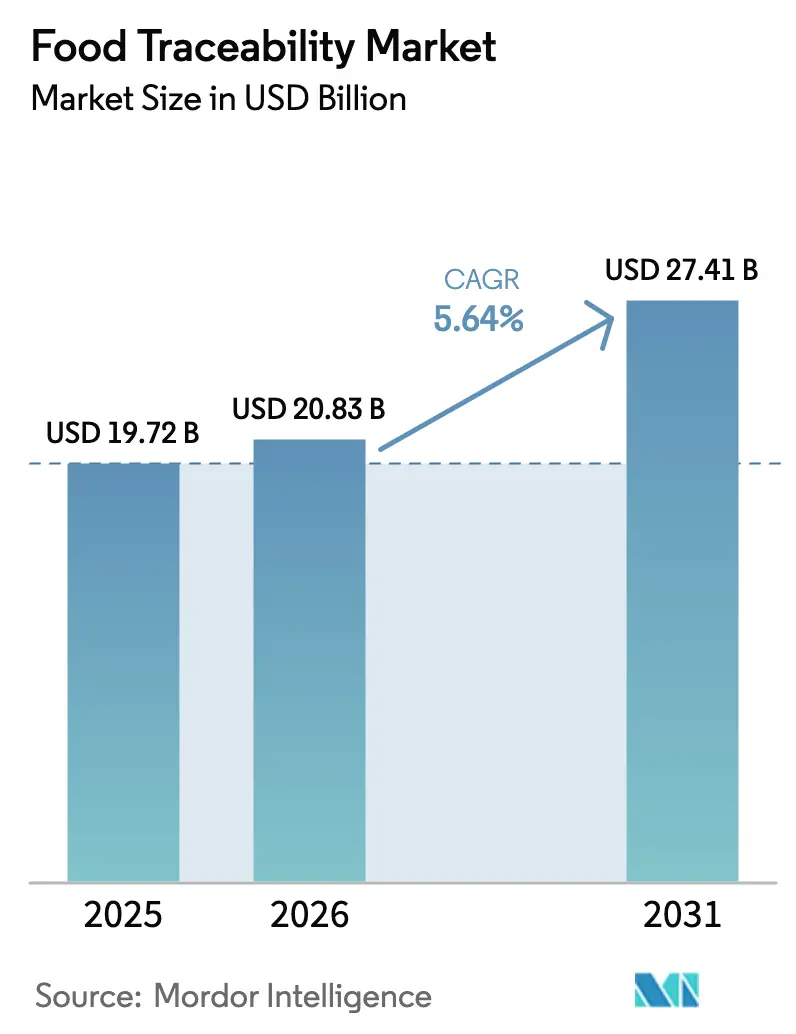
| Market Size (2026) | USD 20.83 Billion |
| Market Size (2031) | USD 27.41 Billion |
| Growth Rate (2026 - 2031) | 5.64% CAGR |
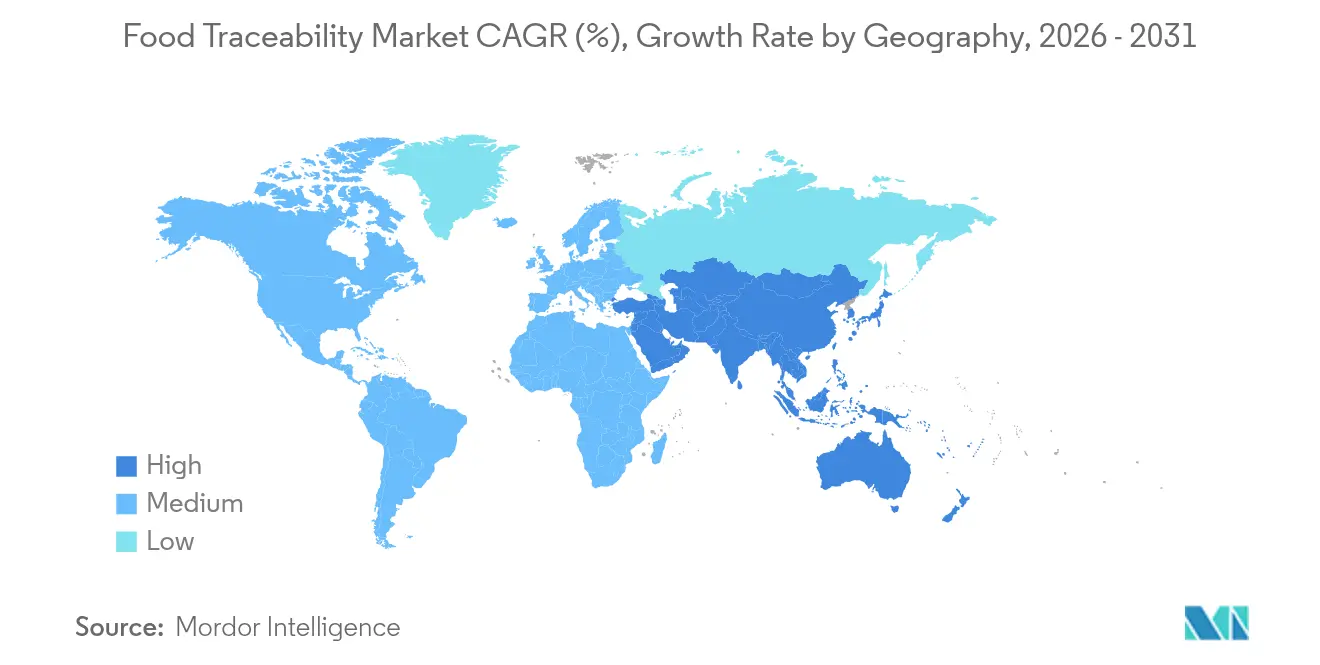
| Fastest Growing Market | Asia Pacific |
| Largest Market | North America |
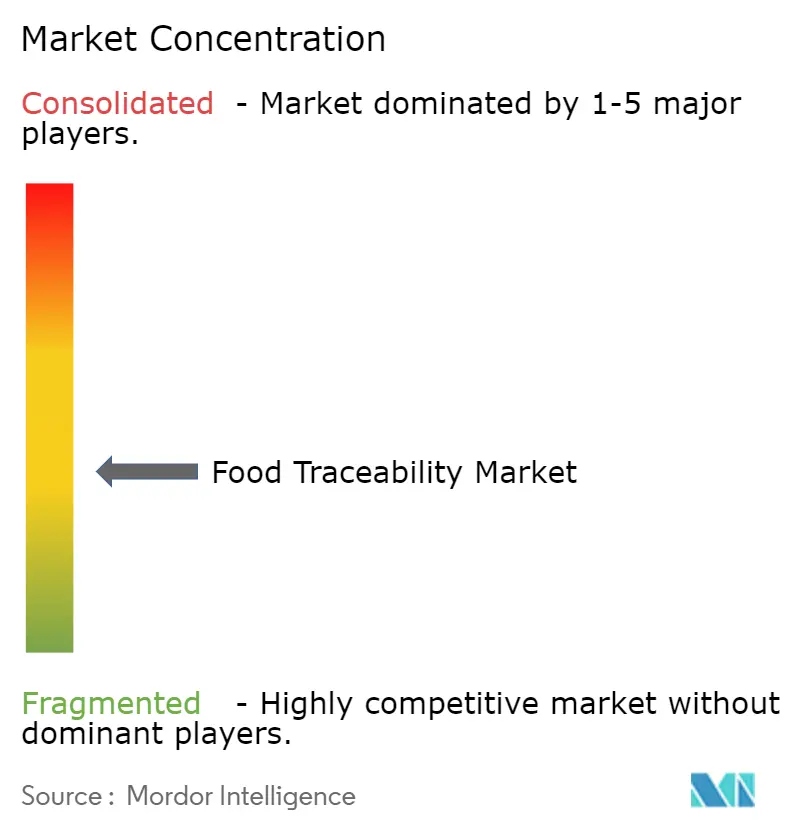
| Market Concentration | Medium |
Major Players *Disclaimer: Major Players sorted in no particular order Image © Mordor Intelligence. Reuse requires attribution under CC BY 4.0. | |
Food Traceability Market Analysis by Mordor Intelligence
The food traceability market size is expected to grow from USD 19.72 billion in 2025 to USD 20.83 billion in 2026 and is forecast to reach USD 27.41 billion by 2031 at 5.64% CAGR over 2026-2031. Regulatory deadlines in the United States and the European Union continue to accelerate digital investments, while retailers adopt transparency tools as a point-of-sale differentiator. Cloud platforms are gaining traction because they cut integration time and support multi-stakeholder data sharing, and services vendors are expanding as manufacturers seek outside expertise. Hardware demand persists but is maturing, with growth shifting to software that links data capture with analytics. Early adopters now focus on reducing waste, improving recall readiness, and deepening consumer trust rather than meeting minimum compliance alone.
Key Report Takeaways
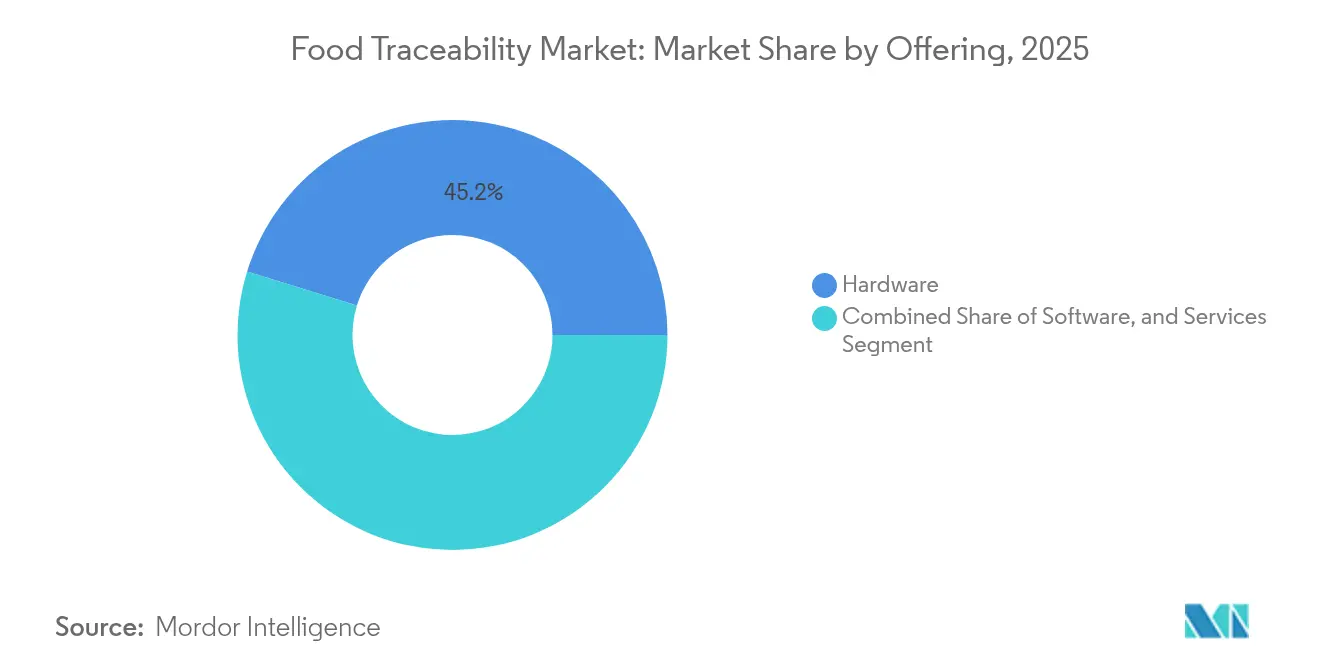
- By offering, hardware held a 45.23% revenue share of the food traceability market in 2025; services are projected to expand at a 6.69% CAGR through 2031.
- By technology, barcodes and QR codes commanded 33.85% of the food traceability market size in 2025, while blockchain is forecast to grow at 8.27% CAGR.
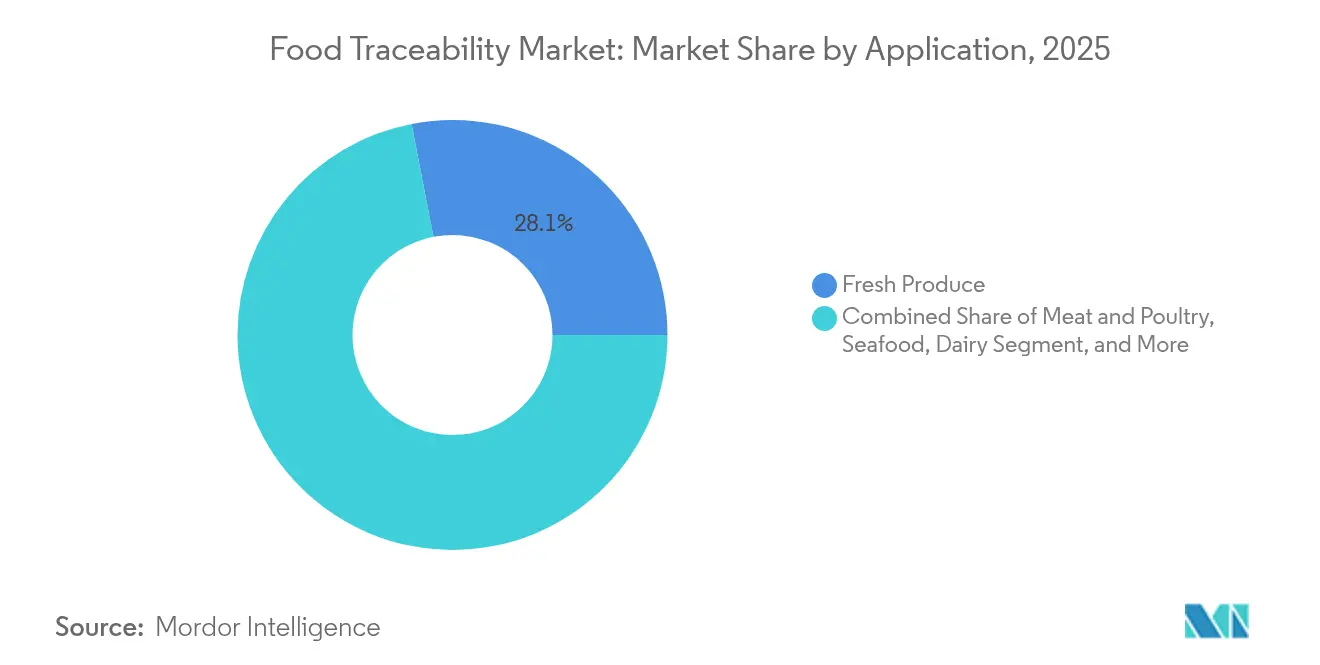
- By application, fresh produce accounted for 28.05% of the food traceability market share in 2025, whereas seafood applications are set to rise at a 7.56% CAGR to 2031.
- By end-use stage, food manufacturers and processors led with 37.98% revenue share in 2025; retail and e-commerce adoption is accelerating at a 6.98% CAGR.
- By deployment mode, on-premise platforms retained 60.35% of the food traceability market in 2025, yet cloud solutions will increase at an 8.05% CAGR.
- By geography, North America contributed 31.62% of 2025 revenue; Asia Pacific is the fastest-growing region at a 6.11% CAGR between 2026 and 2031.
Note: Market size and forecast figures in this report are generated using Mordor Intelligence’s proprietary estimation framework, updated with the latest available data and insights as of 2026.
Market Trends and Insights
Drivers Impact Analysis of Food Traceability Market*
| Driver | (~) % Impact on CAGR Forecast | Geographic Relevance | Impact Timeline |
|---|---|---|---|
| EU Digital Product Passport Mandates Driving End-to-End Traceability Investments | +1.4% | Europe, with global supply chain implications | Medium term (2-4 years) |
| U.S. FDA FSMA-204 Deadline Accelerating Adoption (2026) | +1.2% | North America, with global export implications | Medium term (2-4 years) |
| Retailer-Led Blockchain Consortia Scaling Across Asia | +0.9% | Asia Pacific, with spillover to global supply chains | Long term (≥ 4 years) |
| Premium Seafood Provenance & Sustainability Label Demand | +0.7% | Global, with concentration in developed markets | Medium term (2-4 years) |
| Real-Time Cold-Chain IoT Sensors Uptake in Oceania | +0.5% | Oceania, with expansion to global cold chains | Short term (≤ 2 years) |
| Source: Mordor Intelligence | |||
EU Digital Product Passport Mandates Driving End-to-End Traceability Investments
The upcoming Digital Product Passport demands interoperable data across product lifecycles. Although food items are presently outside its scope, retailers are applying the same rigor to private-label groceries. Suppliers that export into the European Union are therefore upgrading internal systems, boosting the food traceability market in both hardware and cloud analytics.[1]European Commission, “EU Strategy for Sustainable Textiles,” ec.europa.eu Global producers realise that shared standards lower audit costs, prompting voluntary alignment before enforcement begins. As data moves upstream, farmers and ingredient processors adopt QR and RFID tagging to keep access to European shelves.
U.S. FDA FSMA-204 Deadline Accelerating Adoption
The FDA extended the enforcement date to July 2028, but leading manufacturers view early compliance as a brand advantage. Larger firms deploy item-level tracking so that recall data can be produced within 24 hours,creating ripple effects through smaller suppliers that must connect digitally. Implementation contracts now bundle project management, sensor installation and staff training, enlarging the services segment of the food traceability market. Cloud platforms are favoured because they update regulatory fields without expensive patch cycles, reinforcing their 8.2% CAGR trajectory.[2]U.S. Food and Drug Administration, “FSMA Final Rule on Requirements for Additional Traceability Records for Certain Foods,” fda.gov
The rule mandates enhanced recordkeeping for foods on the Food Traceability List (FTL), requiring detailed tracking of Critical Tracking Events (CTEs) and Key Data Elements (KDEs) throughout the supply chain. This extension provides a strategic opportunity for companies to implement more comprehensive solutions rather than rushing minimal compliance measures. A traceability plan must be maintained, detailing procedures for record-keeping, identification of FTL foods, and assignment of TLCs. Records must be legible and available to the FDA within 24 hours upon request, with electronic records allowed. This regulation aims to enhance food safety and traceability in the supply chain.
Retailer-Led Blockchain Consortia Scaling Across Asia
Asian grocery chains are banding together to spread blockchain costs across hundreds of suppliers. These networks started with premium seafood but now cover fruit, dairy and chilled meats. IBM's Food Trust blockchain implementation has demonstrated the technology's ability to reduce product tracing time from days to seconds, creating a compelling business case beyond regulatory compliance,[3]IBM Corporation, “IBM Food Trust: Blockchain for the World’s Food Supply,” ibm.comThe time needed to confirm origin has fallen from seven days to a few seconds, materially reducing shrinkage. Network effects compound value as more stakeholders join, intensifying competition inside the food traceability market. Shared rules also help small suppliers comply with export requirements, boosting regional e-commerce credibility.
Premium Seafood Provenance & Sustainability Label Demand
Consumers are willing to pay more for verifiable line-caught tuna or farmed salmon raised under audited welfare protocols. That price premium funds satellite tags, vessel monitoring and IoT sensors that record temperature hourly along the cold chain. Immutable data tied to QR codes fosters trust among restaurants and high-end retailers, widening the audience for advanced traceability. Lessons learned in seafood often serve as templates for meat and produce, expanding the overall food traceability market.
Restraints Impact Analysis of Food Traceability Market*
| Restraint | (~) % Impact on CAGR Forecast | Geographic Relevance | Impact Timeline |
|---|---|---|---|
| Fragmented Smallholder Farming in Africa Limiting Digital Readiness | -0.8% | Africa, with implications for global importers | Long term (≥ 4 years) |
| High Upfront Cost of Serialized RFID Tags for Low-Margin Commodities | -0.6% | Global, with higher impact in developing regions | Medium term (2-4 years) |
| Interoperability Gaps Between ERP-WMS-Farm Systems in Europe | -0.4% | Europe, with global supply chain implications | Short term (≤ 2 years) |
| Data-Privacy Regulations (GDPR, PIPL) Restrict Cross-Border Trace Data | -0.3% | Global, with concentration in EU and China | Medium term (2-4 years) |
| Source: Mordor Intelligence | |||
Fragmented Smallholder Farming in Africa Limiting Digital Readiness
Most African farms operate on less than two hectares and have limited internet access. Paper workflows break digital continuity at the first mile, creating blind spots that weaken end-to-end verification. Importers demand assurance, yet passing technology costs to growers risks shrinking already thin margins. According to the United Nations Development Programme, "agriculture significantly contributes to greenhouse gas emissions and environmental degradation, making traceability crucial for identifying related challenges"[4]United Nations Development Programme, “Goal 2: Zero Hunger,” undp.orgCooperative models that pool resources could ease adoption, but progress remains slow, constraining parts of the food traceability market that rely on African raw materials.
High Upfront Cost of Serialized RFID Tags for Low-Margin Commodities
RFID labels can cost several US cents per unit, which erodes profitability for bulk grains or roots sold at low prices. Barcodes offer a cheaper path but sacrifice automated scanning and rich datasets. Until tag prices fall or shared infrastructure offsets costs, adoption will be uneven. As a result, growth in the food traceability market tilts toward premium categories where added transparency drives higher shelf prices.
*Our forecasts treat driver/restraint impacts as directional, not additive. The impact forecasts reflect baseline growth, mix effects, and variable interactions.
Food Traceability Market Segment Analysis
By Offering:
Services Strengthen Post-Implementation ValueHardware captured 45.23% of revenue, anchoring the food traceability market on data capture devices such as scanners, RFID readers and IoT sensors. That share stemmed from initial infrastructure rollouts in 2024. Growth momentum now shifts to advisory and managed services, expanding at a 6.69% CAGR as firms seek system integration, standards mapping and ongoing analytics. Analysts note that 50% of mid-sized processors budget external help for FSMA-204 alignment in 2025. Services teams increasingly sell subscription support that blends regulatory updates, performance tuning and cybersecurity. The shift protects customers from skill shortages and keeps platforms current without large capital outlays.
Software remains the connective tissue between edge devices and enterprise planning suites. Vendors embed AI modules that alert managers to predicted spoilage or inventory overstock, turning compliance data into operational insights. This value proposition widens the addressable pool of buyers beyond safety officers to supply chain and finance leaders, expanding the food traceability market. For pure hardware players, partnering with SaaS specialists helps them move up the value stack, while for manufacturers the single-vendor model reduces integration risk.


By Technology:
Blockchain Disrupts but Barcodes DominateBarcodes and QR codes held 33.85% of the food traceability market size in 2025, reflecting decades of installed scanners at pack-houses and retail tills. Their low cost underpins mass adoption across fresh produce and packaged goods. Meanwhile, blockchain platforms lead growth at 8.27% CAGR by enabling permissioned data sharing across competitors without central ownership. Early pilots in leafy greens and mangos proved that distributed ledgers can cut traceback time to seconds. Larger retailers now insist suppliers join consortium blockchains to stay on shelves, making participation almost mandatory.
RFID continues to attract investment where automated portals speed pallet movements and improve inventory accuracy. Combining RFID with temperature or humidity sensors bridges safety and quality use cases, vital for seafood and dairy exporters. For high-value SKUs such as premium spice blends, biometric authentication is emerging to combat fraud, broadening technology choice within the food traceability market. Although costs vary, hardware advances and bulk chip production are steadily narrowing the price gap.
By Mode of Deployment:
Cloud Platforms Gain Strategic PreferenceOn-premise deployments held 60.35% share, yet cloud-based solutions are forecast to expand at an 8.05% CAGR because they shorten rollout cycles and align with multi-enterprise workflows. Food manufacturers with large legacy ERP estates often start with a hybrid model that synchronises plant-floor historians to cloud dashboards for partners and regulators. Small and medium enterprises jump straight to cloud to avoid capital outlay and IT staffing. This demand profile fuels alliances among hyperscale providers, supply chain networks and application specialists, adding scale to the food traceability industry.
Cybersecurity once deterred cloud adoption, but modern encryption, regional data centres and role-based access controls have mitigated risk perceptions. Moreover, regulators prefer electronic records that can be retrieved remotely within 24 hours, another driver that tilts budgets towards cloud. Vendors now promote low-code connectors that link farm management software, warehouse systems and e-commerce platforms, further widening ecosystem integration. Early adopters report inventory gains and faster recall execution alongside compliance, validating the payback case for cloud expansion.
By Application:
Seafood Growth Outpaces, Fresh Produce Stays CoreFresh produce retained 28.05% of the food traceability market size in 2025, underpinned by strict monitoring of leafy greens and berries that historically trigger recalls. QR labels on clamshell packs let shoppers confirm farm origin and pesticide logs, reinforcing purchase confidence. As consumer expectations normalise, suppliers shift from lot-level to item-level coding to sharpen recall precision and reduce costly over-withdrawals.
Seafood applications are increasing at a 7.56% CAGR, fuelled by vessel-to-plate storytelling and mandated catch documentation to curb illegal fishing. Cloud dashboards merge satellite AIS data with cold-chain sensor feeds, offering immutable proof of legality and freshness. Premium brands leverage these datasets to justify higher prices and secure eco-label certifications, feeding back into the food traceability market. Meat, poultry and dairy follow similar paths, yet integrate animal welfare and greenhouse-gas metrics that require additional data capture fields.
By End-Use Stage:
Retail and E-Commerce Translate Data into Shopper TrustFood manufacturers and processors commanded 37.98% of revenue, anchoring system spend at transformation hubs where ingredients blend and risk complexity peaks. Plant managers embed scanners at each critical tracking event to lock chain-of-custody granularity before items leave the factory. Many firms now apply predictive analytics that combine quality-control scores, production rates and supplier performance to pre-empt deviations.
Retail and e-commerce channels are advancing at a 6.98% CAGR, the fastest within the food traceability market. Online grocery apps integrate farm stories and carbon scores beside price to increase basket conversion, proving that transparency can lift sales. Brick-and-mortar supermarkets use interactive shelf tags or smart coolers that show origin on demand. Logistics providers upgrade warehouse management systems with temperature trace files, enabling drop-ship models that maintain data lineage through the final mile. Public agencies meanwhile expand open databases that cross-link recall alerts with supply origin, lifting baseline expectations across the food traceability industry.
Geography Analysis
North America Food Traceability Market
North America contributed 31.62% of 2025 revenue. Large processors began FSMA-204 projects well before the deadline because rapid trace data retrieval limits recall costs. Retail cooperatives prepared master data pools that smaller suppliers can join, broadening coverage. Cloud vendors partner with land-grant universities to train growers, reducing onboarding effort. As adoption rises, cold-chain IoT upgrades inside dairy and meat facilities accelerate ancillary hardware demand within the food traceability market.
APAC Food Traceability Market
Asia Pacific is projected to achieve a 6.11% CAGR, the highest regional pace. Rising urban income, growth in online grocery and frequent food safety incidents sustain policy momentum. Governments in China, Japan and Australia fund pilot grants that combine QR codes with mobile apps so that rural producers remain visible in national supply chains. Retailer blockchains pool data across seafood, fresh cut fruit and ready-to-eat meals, producing network effects that increase supplier compliance. Growing cold-chain capacity to serve cross-border e-commerce further fuels sensor and software uptake across the food traceability market.
Europe Food Traceability Market
Europe pursues advanced transparency through the Digital Product Passport, even though food products are not yet formally included. Retail groups nonetheless mirror DPP requirements for farm inputs, emissions and packaging, nudging suppliers towards granular data capture. National systems must interoperate across borders, so industry bodies publish open APIs that map farm certificates to GS1 identifiers. Sustainability objectives add urgency; companies need trace data to quantify Scope 3 emissions and circular-economy outcomes. These forces keep European investment steady, reinforcing the region’s role as a standards laboratory for the global food traceability market.

Competitive Landscape
Competition clusters around hardware makers, pure-play software firms and systems integrators. Zebra Technologies, Honeywell and Cognex defend scanning franchises while bundling cloud dashboards that create subscription revenue and hedge commodity pressure. IBM, Oracle and FoodLogiQ focus on platform depth, courting retailers who can mandate supplier onboarding. Partnerships are the dominant strategy because a single vendor rarely controls every supply-chain node.
Recent deals illustrate convergence. SGS aligned audit services with digital ledgers so that inspection records feed straight into trace vaults, cutting manual uploads. Oracle linked grocery retail back-office systems to blockchain provenance engines, letting stores reconcile shrinkage data with supplier delivery records. Such alliances heighten switching costs and tilt negotiations toward integrated solution suites, influencing procurement budgets across the food traceability market.
Fragmentation remains moderate because niche specialists supply AI analytics, sensor firmware or cold-chain packaging that incumbents lack. Start-ups secure revenue by white-labelling modules to larger brands. Meanwhile, commodity hardware pricing compresses margins, driving consolidation among smaller scanner producers. The top five vendors control roughly 40% of total sales, leaving ample room for regional players and vertical specialists to thrive and push innovation in the food traceability market
Food Traceability Industry Leaders
C.H. Robinson
Optel Group
Cognex Corporation
SGS SA
Zebra Technologies
- *Disclaimer: Major Players sorted in no particular order
Food Traceability Market Companies Covered in this Report
- Optel Group
- C.H. Robinson Worldwide Inc.
- Cognex Corporation
- SGS SA
- Zebra Technologies Corp.
- Honeywell International Inc.
- IBM Corporation
- SAP SE
- Oracle Corporation
- FoodLogiQ
- Trace One
- Merit-Trax Technologies
- Carlisle Technology
- Intertek Group PLC
- Bio-Rad Laboratories Inc.
- Avery Dennison Corporation
- Rfxcel (Antares Vision Group)
- HarvestMark (YottaMark Inc.)
- EVRYTHNG Ltd. (Digimarc)
- Kezzler AS
- Cloudleaf Inc. (ParkourSC)

Recent Industry Developments in Food Traceability Market
- May 2025: SGS partnered with technology providers to enhance food traceability through digital platforms, integrating them into SGS compliance services for the FDA FSMA-204 rule.
- April 2025: FoodLogiQ announced that major grocery retailers will implement its traceability software to comply with FSMA-204 and reduce operational complexity.
- March 2025: The FDA extended the compliance date for the Food Traceability Rule to July 20 2028, giving companies extra preparation time.
- February 2025: Oracle formed a partnership to deliver an end-to-end grocery retail traceability solution that links supply data with store operations.
- January 2025: The National Fisheries Institute and GS1 US released a new traceability implementation guide for the U.S. seafood supply chain.


Food Traceability Market Report Scope and Research Methodology
Market Definition and Coverage
Our study defines the food traceability market as every hardware, software, and service layer that records and shares the movement, transformation, and quality status of food items from farm or fishery origin through processing, storage, distribution, and final retail or food-service sale.
(Exclusion note) Solutions dedicated solely to internal warehouse inventory or pharmaceutical traceability fall outside this scope.
Segments Covered in This Report
- By Offering
- Hardware
- Software
- Services
- By Technology
- Barcodes and QR Codes
- RFID
- GPS and GNSS
- Real-Time Locating Systems (RTLS) and IoT Sensors
- Blockchain Platforms
- Biometric Authentication
- By Mode of Deployment
- Cloud-Based
- On-Premise
- By Application
- Fresh Produce
- Meat and Poultry
- Seafood
- Dairy
- Packaged and Processed Foods
- Beverages
- Other Applications (Spices, Ingredients)
- By End-Use Stage
- Food Manufacturers and Processors
- Warehouse and Logistics Providers
- Retail and E-commerce
- Foodservice and Hospitality
- Government and Regulatory Agencies
- By Geography
- North America
- United States
- Canada
- Mexico
- Europe
- Germany
- United Kingdom
- France
- Italy
- Spain
- Rest of Europe
- Asia-Pacific
- China
- Japan
- South Korea
- India
- South East Asia
- Australia
- Rest of Asia-Pacific
- South America
- Brazil
- Rest of South America
- Middle East and Africa
- Middle East
- United Arab Emirates
- Saudi Arabia
- Rest of Middle East
- Africa
- South Africa
- Rest of Africa
- Middle East
- North America
Data Sources, Market Sizing, and Validation
Primary Research
Mordor analysts interviewed equipment makers, cloud-platform providers, mid-tier food processors, large retailers, logistics integrators, and regional food-safety officials across North America, Europe, and Asia. These conversations validated secondary adoption rates, typical hardware ASPs, and the likely impact timeline of upcoming compliance deadlines.
Desk Research
We began with publicly available regulations and statistical portals, such as the FDA FSMA-204 rulebook, Eurostat food safety alerts, USDA ERS production series, and UN Comtrade trade flows, to size potential product volumes and trade corrections. Supplementary insights came from global trade associations like GS1, International Dairy Federation, and the Seafood Alliance, along with peer-reviewed journals discussing barcode and RFID uptake.
Subscription content on D&B Hoovers, Dow Jones Factiva, and Questel patents then supplied company revenue splits, news momentum, and technology pipeline clues that sharpened segment boundaries.
This list is illustrative; many additional open and proprietary sources were assessed for cross-checks and clarification.
Market-Sizing & Forecasting
A top-down reconstruction calibrated global food output, adjusted for loss rates, and applied traceability adoption shares by commodity and region. Bottom-up spot checks, supplier revenue roll-ups and sampled barcode scanner shipments, were layered in to fine-tune totals before reconciliation. Key drivers in the model include: 1) FSMA-204 implementation milestones, 2) average recall cost per incident, 3) cloud subscription price erosion, 4) scanner and RFID tag penetration in fresh produce lines, and 5) blockchain pilot conversion ratios. Multivariate regression combined with scenario analysis generates the 2025-2030 outlook while expert consensus guides variable paths. Data gaps in fragmented regions are bridged by proxy indicators such as cold-chain warehouse square footage and agri-export documentation digitization rates.
Data Validation & Update Cycle
Outputs pass variance and stress tests; then a senior analyst review panel re-evaluates anomalies. The model refreshes annually, with interim updates triggered by material regulatory or M&A events, ensuring clients always receive the latest vetted view.
How Mordor Intelligence's Food Traceability Market Size Compares to Other Published Estimates
Published estimates often differ; scope breadth, pricing logic, and refresh cadence typically drive the gaps.
External publications range from USD 16.9 billion to USD 34.4 billion for the current period, reflecting whether they fold in stand-alone logistics software or discount emerging-market adoption rates.
Benchmark comparison
| Market Size | Anonymized source | Primary gap driver |
|---|---|---|
| USD 19.72 B (2025) | Mordor Intelligence | - |
| USD 34.35 B (2025) | Global Consultancy A | Adds fleet-tracking and bespoke IT services, inflating scope |
| USD 16.89 B (2023) | Trade Journal B | Excludes blockchain pilots and applies pre-FSMA adoption ratios |
| USD 20.80 B (2025) | Industry Association C | Uses single global hardware ASP and omits small producers |
The comparison shows that by selecting a precise scope, vetting adoption inputs through first-hand interviews, and refreshing every year, Mordor Intelligence offers a balanced, transparent baseline that decision-makers can replicate and trust.


Key Questions Answered in the Report
What is driving current investment in food traceability solutions?
Regulatory deadlines, retailer transparency programs and the operational payoff from lower recall costs are the key investment triggers outlined throughout this report.
Which technology is expanding fastest within the food traceability market?
Blockchain platforms show the highest growth rate at 8.27% CAGR, thanks to their ability to provide shared, immutable data across complex supply chains.
Why are services growing faster than hardware?
Implementations now demand integration expertise, ongoing analytics and regulatory updates, causing services revenue to rise at a 6.69% CAGR while hardware growth moderates.
How does cloud deployment benefit food companies?
Cloud platforms shorten rollout time, enable cross-enterprise data sharing and offer automatic updates for evolving rules, supporting an 8.05% CAGR for cloud solutions.
Which application segment delivers the strongest growth opportunity?
Sustainable catches and regulators target illegal fishing.
What regions show the highest growth potential?
Asia Pacific is the fastest-growing geography at a 6.11% CAGR because of e-commerce expansion, government safety initiatives and widespread retailer blockchain pilots.
Page last updated on:


