
Food Authentication Testing Market Size and Share
Market Overview
| Study Period | 2021 - 2031 |
|---|---|
| Market Size (2026) | USD 1.18 Billion |
| Market Size (2031) | USD 1.68 Billion |
| Growth Rate (2026 - 2031) | 7.32% CAGR |
| Fastest Growing Market | Asia Pacific |
| Largest Market | Europe |
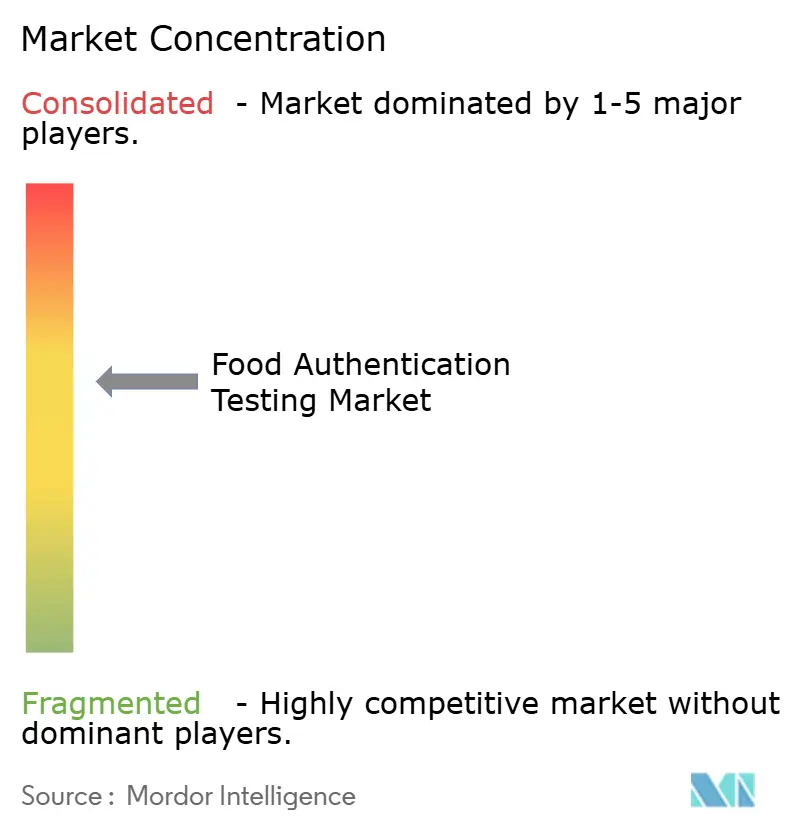
| Market Concentration | Medium |
Major Players
*Disclaimer: Major Players sorted in no particular order Image © Mordor Intelligence. Reuse requires attribution under CC BY 4.0. |
|
Food Authentication Testing Market Analysis by Mordor Intelligence
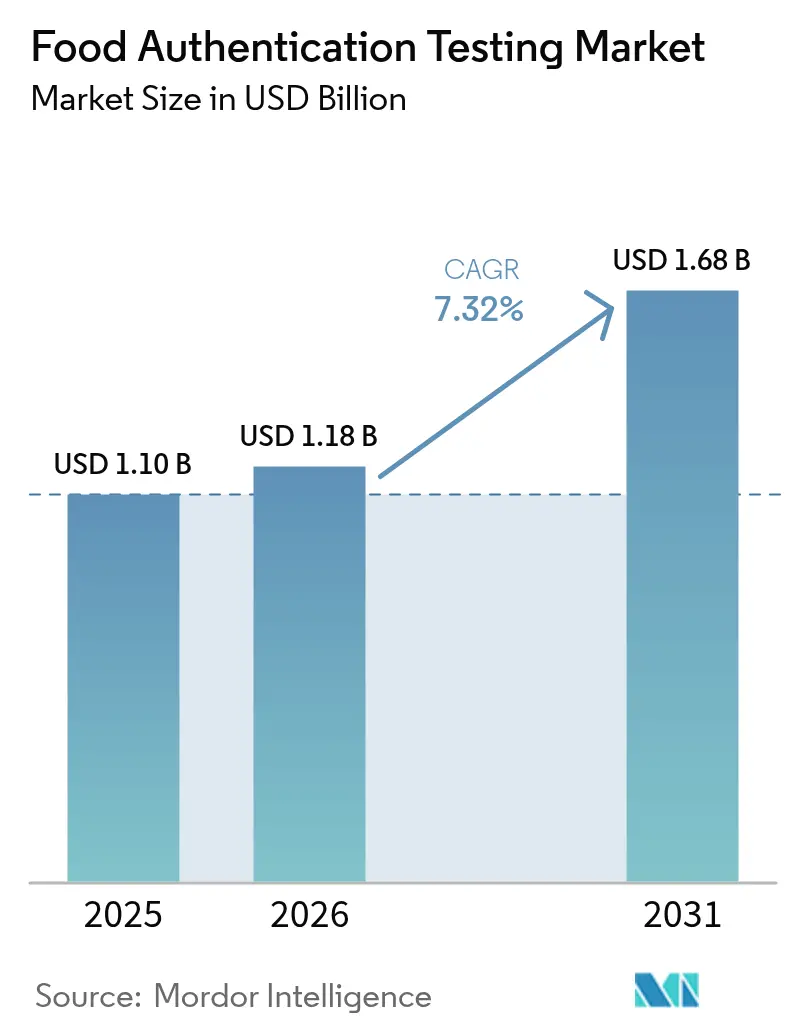
The food authentication testing market size is expected to grow from USD 1.10 billion in 2025 to USD 1.18 billion in 2026 and is forecast to reach USD 1.68 billion by 2031 at 7.32% CAGR over 2026-2031. The increasing instances of food fraud, including ingredient substitution, false claims, and incorrect labeling, have made consumers cautious about food product authenticity, particularly for specialized products like vegan, free-from, and organic foods. As a result, food manufacturers are implementing authentication testing to distinguish their products from standard offerings and gain market share. However, the market faces challenges due to the complexity of maintaining product authenticity across the supply chain. Additionally, since testing is voluntary, smaller manufacturers, especially in developing regions such as Asia-Pacific and Africa, view it as an additional expense. These cost constraints limit market growth, particularly among smaller food companies.
Key Report Takeaways
- By sample type, raw/unprocessed food held 32.10% of the food authentication testing market share in 2025, whereas processed/ready-to-eat products are on track for a 9.22% CAGR through 2031.
- By technology, PCR secured 32.70% of 2025 revenue, while next-generation sequencing leads the growth curve with a 9.35% CAGR for 2026-2031.
- By target analyte, meat and species identification captured 40.20% of the food authentication testing market share in 2025; food allergen testing posts the fastest 9.46% CAGR to 2031.
- By geography, Europe accounted for 33.70% of 2025 revenue; Asia-Pacific posts the highest 9.18% CAGR in the same outlook period.
Note: Market size and forecast figures in this report are generated using Mordor Intelligence’s proprietary estimation framework, updated with the latest available data and insights as of 2026.
Global Food Authentication Testing Market Trends and Insights
Drivers Impact Analysis*
| Driver | (~) % Impact on CAGR Forecast | Geographic Relevance | Impact Timeline |
|---|---|---|---|
| Rising incidence of food fraud and adulteration | +1.8% | Global, with concentration in Europe and North America | Short term (≤ 2 years) |
| Stringent government regulations and standards | +1.5% | Global, led by European Union, United States, and Asia-Pacific | Medium term (2-4 years) |
| Increasing consumer demand for transparency and clean labels | +1.2% | North America and Europe, expanding to Asia-Pacific | Medium term (2-4 years) |
| Growing demand for halal, kosher, organic, and vegan certification | +0.9% | Global, with strong growth in Middle East and Asia-Pacific | Long term (≥ 4 years) |
| Technological advancements in testing equipment | +1.1% | Global, concentrated in developed markets | Short term (≤ 2 years) |
| Growth in premium and niche food categories | +0.8% | North America and Europe primarily | Long term (≥ 4 years) |
| Source: Mordor Intelligence | |||
Rising Incidence of Food Fraud and Adulteration
Global notification systems recorded a tenfold increase in fraud alerts between 2020 and 2024, with olive oil, honey, and spices being the most frequently targeted products. The European Commission's Agri-Food Fraud Network enables enforcement agencies to share real-time alerts, resulting in swift confiscations and increased testing volumes [1]Source: European Commission, “The EU Agri-Food Fraud Network,” food.ec.europa.eu . The network's implementation has strengthened cross-border cooperation and improved detection rates across member states. Brand owners are increasingly submitting high-value samples for comprehensive testing. The adoption of high-resolution mass spectrometry and whole-genome sequencing continues to grow, driven by their superior accuracy and ability to detect sophisticated adulterants. Laboratories are addressing increasing sample volumes through faster analysis times, often completing tests within minutes, while portable spectrometers facilitate on-site inspections at border checkpoints. The integration of these testing methods into standard protocols has significantly improved the industry's ability to maintain product authenticity and consumer safety.
Stringent Government Regulations and Standards
Global regulatory frameworks continue to evolve, as evidenced by several key developments. The FDA's Laboratory Accreditation for Analyses of Foods program implements mandatory testing protocols for imported foods and requires specific laboratory capacity for mycotoxin testing by December 2024 [2]Source: U.S. Food and Drug Administration, “Laboratory Accreditation for Analyses of Foods (LAAF) Program & Final Rule,” fda.gov . In March 2025, China introduced 50 new national food safety standards, incorporating enhanced requirements for dairy, meat products, and microbial testing methods. The USDA's Strengthening Organic Enforcement Act, which took effect in March 2024, requires increased testing of organic raw materials and enhanced inspector training to address fraud in the USD 71.6 billion organic market. In Europe, regulations have become more specific, including new conformity checks for olive oil since July 2022 and improved analytical methods for detecting unauthorized substances. Additionally, the USDA's new voluntary labeling requirements for "Product of USA" claims, effective January 2026, will require documentation confirming that animals were born, raised, slaughtered, and processed within the United States. These regulatory changes transform food authentication from a voluntary practice to a mandatory requirement, driving market expansion.
Increasing Consumer Demand for Transparency and Clean Labels
The global food authenticity testing market continues to expand as consumers demand transparency and clean labels. The increased focus on food safety and fraud has made verification of product origins, ingredient authenticity, and processing claims necessary. Documented cases of food adulteration, including mislabeled seafood, diluted olive oil, and counterfeit honey, have required enhanced traceability and testing protocols. Food manufacturers and retailers implement analytical methods, including DNA barcoding, isotope analysis, and spectroscopy, to verify raw materials and finished products. These measures ensure brand protection and compliance with regulations. The European Union's enhanced inspection protocols for meat and dairy products identify mislabeling and unauthorized additives, supporting consumer confidence in clean-label claims. Food authenticity testing remains a critical requirement for companies to deliver the transparency demanded by consumers.
Growing Demand for Halal, Kosher, Organic, and Vegan Certification
The global halal certification market is experiencing significant growth driven by increasing Muslim populations and rising awareness of halal products, with blockchain technology enhancing transparency and consumer trust. Organic certification demands are intensifying following the implementation of the USDA's Strengthening Organic Enforcement Act, which requires increased testing of organic raw materials and better inspector training to prevent fraud. Kosher certification requirements are becoming more stringent with enhanced documentation standards and facility auditing protocols that demand comprehensive testing verification. Plant-based and vegan product authentication is creating new testing challenges, with Bio-Rad developing specialized microbiological testing protocols for plant-based meats that address unique safety risks not present in traditional animal-based products. The convergence of multiple certification requirements is creating complex testing matrices where single products must meet halal, organic, and clean-label standards simultaneously, driving demand for comprehensive authentication services.
Restraints Impact Analysis*
| Restraint | (~) % Impact on CAGR Forecast | Geographic Relevance | Impact Timeline |
|---|---|---|---|
| High cost of advanced testing technologies | -1.2% | Global, particularly affecting smaller laboratories | Short term (≤ 2 years) |
| Lack of standardization in testing protocols | -0.8% | Global, with regional variations in implementation | Medium term (2-4 years) |
| Skilled-labour shortages lengthening sample turnaround times | -1.0% | Global, concentrated in developed markets | Medium term (2-4 years) |
| Risk of false negatives from complex food matrices | -0.6% | Global, affecting all testing applications | Long term (≥ 4 years) |
| Source: Mordor Intelligence | |||
High Cost of Advanced Testing Technologies
Advanced testing equipment represents significant capital investments that constrain market expansion, with ISO/IEC 17025 accreditation proving costly and time-consuming for laboratories seeking compliance. Rising testing costs are creating economic barriers, particularly for smaller laboratories that struggle to justify investments in sophisticated instrumentation while maintaining competitive pricing. Laboratory automation systems require substantial upfront investments, with gravimetric diluters, automated plate pourers, and colony counters representing significant capital expenditures that smaller facilities cannot absorb. Method validation costs are escalating as laboratories must demonstrate compliance with multiple regulatory frameworks, including FDA 21 CFR Part 11 and EU Annex 11 requirements that demand extensive documentation and quality systems. These cost pressures are creating a two-tier market where large commercial laboratories gain competitive advantages through economies of scale while smaller facilities struggle to maintain service offerings.
Skilled-labour Shortages Lengthening Sample Turnaround Times
The food safety sector faces critical workforce shortages that threaten testing capacity, with regulatory agencies like USDA-FSIS and FDA experiencing high turnover and vacancy rates that compromise oversight capabilities. Clinical laboratories report 7.2% average vacancy rates, with the Veterans Health Administration identifying medical technologists as a critical need, while the Bureau of Labor Statistics projects 13% growth demand by 2026, according to the American Society of Clinical Laboratory Services [3]Source: American Society for Clinical Laboratory Science, "Addressing the Clinical Laboratory Workforce Shortage", ascls.org. An aging workforce compounds recruitment challenges, with limited pools of qualified candidates and lengthy training periods required for specialized food testing protocols. Insufficient staffing leads to inadequate oversight and increased likelihood of foodborne illnesses and product recalls, as facilities resort to hiring temporary staff that may compromise result quality. Educational programs struggle to keep pace with demand, creating significant gaps between graduate numbers and industry needs, while existing professionals face burnout from increased workloads. These workforce constraints are creating bottlenecks in testing capacity that limit market growth and compromise the timeliness of authentication services.
*Our forecasts treat driver/restraint impacts as directional, not additive. The impact forecasts reflect baseline growth, mix effects, and variable interactions.
Segment Analysis
By Technology: NGS Emerges as Game-Changer
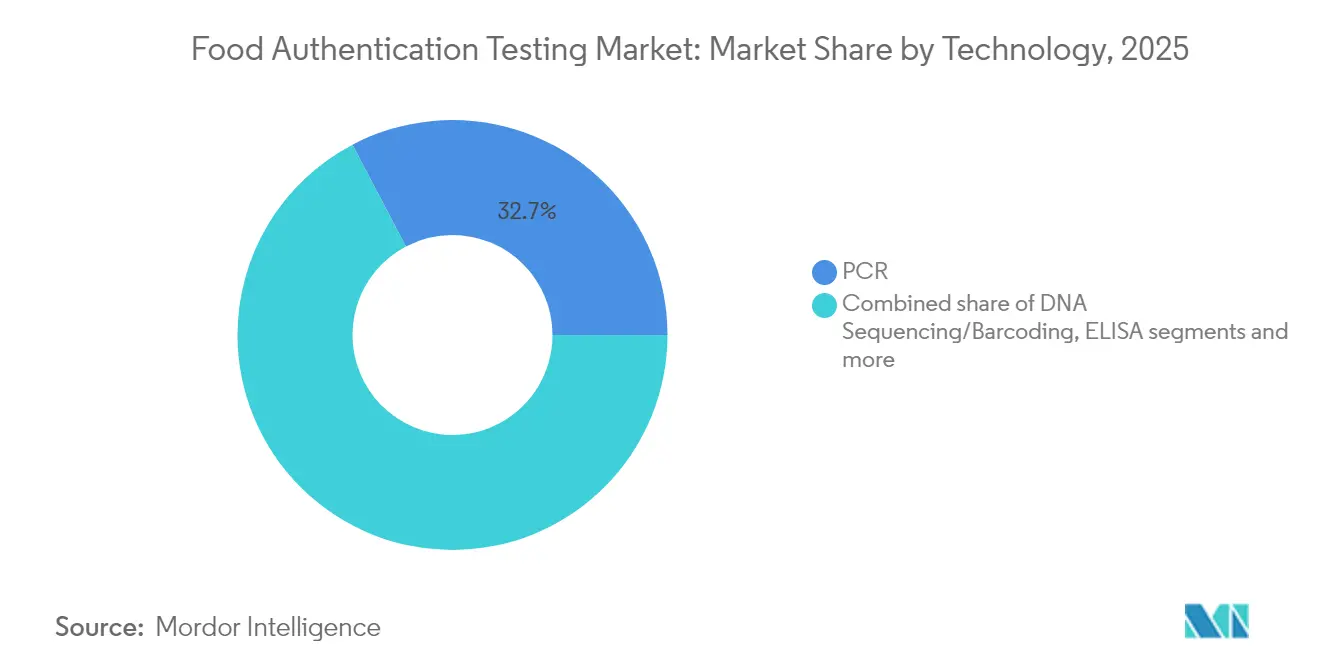
PCR technology maintains market leadership with a 32.70% share in 2025, leveraging its established reliability and regulatory acceptance across food safety applications. Next-Generation Sequencing (NGS) technology in food authenticity testing projects a CAGR of 9.35% from 2026 to 2031. NGS delivers accurate pathogen detection and species identification capabilities, supporting comprehensive verification of food product integrity. The technology's detailed ingredient analysis enables food manufacturers to validate product authenticity and ensure label compliance amid increasing food fraud concerns.
ELISA maintains steady demand for routine pathogen detection, while DNA Sequencing/Barcoding technologies gain traction for species verification applications, particularly in seafood and meat authentication. Mass Spectrometry (LC-MS/GC-MS) continues advancing with Thermo Fisher Scientific's Stellar platform delivering 10X quantitative sensitivity improvements and 5X compound analysis capacity compared to traditional systems. NMR/Molecular Spectrometry applications expand in food fingerprinting, while Other Technologies encompass emerging biosensor platforms and AI-powered detection systems.



By Sample Type: Processed Foods Drive Innovation
Raw/unprocessed food samples held a 32.10% market share in 2025, demonstrating the importance of ingredient verification at the supply chain origin. The processed/ready-to-eat foods segment is projected to grow at 9.22% CAGR from 2026-2031, due to complex food matrices and advanced adulteration methods targeting value-added products. In April 2025, the Korea Institute of Machinery and Materials introduced rapid pretreatment systems for solid biological samples, which can liquefy and homogenize samples within one minute to address processed food testing challenges.
Raw food testing requires screening single-ingredient produce or raw meat for pathogens like Salmonella, E. coli, and Listeria. The emergence of complex, multi-ingredient products, including plant-based meat alternatives, has created additional microbiological risks that require specialized testing protocols. Companies such as Bio-Rad have implemented specific testing methods to detect pathogens and contaminants in these new food formulations to meet safety and regulatory requirements. Food fraud has transitioned toward high-value, multi-component products that present verification challenges through conventional methods. These include premium products like blended oils, processed meats, and dairy substitutes, where adulteration or ingredient mislabeling remains undetected. The implementation of Next-Generation Sequencing and isotope analysis enables fraud detection and verification of complex ingredient lists. This market development requires enhanced food safety and authenticity measures to ensure consumer protection and maintain clean-label commitments across the food supply chain.
By Target Analyte: Allergen Testing Accelerates
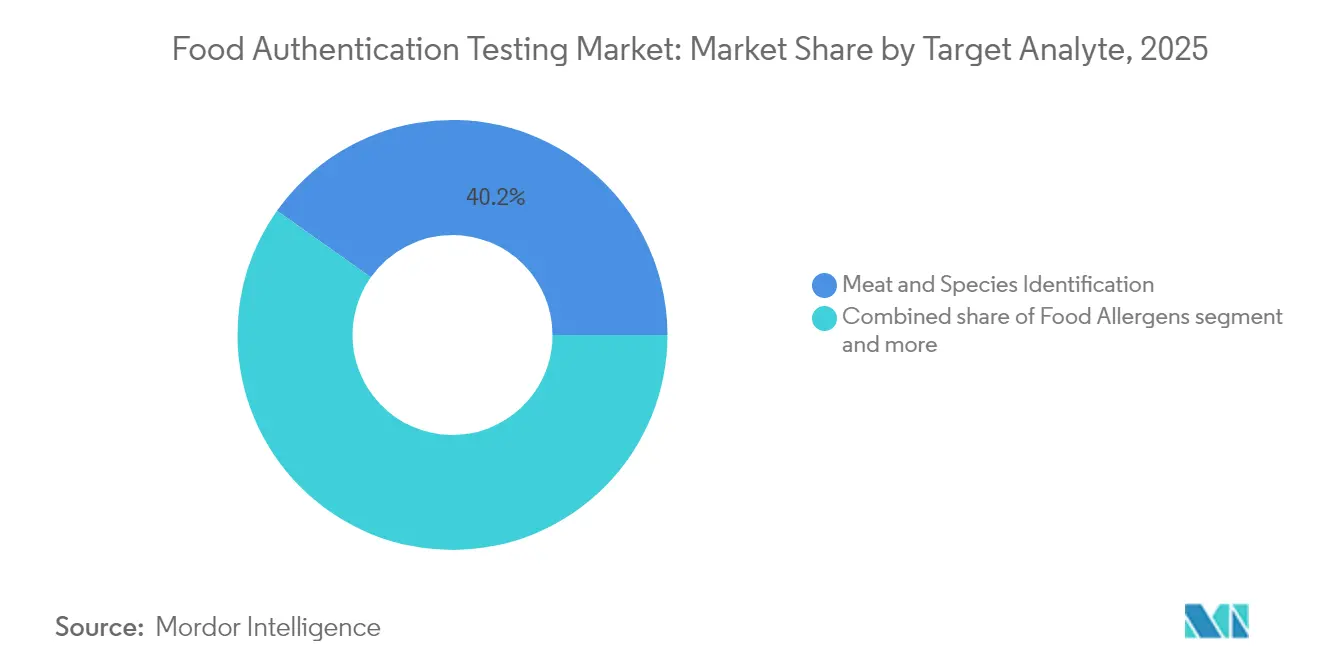
Meat and species identification dominate with a 40.20% market share in 2025, reflecting fundamental authentication needs across global protein supply chains. Food allergens represent the fastest-growing segment with 9.46% CAGR from 2026-2031, driven by the USDA's expanded Allergen Verification Sampling Program that tests for 14 allergens, including crustacean shellfish, eggs, peanuts, milk, tree nuts, and gluten in ready-to-eat products. The FDA's enhanced allergen labeling guidance, released in June 2025, establishes comprehensive requirements for various allergen situations, creating additional testing demands.
Plant and grain authenticity testing verifies the geographical origin of raw materials and validates non-GMO claims, which is critical for clean-label and organic products. Genetically Modified Organism (GMO) testing is required in multiple markets to maintain consumer trust and ensure accurate product labeling. The growth in allergen testing indicates increased awareness of food sensitivities and stricter regulatory compliance, as undeclared allergens remain a primary cause of food recalls. Through systematic testing for contamination and cross-contact, companies minimize recall risks, protect consumers, and maintain market credibility in an environment where label accuracy directly impacts business performance.
Geography Analysis
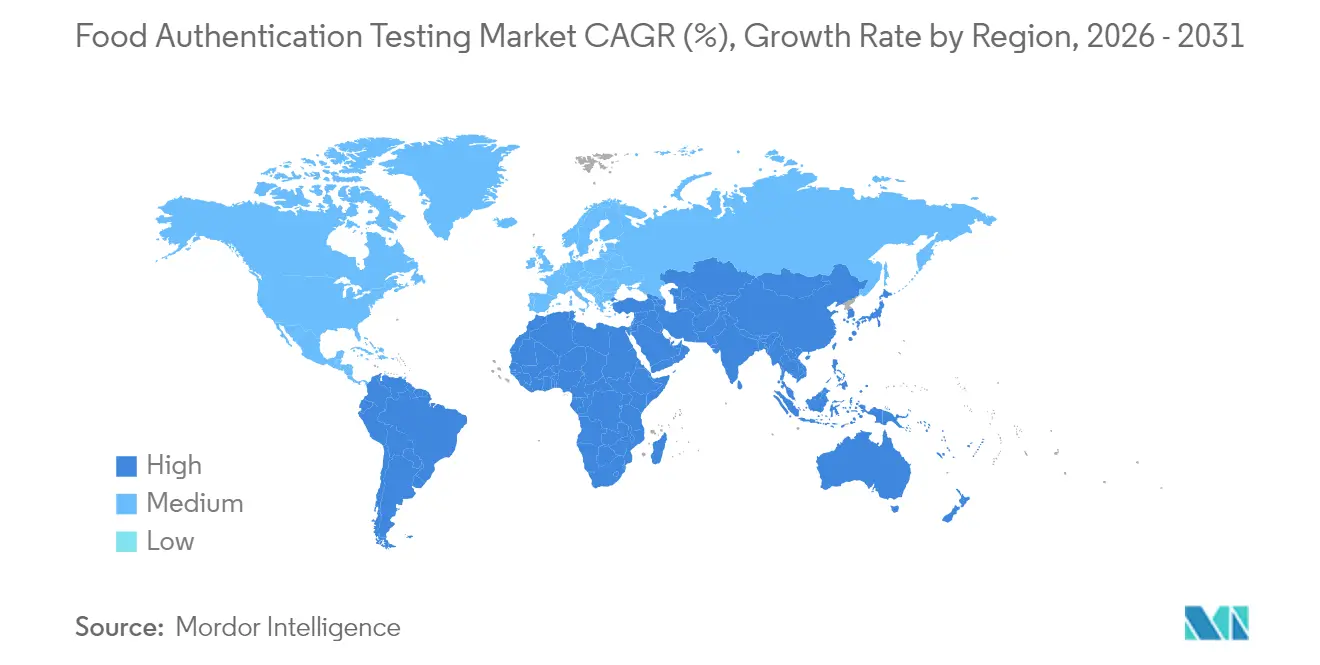
Europe maintains market leadership with 33.70% share in 2025, driven by the EU's zero-tolerance policy toward food fraud and sophisticated enforcement mechanisms through the Agri-Food Fraud Network that coordinates cross-border investigations, according to European Commission data. The region's dominance reflects comprehensive regulatory frameworks, including monthly food fraud summary reports from the Knowledge Centre for Food Fraud and Quality and enhanced analytical methods for detecting unauthorized substances in olive oil since July 2022, according to the Knowledge Centre for Food Fraud and Quality. European laboratories benefit from established infrastructure and harmonized testing methodologies, with the Joint Research Centre developing standard methods for wine, olive oil, chocolate, and processed agricultural products.
Asia-Pacific emerges as the fastest-growing region with 9.18% CAGR from 2026-2031, propelled by China's release of 50 new national food safety standards in March 2025 and enhanced requirements for dairy, meat products, and microbial testing methods, according to the United States Department of Agriculture. China's National Health Commission implemented new food contact adhesive standards effective February 2025, while evaluating regulations for recycled plastics that will impact authentication requirements. The region benefits from expanding manufacturing capabilities and growing consumer awareness, with SGS establishing new partnerships like the HEYTEA agreement to enhance nutritional labeling standards and support global expansion through comprehensive testing services.
North America maintains a significant market presence driven by stringent FDA regulations and the Laboratory Accreditation for Analyses of Foods program that mandates testing protocols for imported foods, according to the Food and Drug Administration data. South America, and Middle East and Africa represent emerging opportunities, with growing regulatory frameworks and increasing consumer awareness driving demand for authentication services, though infrastructure limitations and standardization challenges constrain near-term growth potential.

Regulatory Landscape
Food authentication testing is shaped by food-safety, labeling, and origin-protection regimes that increasingly convert authenticity from a voluntary differentiator into an auditable compliance requirement in high-risk categories. In the United States, FDA enforcement focus on economically motivated adulteration (EMA) has been reinforced by commodity-targeted surveillance, including the publication of FY2025 sampling results for EMA in honey (April 2026), while the LAAF final rule timeline has pushed laboratories and importers toward accredited testing capacity. USDA labeling rules for "Product of USA" claims became effective in January 2026 and raise documentation and verification needs for animal-origin supply chains.
Across other major markets, the European Union has strengthened origin and authenticity frameworks through Regulation (EU) 2024/1143 on geographical indications (adopted April 2024) and continued cross-border fraud coordination via the European Commission's Agri-Food Fraud Network and related reporting mechanisms. This has supported higher testing volumes for products such as olive oil, honey, and spices. In Asia, China has advanced technical standardization for origin-linked quality requirements through GB/T 17924-2025 for geographical indications, and Vietnam promulgated Decree No. 46/2026/ND-CP (January 2026) detailing implementation measures under the Law on Food Safety. The resulting compliance pressure centers on documentation, traceability, and supporting analytics.
Value Chain Analysis
Demand originates with food brand owners, retailers, importers, and certification schemes (organic, halal, kosher, vegan, clean label) that need defensible evidence for label claims, origin, and species composition, especially in complex processed and ready-to-eat matrices. Samples are collected at farm and primary processing sites, manufacturing, distribution, and border points, then routed to in-house QA labs or outsourced laboratories (including global networks such as Eurofins, SGS, Intertek, and ALS). Workflows typically cover method selection (targeted assays vs non-targeted fingerprinting), sample preparation, instrumental analysis (PCR/NGS, LC-MS/GC-MS, NMR, isotope ratio methods), interpretation against reference databases, and reporting intended for audits and regulatory inquiries.
Upstream enablers include standards and method frameworks, such as isotope ratio authentication guidance like EN 18054:2025 for EA-IRMS C and N isotope ratios, along with reference materials and LIMS or data infrastructure that supports chain-of-custody and traceability. Bottlenecks include high capital cost for advanced platforms, accreditation overhead (ISO/IEC 17025), skilled labor shortages that extend turnaround times, and gaps in protocol harmonization across regions. The value chain is also integrating digital traceability with analytics, illustrated by Vietnam's National Agricultural Product Traceability System launch (June 30, 2026), designed around blockchain and GS1-linked identifiers. That system adds data capture nodes that can trigger targeted laboratory confirmation when anomalies appear.
Competitive Landscape
The food authentication testing market maintains a moderate level of consolidation, with companies pursuing strategic acquisitions to strengthen their market position. These acquisitions enable organizations to integrate complementary testing capabilities, expand their service portfolios, and establish operations in new geographical regions. The market's key players include Intertek Group plc, SGS SA, Eurofins Scientific, Thermo Fisher Scientific, and ALS Limited, which collectively hold a significant market share.
Equipment manufacturers focus on technological differentiation through investments in innovation to gain market share by enhancing detection capabilities and workflow efficiency. The market presents growth opportunities in emerging regions and specialized segments, specifically in plant-based protein authentication and cannabis testing, where regulations continue to develop. Smaller companies are implementing AI and machine learning technologies to compete with established firms, developing portable detection devices and real-time monitoring systems that may transform traditional laboratory-based testing approaches.
Expansions, mergers, and acquisitions are some of the most preferred strategies adopted in the food authentication testing industry globally. Due to the swift nature of the food authentication industry, expansion is the most important strategic approach adopted by these companies. In November 2024, Mérieux NutriSciences acquired Bureau Veritas' food testing business for EUR 360 million, expanding its operations to 32 countries, doubling its presence in Canada and Asia-Pacific, and adding 34 laboratories and 1,900 staff members.
Food Authentication Testing Industry Leaders
-
Intertek Group plc
-
SGS SA
-
Eurofins Scientific
-
Thermo Fisher Scientific
-
ALS Limited
- *Disclaimer: Major Players sorted in no particular order

Market Opportunities and Future Outlook
A key whitespace is harmonized allergen-claim verification and defensible "may contain" labeling support across markets, as global guidance evolves and brands seek repeatable testing strategies that reduce recall risk from undeclared allergens. The Codex Alimentarius Commission adopted new guidance on precautionary allergen labeling in July 2026 as an annex to the General Standard for the Labelling of Pre-packaged Foods (CXS 1-1985). This strengthens the case for laboratories and instrument vendors to expand validated allergen detection and cross-contact assessment workflows that translate into audit-ready documentation.
Another opportunity is scaling advanced genomics and non-targeted approaches from specialist use cases into routine authentication for high-fraud commodities and complex processed foods. In such cases, conventional targeted tests can miss sophisticated adulteration. Peer-reviewed work in 2026 highlighted validated NGS approaches for honey authentication and untargeted DNA metabarcoding for species identification in processed foods (including gastropod ingredients), aligning with market pull for broader screening panels that can identify multiple species or ingredients in one run. This intersects with ongoing digitization of traceability (blockchain and GS1-linked identifiers) and creates demand for labs that can combine chain-of-custody data with confirmatory methods such as NGS, PCR, and isotope or mass spectrometry-based fingerprinting to support enforcement actions, retailer specifications, and premium-claim substantiation.
Recent Industry Developments
- March 2026: SGS launched SGS FoodNexus, combining SGS Digicomply regulatory intelligence with Agroknow food risk analytics to support global food safety and compliance management. The product expands digital pre-screening and risk prioritization capabilities that can help steer where authentication sampling and confirmatory testing are deployed across multi-country supply chains.
- September 2025: Norevo completed a pilot using Intertek's HoneyTrace blockchain-based traceability platform to verify honey integrity across the supply chain. The pilot highlights how authentication programs are pairing digital chain-of-custody with testing evidence to address honey fraud and meet buyer requirements for transparent sourcing.
- October 2024: SGS reported accreditation for its next-generation sequencing diagnostics service for identifying biological content in meat, poultry, and fish samples used in authentication contexts. This widens access to NGS-based speciation testing in routine lab operations, supporting higher-throughput verification for complex protein supply chains.


Research Methodology Framework and Report Scope
Market Definition and Coverage
For this methodology, the food authentication testing market covers lab and on-site testing used to verify whether a food product matches its label claims for species, origin, purity, and composition, with the aim of lowering food fraud and mislabeling risk.
Scope exclusions: We exclude general food safety and microbiology testing that is not intended to confirm authenticity claims or detect economically motivated adulteration.
Segmentation Overview
-
By Sample Type
- Raw/Unprocessed Food
- Processed/Ready-to-Eat
-
By Technology
- PCR
- ELISA
- DNA Sequencing/Barcoding
- Next-Generation Sequencing (NGS)
- Mass Spectrometry (LC-MS/GC-MS)
- NMR/Molecular Spectrometry
- Other Technologies
-
By Target Analyte
- Meat and Species Identification
- Plant and Grain Authenticity
- Genetically Modified Organisms (GMO)
- Food Allergens
- Others
-
By Geography
-
North America
- United States
- Canada
- Mexico
- Rest of North America
-
Europe
- United Kingdom
- Germany
- Spain
- France
- Italy
- Russia
- Rest of Europe
-
Asia-Pacific
- China
- India
- Japan
- Australia
- Rest of Asia-Pacific
-
South America
- Brazil
- Argentina
- Rest of South America
-
Middle East and Africa
- Saudi Arabia
- South Africa
- Rest of Middle East and Africa
-
North America
Data Sources, Market Sizing, and Validation
Desk Research
Desk research was used to set the market boundaries and to build an initial set of inputs that were later stress-tested in interviews. We relied on public sources such as government and regulator portals (including USDA and the European Commission), standards bodies (including ISO), food fraud incident databases, and trade statistics that indicate cross-border flows for high-risk food categories.
To convert these signals into a usable model, we also reviewed company annual reports, investor presentations, and lab service brochures to understand which authenticity tests are commonly sold and how they are packaged. In addition, we selectively used paid subscriptions for company financials and intelligence and for patents to track method adoption and technology maturation across PCR, spectroscopy, and mass spectrometry. The sources listed here are illustrative only, and other public documents and datasets were also consulted to collect, validate, and clarify information.
Primary Interviews and Surveys
Primary work focused on validating which food categories drive repeat testing, how testing frequency changes after a fraud incident, and how pricing differs by method complexity and turnaround time. We spoke with a mix of labs, instrument and kit stakeholders, and food producers and brand owners across APAC, EMEA, and the Americas to correct assumptions where secondary information was thin. These conversations also helped confirm practical adoption limits, for example when smaller manufacturers rely on periodic audits rather than routine authentication testing.
Distribution of primary research fieldwork respondents
| Company type | Respondent position | Region |
|---|---|---|
| Top tier: 38% | CXOs: 13% | APAC: 45% |
| Mid tier: 48% | Functional/Unit leaders: 31% | EMEA: 36% |
| Smaller Players: 14% | Managers: 56% | Americas: 19% |
Market-Sizing & Forecasting
Sizing starts from a top-down demand pool based on food fraud exposure and trade-throughput indicators, which are then converted into likely testing volumes by pairing them with typical test panels used for different products. After reconstructing the demand pool, we corroborate results with selective bottom-up approximations, such as sampled price-per-test ranges by method and channel checks on lab throughput, before adjusting totals to match the most realistic delivery capacity.
Key model inputs include the share of high-risk categories (for example meat, dairy, honey, oils, and spices), the split of raw versus processed samples, average test menu mix (PCR, ELISA, isotope analysis, spectroscopy, and mass spectrometry), turnaround requirements that affect pricing, and the observed frequency of retesting triggered by non-compliance events. Where direct volume signals are missing, we handle gaps using conservative penetration assumptions reviewed with experts, then re-check them against lab capacity and instrument installation trends.
Forecasts are built using scenario analysis supported by expert consensus on variables such as regulatory focus on mislabeling, growth in premium label claims (organic, free-from, origin), and expansion of cross-border food supply chains. When input trends diverge by region, regional growth paths are modeled first and then rolled up to the global total so the trajectory remains explainable and repeatable.
Data Validation & Update Cycle
Model outputs are validated through stepwise checks that compare implied testing volumes, pricing, and regional shares against independent signals such as trade flows, food fraud alerts, and stated lab capacity expansions. Outliers are flagged, the assumptions behind them are revisited, and calculations are rerun until the drivers align with what was heard in interviews and with what is visible in public data.
Before sign-off, the model and write-up are reviewed in more than one analyst pass so definitions, units, and conversions remain consistent across sections. Reports are refreshed annually, and interim updates are triggered when material events occur, such as major regulatory actions, large recalls tied to authenticity, or notable changes in testing technology adoption. Right before delivery, a final check is performed to ensure the latest available information has been incorporated.
Mordor Intelligence's Food Authentication Testing Market Size Measured Against Other Published Estimates
Published market sizes for food authentication testing can look far apart because each publisher defines what is included, which years are used as the anchor, and how test pricing is averaged across methods. We keep the comparison focused on evidence that can be checked, including method mix, lab menu coverage, and which adjacent testing services are counted.
Trade throughput for fraud-prone foods, documented fraud incident patterns, and the typical method mix seen in lab menus are the checks that tie Mordor Intelligence to authentication-specific testing revenue (for example species ID, origin verification, and adulteration panels), while keeping general food safety screening outside the market count.
Benchmark comparison
| Source | Market Size | Gaps in Research Methodology |
|---|---|---|
| Mordor Intelligence | USD 1.18 B (2026) | |
| Global Consultancy A | USD 7.06 B (2024) | Uses a broader definition that likely bundles a wider set of laboratory testing and assurance programs beyond authentication-focused panels, and anchors the market to an earlier base year, which can lift the starting value. |
| Industry Publisher B | USD 8.40 B (2024) | Presents a single headline number across many targets and food categories with limited clarity on exclusions, and the mixed use of base year and forecast windows can create overlap that pushes totals upward. |
Across the three figures, the spread is mainly explained by what is included in testing revenues and how the base year is aligned, followed by differences in how method-level pricing is averaged. By keeping the revenue count tied to authentication intent and then rechecking it against demand and capacity signals, the final number remains traceable to clear inputs and repeatable steps.


Key Questions Answered in the Report
What is the current value of the food authentication testing market?
The market is valued at USD 1.18 billion in 2026 and is projected to hit USD 1.68 billion by 2031 at a 7.32% CAGR.
Which region leads the food authentication testing market?
Europe holds the largest share at 33.70% owing to stringent EU fraud controls and a harmonized laboratory network.
Why is next-generation sequencing important for authenticity testing?
NGS allows simultaneous detection of multiple species and pathogens, reduces analysis time, and supports rapid outbreak traceback, helping it grow at 9.35% CAGR.
Which sample type is expanding the fastest?
Processed/ready-to-eat foods are expanding at a 9.22% CAGR because complex formulations attract sophisticated adulteration attempts.
Page last updated on:






