
Fluorochemical Market Size and Share
Market Overview
| Study Period | 2021 - 2031 |
|---|---|
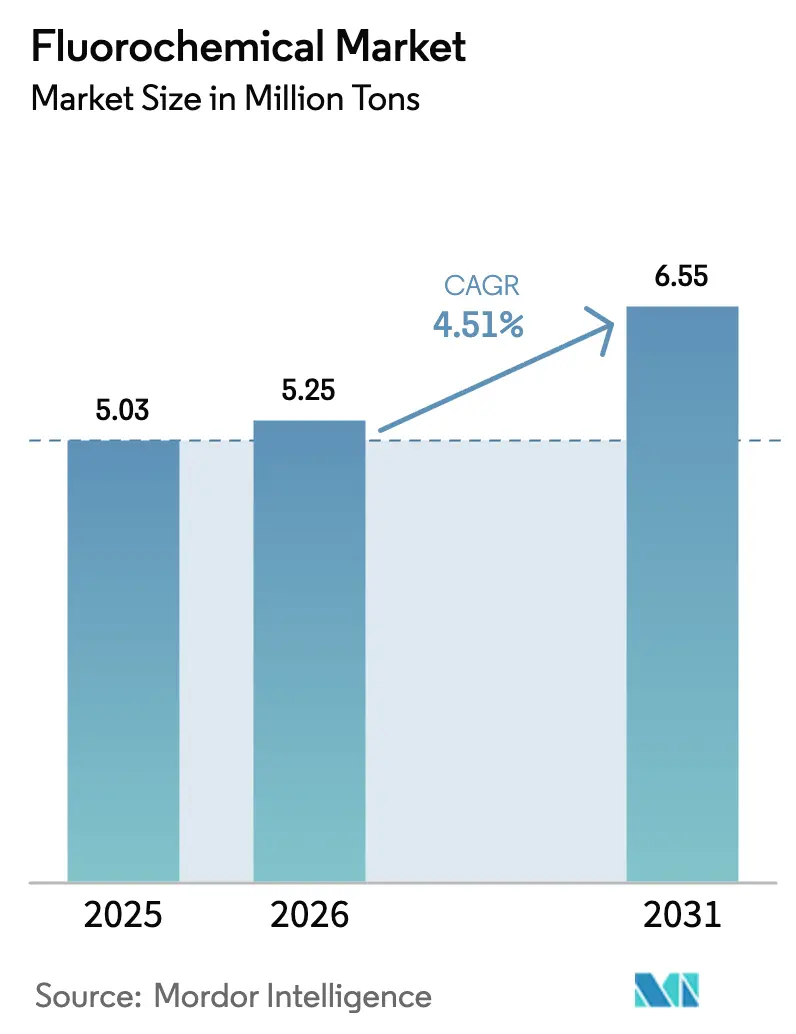
| Market Volume (2026) | 5.25 Million tons |
| Market Volume (2031) | 6.55 Million tons |
| Growth Rate (2026 - 2031) | 4.51 % |
| Fastest Growing Market | Asia-Pacific |
| Largest Market | Asia-Pacific |
| Market Concentration | Medium |
Major Players *Disclaimer: Major Players sorted in no particular order Image © Mordor Intelligence. Reuse requires attribution under CC BY 4.0. | |
Fluorochemical Market Analysis by Mordor Intelligence
The Fluorochemical Market size is expected to grow from 5.03 million tons in 2025 to 5.25 million tons in 2026 and is forecast to reach 6.55 million tons by 2031 at a 4.51% CAGR over 2026-2031. Healthy semiconductor capital expenditure, policy-driven refrigerant phase-downs, and widening medical demand keep the Fluorochemicals market on an upward trajectory despite PFAS-related headwinds. Etching-gas uptake at new fabs in Arizona, Texas, Taiwan, and South Korea provides a high-purity revenue stream that offsets shrinking legacy HFC volumes. Accelerating cold-chain deployment in India, ASEAN, and the Gulf economies sustains first-installation demand, while automotive R-1234yf adoption locks in a multiyear replacement cycle for cabin-cooling systems. Feedstock volatility in fluorspar and regulatory uncertainty around PFAS containment temper margins, yet vertical integration and recycling initiatives enable leading suppliers to defend profitability in the Fluorochemicals market.
Key Report Takeaways
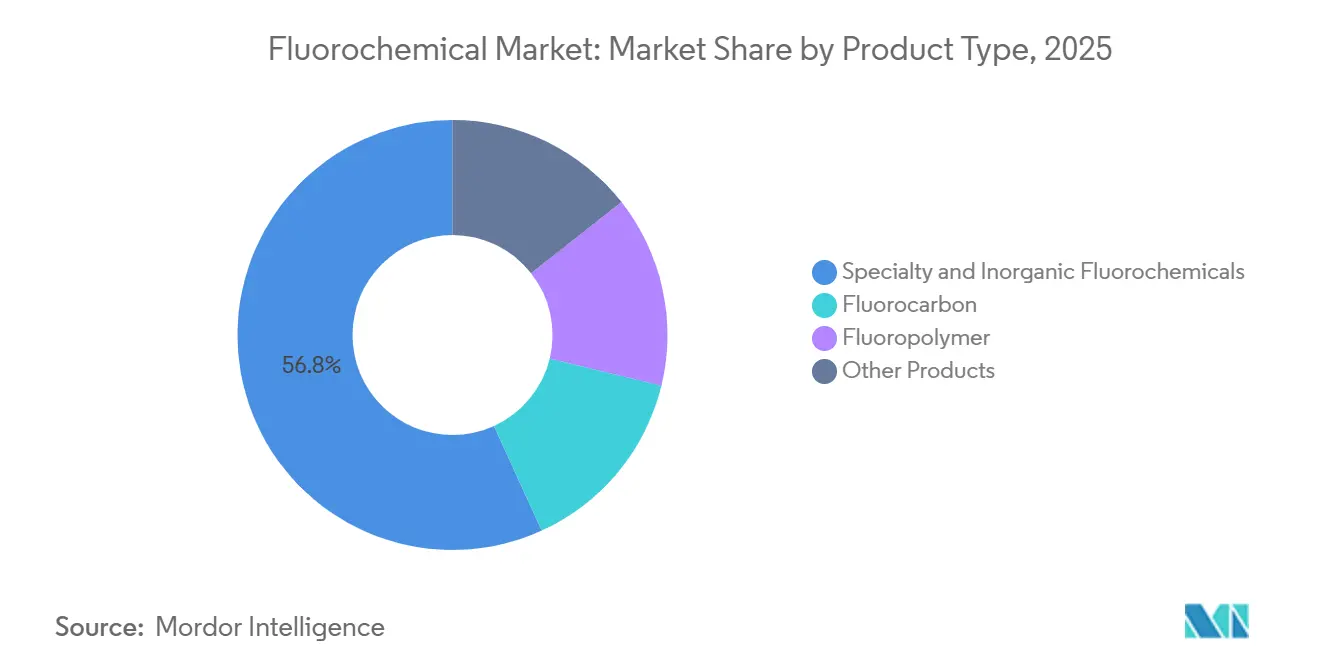
- By product type, specialty and inorganic fluorochemicals led with 56.81% of the Fluorochemicals market share in 2025; fluoropolymers are forecast to expand at an 8.65% CAGR through 2031.
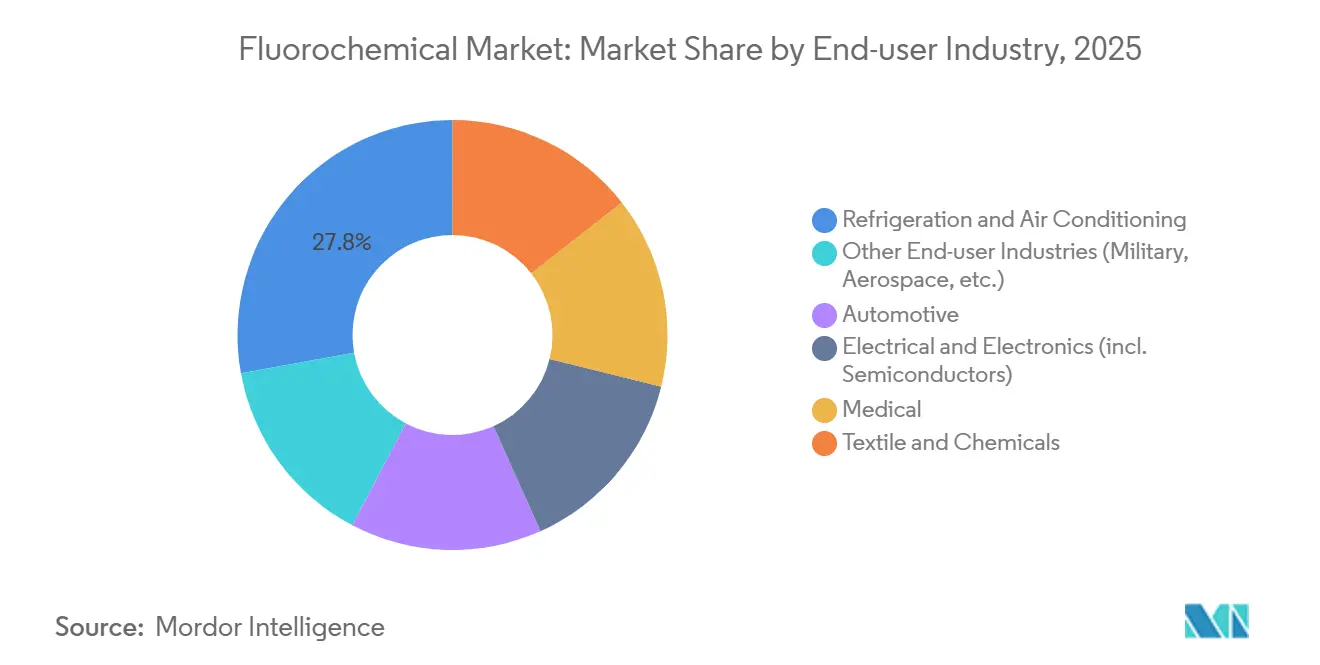
- By end-user industry, refrigeration and air conditioning held 27.84% of the Fluorochemicals market size in 2025; medical end-user industry segment is advancing at a 5.95% CAGR to 2031.
- By geography, Asia-Pacific accounted for 61.52% of the Fluorochemicals market in 2025; the same region is set to register the fastest 4.88% CAGR through 2031.
Note: Market size and forecast figures in this report are generated using Mordor Intelligence’s proprietary estimation framework, updated with the latest available data and insights as of January 2026.
Global Fluorochemical Market Trends and Insights
Drivers Impact Analysis*
| Drivers | (~) % Impact on CAGR Forecast | Geographic Relevance | Impact Timeline |
|---|---|---|---|
| HVAC and cold-chain build-out in emerging economies | +1.2% | Asia-Pacific (India, ASEAN), Middle East & Africa | Medium term (2-4 years) |
| Growing transition to low-GWP HFO refrigerants | +0.9% | Global, with EU and North America leading | Short term (≤ 2 years) |
| Semiconductor boom in East Asia drives high-purity demand | +0.8% | Asia-Pacific, North America | Medium term (2-4 years) |
| EV battery chemistries adopting fluorinated binders and salts | +0.7% | Global, concentrated in China, Europe, North America | Long term (≥ 4 years) |
| Increasing demand for hydrogen turbines needing ultra-high-temperature fluoropolymer seals | +0.3% | Europe, North America, select Asia-Pacific markets | Long term (≥ 4 years) |
| Source: Mordor Intelligence | |||
HVAC and Cold-Chain Build-Out in Emerging Economies
Cold-storage infrastructure spending in India is rising toward USD 47.4 billion by 2032, spurred by government programs to cut post-harvest food loss. New warehouses and supermarkets across Thailand, Vietnam, and Indonesia follow similar trajectories, albeit under looser efficiency rules, allowing medium-GWP blends to remain relevant for two to three more years. Gulf states back food-security targets with chilled warehouses that prefer factory-charged HFO systems to avoid Kigali quota penalties, compressing equipment-replacement cycles. These installations add steady volume to the Fluorochemicals market as each split air-conditioner typically contains one to two kilograms of refrigerant, while commercial walk-ins carry five to 10 kilograms. Strict urban-fire codes delay propane uptake in densely populated cities, further extending demand for fluorocarbon options.
Growing Transition to Low-GWP HFO Refrigerants
EU Regulation 2024/573 and the U.S. AIM Act together force an 85% HFC reduction before 2036, accelerating adoption of R-1234yf and R-1234ze in vehicles and chillers. Light-duty vehicles in the EU, U.S., Japan, and South Korea switched almost entirely to R-1234yf by 2025, yet the product remains priced at roughly triple that of phased-out R-134a because production is concentrated at two patent-holders. Commercial HVAC retrofits favor R-513A but often require lubricant and gasket upgrades that prolong payback periods. China’s OEMs still push R-32 for domestic sales, deferring a broad HFO transition until export compliance demands take hold late in the decade. Natural refrigerant installations, particularly CO₂ transcritical supermarkets, keep gaining share in Europe, but higher energy costs and regulatory lag in North America slow similar substitution trends.
Semiconductor Boom in East Asia Drives High-Purity Demand
Ongoing fab construction by TSMC, Samsung, and Intel is set to add 1.2 million wafer starts per month by 2027, lifting demand for NF₃ and CF₄ that must meet 99.999% purity standards. China’s push for local semiconductor self-sufficiency multiplies the requirement for mature-node plasma gases despite export control hurdles. Recycling initiatives under SEMI’s 2024 F-gas program remain under-deployed, so virgin gas demand persists, directly benefiting the Fluorochemicals market[1]SEMI, “SEMI Launches F-Gas Abatement Initiative,” semi.org. Japan and South Korea tightened import permits in 2025, prompting producers such as Daikin and AGC to colocate gas output near cluster hubs, ensuring supply continuity during geopolitical disruptions.
EV Battery Chemistries Adopting Fluorinated Binders and Salts
PVDF binder and LiPF₆ salt together represent only 2%–3% of battery mass but deliver critical adhesion and ionic conductivity. China houses nearly 70% of global PVDF capacity and most LiPF₆ production, creating sourcing risk for Western cell makers. Arkema and Solvay are adding lines in Kentucky and Belgium, yet capital intensity above USD 500 million per 50 kt slows diversification. Solid-state roadmaps could reduce LiPF₆ volumes post-2030, but incumbent liquid-cell designs will dominate through the forecast period, keeping the Fluorochemicals market lifted by battery growth. FEC additive penetration further raises fluorine loading per kilowatt-hour.
Restraints Impact Analysis*
| Restraints | (~) % Impact on CAGR Forecast | Geographic Relevance | Impact Timeline |
|---|---|---|---|
| Global PFAS regulatory clamp-down | −0.6% | North America, Europe, spillover to Asia-Pacific | Short term (≤ 2 years) |
| Fluorspar feedstock supply volatility | −0.4% | Global, with import-dependent regions most exposed | Medium term (2-4 years) |
| Uptake of natural refrigerants and fluorine-free solvents | −0.3% | Europe leading, North America and Asia-Pacific following | Long term (≥ 4 years) |
| Source: Mordor Intelligence | |||
Global PFAS Regulatory Clamp-Down
In April 2024, the U.S. EPA set 4 ppt limits for PFOA and PFOS in drinking water, triggering CERCLA liability and exposing producers to remediation settlements that can exceed USD 10 billion[2]U.S. EPA, “National Primary Drinking Water Regulation for PFAS,” epa.gov. The EU’s broad PFAS restriction proposal advanced to final opinion in 2025; exemptions for chips and medical devices remain uncertain and delay investment commitments. Germany now requires proof of containment at fluorochemical sites, raising operating costs, while Japan issued monitoring guidelines that foreshadow stricter rules. Semiconductor and medical stakeholders argue that PTFE and other fluoropolymers lack substitutes, but public pressure complicates approval processes, weighing on the Fluorochemicals market.
Fluorspar Feedstock Supply Volatility
China supplies up to 65% of worldwide fluorspar, and export-quota shifts or environmental inspections in Inner Mongolia routinely spike delivered prices by 30%–40%. Mongolia and Mexico offer alternatives, yet volumes cannot fully offset a sustained Chinese cutback, and overland transport adds double-digit logistics premiums. New mines in South Africa and Kenya remain at permitting stages, while Western HF plants face siting barriers due to hazardous-substance rules. Long-term offtake agreements help integrated majors secure feedstock but reduce spot liquidity for smaller players, raising barriers to entry and injecting cost uncertainty into the Fluorochemicals market.
*Our forecasts treat driver/restraint impacts as directional, not additive. The impact forecasts reflect baseline growth, mix effects, and variable interactions.
Segment Analysis
By Product Type: Fluoropolymers Outpace Legacy Refrigerants
Fluoropolymers are forecast to expand at an 8.65% CAGR through 2031, nearly doubling overall Fluorochemicals market growth. Specialty and inorganic products held 56.81% of the Fluorochemicals market share in 2025 as semiconductor gases and pharma intermediates continued to dominate premium niches. PTFE remains the volume leader because of unmatched chemical inertness in seals and gaskets, while PVDF’s binder role in EV batteries advances at double-digit rates that elevate the Fluorochemicals market size for battery materials. Fluoroelastomers command the highest per-kilogram pricing due to aerospace and under-hood specifications that tolerate no substitution.
Growth momentum in PTFE and PVDF contrasts with shrinking HFC volumes under Kigali quotas. HFO uptake only partially offsets this contraction, leaving overall fluorocarbon demand flat to slightly down. China’s fast-tracked PVDF and PTFE expansions introduce oversupply risk if PFAS import rules tighten in Europe or the United States, yet low cost and captive fluorspar keep Chinese volumes competitive. “Other products,” notably fluorinated surfactants, face the harshest regulatory scrutiny and could shrink outright once broad PFAS bans crystallize.



By End-User Industry: Medical Segment Accelerates Amid Refrigeration Maturity
Refrigeration and air conditioning held 27.84% of the Fluorochemicals market size in 2025, but natural-refrigerant substitution and better energy efficiency slow incremental volume. Medical devices grow at a 5.95% CAGR, led by PTFE vascular grafts, PVDF stent coatings, and fluoropolymer catheters that leverage biocompatibility and sterilization resistance. Semiconductor demand continues to rise steadily as fabs consume high-purity NF₃ and PTFE wire insulation, keeping the Fluorochemicals market balanced between electronics and medical growth vectors.
Automotive demand is in transition: internal-combustion fleets still need HFO cabin cooling, while EV adoption shifts usage toward PVDF binder and LiPF₆ salt. Textile and outdoor-wear makers phase out fluorotelomer DWR coatings under corporate sustainability pledges, trimming consumption in that niche. Aerospace and military users stay stable thanks to mission-critical exemptions that protect fluoroelastomer and PTFE applications from regulatory bans.
Geography Analysis
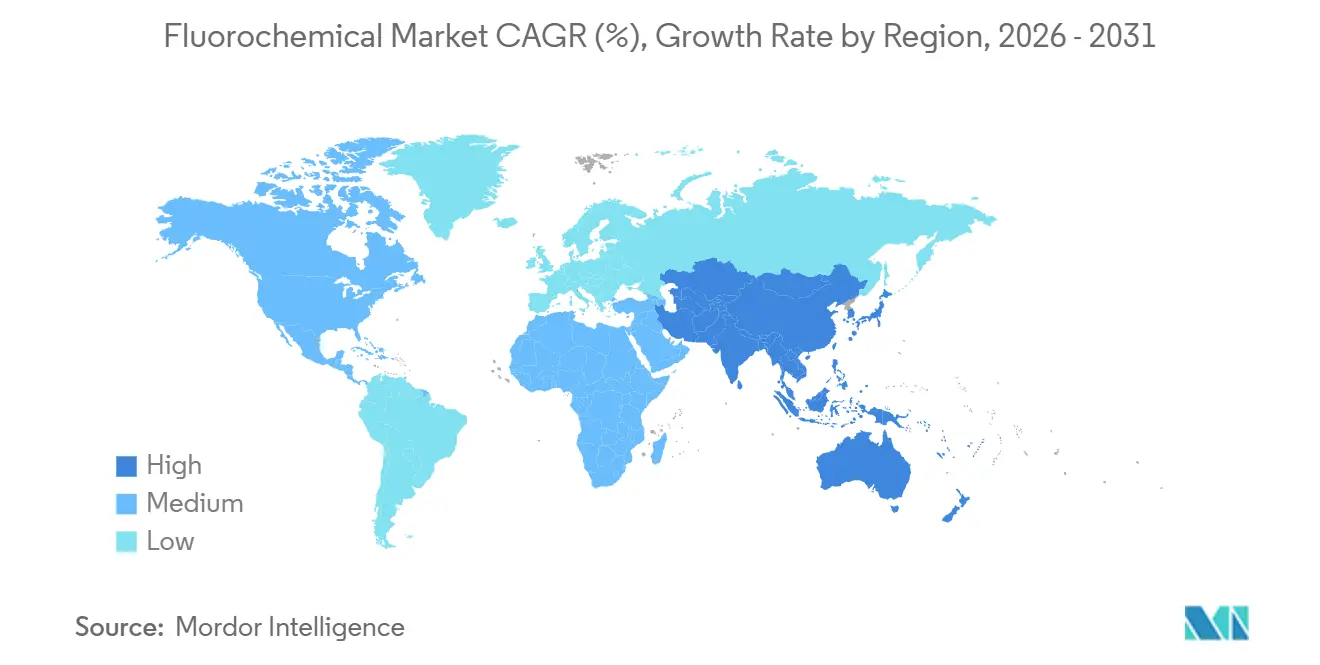
Asia-Pacific held 61.52% of the Fluorochemicals market in 2025 and is forecast to post a 4.88% CAGR through 2031. China’s vertically integrated majors leverage captive fluorspar and HF to defend cost leadership, while India’s USD 47.4 billion cold-chain build elevates HFC and R-32 demand. Japan and South Korea import more high-purity gases after capacity relocations to China, spurring re-shoring incentives that could boost regional Fluorochemicals market volumes from 2027 onward.
North America ranked second in 2025, lifted by semiconductor megaprojects in Arizona, Texas, and Ohio and by mandatory R-1234yf adoption in cars. Permitting delays and labor shortages slightly postpone new fab startups, tempering near-term volume, but once operational the additional NF₃ and CF₄ pull-through will materially enlarge the regional Fluorochemicals market. Canada’s oil-sands processing and aerospace production sustain PTFE and fluoroelastomer demand, while Mexico strengthens its role as a fluorspar supplier to U.S. HF plants.
Europe’s share slipped as F-gas quotas constrained new HFC sales and PFAS compliance costs deterred capacity additions. Producers now focus on high-margin specialty niches and fluoropolymer recycling, leveraging regulatory exemptions for aerospace and medical devices. South America and Middle East & Africa remain smaller bases yet post above-average growth, aided by refrigeration infrastructure, district-cooling projects, and rising living standards that spur first-time appliance ownership.

Regulatory Landscape
Regulation is tightening around both climate-impact fluorocarbons and persistent PFAS chemistries, which is pushing compliance, reporting, and containment requirements further through the fluorochemical value chain. In the EU, the fluorochemical market is being shaped by the F-gas framework and a REACH-driven PFAS process: ECHA committees reached major milestones in March 2026, with RAC adopting its final opinion on 2 March 2026 and SEAC agreeing a draft opinion on 10 March 2026, followed by a 60-day consultation initiated on 26 March 2026 for the group restriction proposal submitted by authorities in the Netherlands, Germany, Denmark, Norway, and Sweden. Separately, the European Commission adopted a restriction on PFAS in firefighting foams in October 2025, signaling nearer-term tightening for select PFAS uses even as broader derogations are debated.
In the United States, EPA actions are increasingly focused on PFAS reporting, water, and downstream liability. Under TSCA Section 8(a)(7), EPA required manufacturers and importers of PFAS or PFAS-containing articles since 2011 to report identity, uses, and volumes, with the submission window opening on 11 July 2025; deadlines include 11 January 2026 for most manufacturers and 11 July 2026 for small businesses importing PFAS-containing articles. Alongside this, EPA published a proposal on 20 May 2026 to rescind certain SDWA determinations for four PFAS substances (PFHxS, PFNA, HFPO-DA, and a mixture including these plus PFBS), creating near-term uncertainty for specific drinking-water obligations while the broader PFAS regulatory trajectory continues to tighten.
Value Chain Analysis
The fluorochemical value chain starts with upstream mineral and inorganic inputs (notably fluorspar to hydrofluoric acid), moves through fluorination and synthesis into fluorocarbons, fluoropolymers, and specialty and inorganic fluorochemicals, and then proceeds to purification, compounding, packaging, and distribution to end users such as refrigeration and air conditioning, automotive thermal management, semiconductors, medical devices, and industrial processing. A key structural feature is the premium placed on ultra-high-purity grades for electronics (for example, etch and chamber-clean gases) and specialty fluoropolymers, which require dedicated purification, cylinder logistics, and qualification cycles that raise switching costs and favor suppliers with integrated capabilities.
Regulatory compliance and emissions control have become central nodes in the chain, affecting raw-material sourcing, production controls, and downstream traceability. In Europe, industry association work indicates domestic fluoropolymer supply is structurally constrained: demand was about 56,500 tonnes in 2025, while domestic production was about 14,500 tonnes (around 25%), leaving imports to cover the balance and increasing exposure to trade, logistics, and policy shifts. Voluntary initiatives such as the Fluoropolymers Product Group (FPG) Manufacturing Programme (established in 2023, with progress updates scheduled for 2026) are pushing tighter emission controls, while studies highlight that PFAS-containing components are widely used in chemical manufacturing plant equipment where substitutes are not technically feasible for many critical duties. Liability and remediation dynamics also affect long-term contracting and supplier qualification, including the August 2025 Chemours, DuPont, and Corteva settlement agreement with the State of New Jersey, which reshaped risk management and cost allocation for legacy PFAS issues.
Competitive Landscape
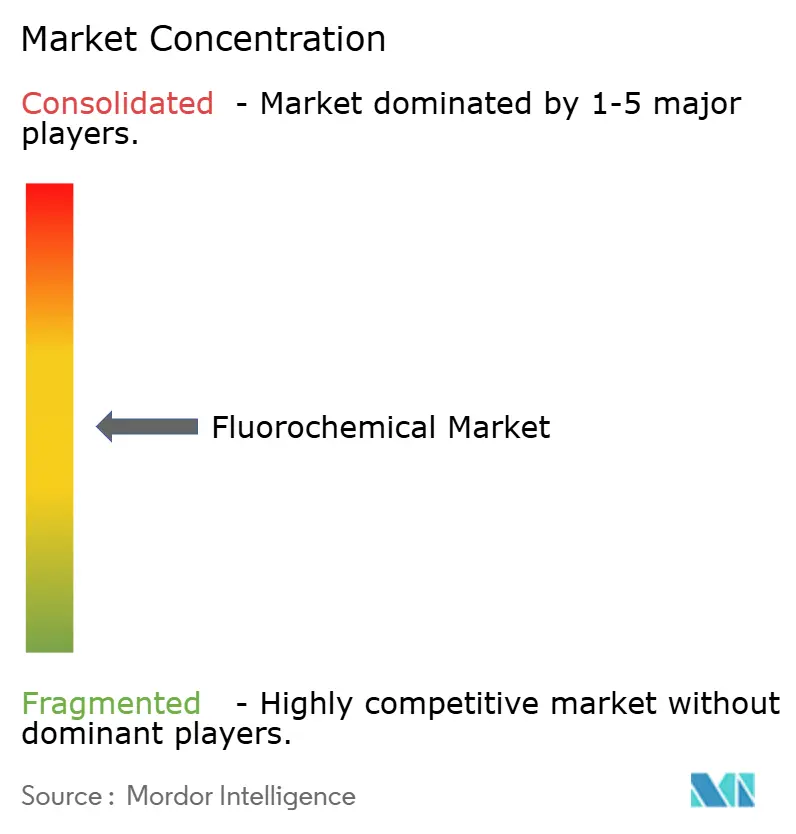
The Fluorochemicals market is moderately consolidated. Success in the fluorochemical industry increasingly relies on the ability of companies to deliver sustainable solutions while maintaining cost efficiency. Leading market players are making substantial investments in next-generation products designed to reduce environmental impact, driven by evolving regulations on greenhouse gas emissions. These companies are also prioritizing high-growth application segments by directing targeted research and development efforts. Establishing strong relationships with end-users through technical support and customized solutions has become essential for preserving market share. Effectively navigating complex regulatory frameworks and ensuring resilient supply chains will be critical for achieving long-term business success.
Emerging players can strengthen their market position by focusing on niche applications and regional markets, where they can cultivate strong customer relationships and develop specialized expertise. Success factors include delivering innovative solutions to address specific industry challenges, building efficient distribution networks, and maintaining production flexibility. Additionally, companies must recognize the growing importance of sustainability credentials and environmental compliance in influencing customer decisions. The market's future will depend on the ability of players to balance environmental considerations with performance requirements while mitigating risks associated with substitution by alternative materials and technologies. Strategic partnerships with research institutions and technology providers will play an increasingly significant role in sustaining competitive advantage.
Fluorochemical Industry Leaders
The Chemours Company
Daikin Industries, Ltd.
Honeywell International Inc.
3M
Arkema
- *Disclaimer: Major Players sorted in no particular order

Market Opportunities and Future Outlook
Higher-value, application-specific fluorochemicals remain a visible whitespace as suppliers align capacity, partnerships, and technical support around end markets that prioritize performance and purity rather than commodity volume. Semiconductor-linked materials provide a concrete pull: Daikin disclosed plans to expand perfluoroelastomer (FFKM) capacity at its Kashima Plant in Japan, targeting semiconductor demand with completion scheduled for August 2026. That plan supports demand for specialty fluoropolymers and elastomers used in seals, gaskets, and high-temperature, chemically aggressive fab environments, where qualification and uptime requirements support premium pricing and long customer qualification cycles.
A second opportunity area is fluorinated fluids and adjacent chemistries tied to next-generation cooling and electrification, alongside portfolio reshaping under refrigerant policy and quota systems. Chemours signed a joint development agreement with 2CRSi (February 2026) to accelerate deployment of Opteon two-phase immersion cooling fluid for high-density servers, linking fluorinated dielectric fluids to data center thermal management requirements referenced in the report scope. Separately, capacity and financing moves in India and among Indian producers suggest active investment lanes in refrigerants and value-added fluorochemicals: Gujarat Fluorochemicals Limited disclosed strategic intent to expand refrigerant capacity including R134a (June 2026), and TANFAC raised about Rs 423.5 crore via a Qualified Institutional Placement and proposed preferential issue (July 2026) to accelerate expansion in R-32 and other value-added fluorochemicals. These actions are occurring alongside PFAS compliance and reporting burdens, which are pushing manufacturers toward tighter emissions management, improved product stewardship, and more selective end-use focus where derogations, criticality, and technical substitutability support continued supply.
Recent Industry Developments
- April 2026: Daikin Industries, Ltd. outlined an expansion of perfluoroelastomer (FFKM) production capacity at its Kashima Plant in Japan, aimed at semiconductor-industry demand, with completion scheduled for August 2026. The move strengthens supply of high-spec sealing materials used in advanced fabs, where qualification cycles and reliability requirements reward producers with secure capacity and process control.
- October 2025: Daikin Industries committed USD 800 million to expand PTFE and FEP output by 40% at Decatur, Alabama, including abatement equipment designed to cut fluorinated-gas emissions by 50%. The investment adds scale in core fluoropolymers while aligning production with tightening emissions expectations across fluorochemical manufacturing.
- July 2025: Honeywell signed a USD 500 million multiyear agreement to supply ultra-high-purity NF3 and CF4 to Samsung fabs, including joint work on next-generation low-GWP plasma gases. The contract supports secure sourcing for high-purity electronics gases and reinforces supplier positioning in semiconductor-driven demand that offsets pressure on legacy refrigerants.


Research Methodology Framework and Report Scope
Market Definition and Coverage
For this report, the fluorochemical market covers the commercial production and consumption of fluorinated chemical products used across industrial and consumer end uses, tracked as physical volume to keep comparisons consistent across regions.
Scope exclusions: We do not treat downstream finished goods as fluorochemicals when the fluorinated chemistry is only a minor additive in a final manufactured product.
Segmentation Overview
- By Product Type
- Fluorocarbon
- HFCs
- HFOs
- HCFCs
- Fluoropolymer
- PTFE
- PVDF
- PCTFE
- Fluoroelastomers
- Others
- Specialty and Inorganic Fluorochemicals
- Other Products
- Fluorocarbon
- End-user Industry
- Refrigeration and Air Conditioning
- Automotive
- Electrical and Electronics (incl. Semiconductors)
- Medical
- Textile and Chemicals
- Other End-user Industries (Military, Aerospace, etc.)
- By Geography
- Asia-Pacific
- China
- India
- Japan
- South Korea
- ASEAN Countries
- Rest of Asia-Pacific
- North America
- United States
- Canada
- Mexico
- Europe
- Germany
- United Kingdom
- France
- Italy
- Russia
- Rest of Europe
- South America
- Brazil
- Argentina
- Rest of South America
- Middle East and Africa
- Saudi Arabia
- South Africa
- Rest of Middle East and Africa
- Asia-Pacific
Data Sources, Market Sizing, and Validation
Desk Research
Desk research was used to build the first view of supply, demand, and trade flows for fluorinated chemistries, and then to set guardrails for volumes by end-use pull. We relied on public statistical series and regulatory references that connect closely to this market, such as USGS minerals data for fluorspar and acid-grade fluorite, UN Comtrade trade statistics for key fluorochemical and feedstock codes, the US EPA and ECHA pages on fluorinated substances and PFAS-related actions, and UNEP or Kigali Amendment documentation related to refrigerant phase-downs.
We also checked company annual reports, investor decks, and earnings call notes to understand capacity changes, utilization signals, and application mix shifts that can move shipment volumes. In some cases, paid subscriptions for company financials and intelligence, patents, and shipment-level import/export views were used to speed up cross-checks and fill small data gaps without changing the core logic. The desk sources listed here are illustrative only, and many other public and paid references were used to collect, validate, and clarify data points through the research cycle.
Primary Interviews and Surveys
Primary work was run to pressure-test the desk assumptions around volume splits, product substitution, and the pace of refrigerant transition, before the model was finalized. We spoke with a mix of producers, distributors, and downstream buyers across major consuming regions so pricing direction, supply tightness, and end-use demand signals could be reconciled into one consistent set of assumptions.
Distribution of primary research fieldwork respondents
| Company type | Respondent position | Region |
|---|---|---|
| Top tier: 30% | CXOs: 12% | APAC: 50% |
| Mid tier: 56% | Functional/Unit leaders: 34% | EMEA: 30% |
| Smaller Players: 14% | Managers: 54% | Americas: 20% |
Market-Sizing & Forecasting
Sizing was built as a demand-led model where end-use activity and adoption factors are used to reconstruct the addressable volume pool, and then converted into total market volume. In practice, key demand anchors included refrigeration and air conditioning replacement and new installation activity, automotive cooling adoption patterns, semiconductor and electronics output indicators for high-purity uses, and industrial processing cycles that affect specialty fluorinated intermediates.
To keep the totals realistic, selective bottom-up approximations were used as checks, such as capacity and utilization roll-ups for major product families, sampled shipment volumes in trade flows, and volume-to-revenue reasonableness checks using typical ASP bands by product group. When a product or region had limited transparency, gaps were handled with conservative proxy ratios tied to feedstock availability, announced capacity, and import dependence, and then validated again through expert feedback.
Forecasting relied mainly on scenario analysis so policy-driven inflection points could be reflected, especially where refrigerant phase-down timelines and PFAS restrictions change mix and pricing. Assumptions on utilization recovery, product substitution, and gradual ASP normalization were reviewed with industry respondents, and then applied consistently across regions.
Data Validation & Update Cycle
Validation was done through multiple checks so no single data series could over-influence the outcome. We compared model outputs against independent signals like feedstock trends, trade balances, capacity announcements, and end-use demand markers, and then investigated any large variances before sign-off.
Numbers were also reviewed in stepwise internal passes, where assumptions are re-tested and calculations are recalculated by a second analyst. The report is refreshed annually, and interim updates are triggered when material events occur, such as major plant outages, policy changes, or sharp input cost swings. Before delivery, a final review pass is completed so clients receive the most current view available at that time.
Mordor Intelligence's Fluorochemical Market Sizing Compared With Other Published Estimates
Published estimates for fluorochemicals often land far apart because sources mix value-based and volume-based sizing, and they do not always align on what is counted as a fluorochemical. Differences also show up when one study leans on long-dated price assumptions while another emphasizes near-term policy shifts and capacity moves.
A big driver is how average selling prices are carried forward, since this market can swing with feedstock costs, refrigerant mix changes, and high-purity demand from electronics. Another driver is refresh cadence and currency timing, because translating global pricing into USD can change totals even when physical demand is similar. This is where the annual review and spot checks in Mordor Intelligence help keep the volume model anchored to recent trade and end-use signals.
Benchmark comparison
| Source | Market Size | Gaps in Research Methodology |
|---|---|---|
| Mordor Intelligence | USD 5.25 M (2026) | |
| Trade Journal A | USD 24.61 B (2024) | This figure is reported as revenue and is not directly comparable to a volume-based market size, and it may also include broader downstream value capture beyond primary fluorochemical volumes. |
| Industry Publication B | USD 32.75 B (2025) | The estimate appears to use value totals with its own ASP trajectory and currency conversion timing, which can inflate or deflate results versus a model that is anchored first on physical volume and then sanity-checked with pricing bands. |
Taken together, the spread mainly reflects measurement choice and price-handling rather than a disagreement that demand exists. Our approach stays traceable because the starting point is a clear physical demand pool, and the cross-checks against trade, capacity, and end-use activity make the steps repeatable when inputs change.


Key Questions Answered in the Report
What is the projected volume of the Fluorochemicals market in 2031?
The Fluorochemicals market is forecast to reach 6.55 million tons by 2031, up from 5.25 million tons in 2026.
Which product segment is growing fastest through 2031?
Fluoropolymers are expanding at an 8.65% CAGR, nearly twice the overall market pace due to semiconductor, EV-battery, and medical uptake.
Why is Asia-Pacific the largest regional consumer?
China’s integrated production, India’s cold-chain build-out, and East-Asian semiconductor investments together give Asia-Pacific 61.52% of global demand.
How will PFAS regulations influence supply?
Stricter rules in the U.S. and EU add remediation costs and investment uncertainty, trimming 0.6 percentage points from the forecast CAGR.
Which companies dominate low-GWP refrigerant supply?
Chemours and Honeywell hold key patents for R-1234yf and R-1234ze, sustaining a pricing advantage despite incoming capacity from Chinese competitors.
Page last updated on:


 Your data is secure and never sold or shared.


