Solar PV Mounting Systems Market Size and Share
Market Overview
| Study Period | 2020 - 2030 |
|---|---|
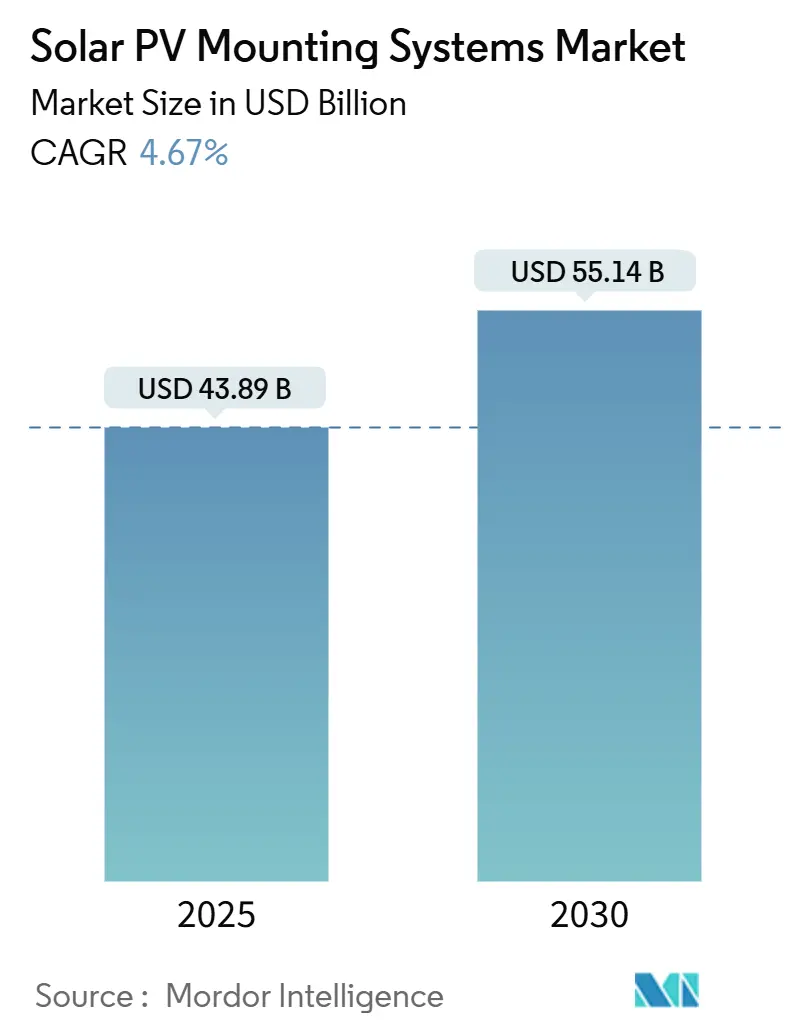
| Market Size (2025) | USD 43.89 Billion |
| Market Size (2030) | USD 55.14 Billion |
| Growth Rate (2025 - 2030) | 4.67% CAGR |
| Fastest Growing Market | Asia Pacific |
| Largest Market | Asia Pacific |
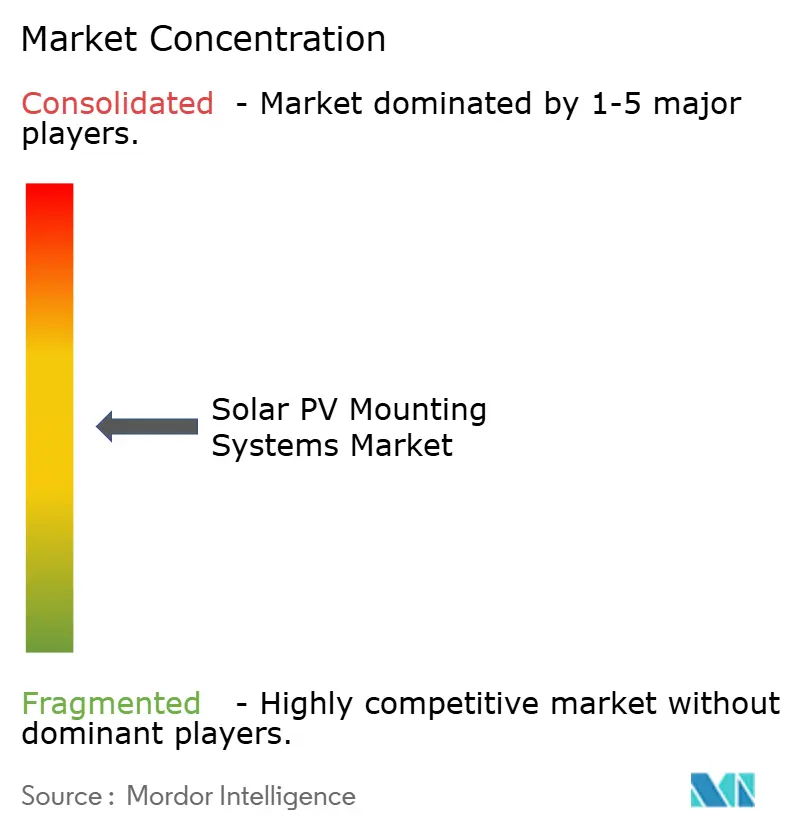
| Market Concentration | Medium |
Major Players *Disclaimer: Major Players sorted in no particular order Image © Mordor Intelligence. Reuse requires attribution under CC BY 4.0. | |
Solar PV Mounting Systems Market Analysis by Mordor Intelligence
The Solar PV Mounting Systems Market size is estimated at USD 43.89 billion in 2025, and is expected to reach USD 55.14 billion by 2030, at a CAGR of 4.67% during the forecast period (2025-2030).
Installations keep pace with global solar capacity, which touched 600 GW in 2024, buoyed by tracker hardware cost declines, supportive policy incentives such as the U.S. Inflation Reduction Act, and the European Union’s mandate for rooftop solar on new buildings starting in 2026.[1]European Commission, “Directive on Rooftop Solar Mandate,” europa.eu Tracking systems attract accelerating interest because they can raise annual energy output by as much as 25% compared with fixed-tilt arrays. Asia-Pacific maintains leadership, holding 46.4% of the solar PV mounting systems market in 2024 and expanding on the back of China’s 671.5 GW cumulative solar base and India’s 500 GW target for 2030. Floating solar opens new terrain, offering up to 15% higher yields through water-cooling effects and alleviating land scarcity, especially across Southeast Asia
Key Report Takeaways
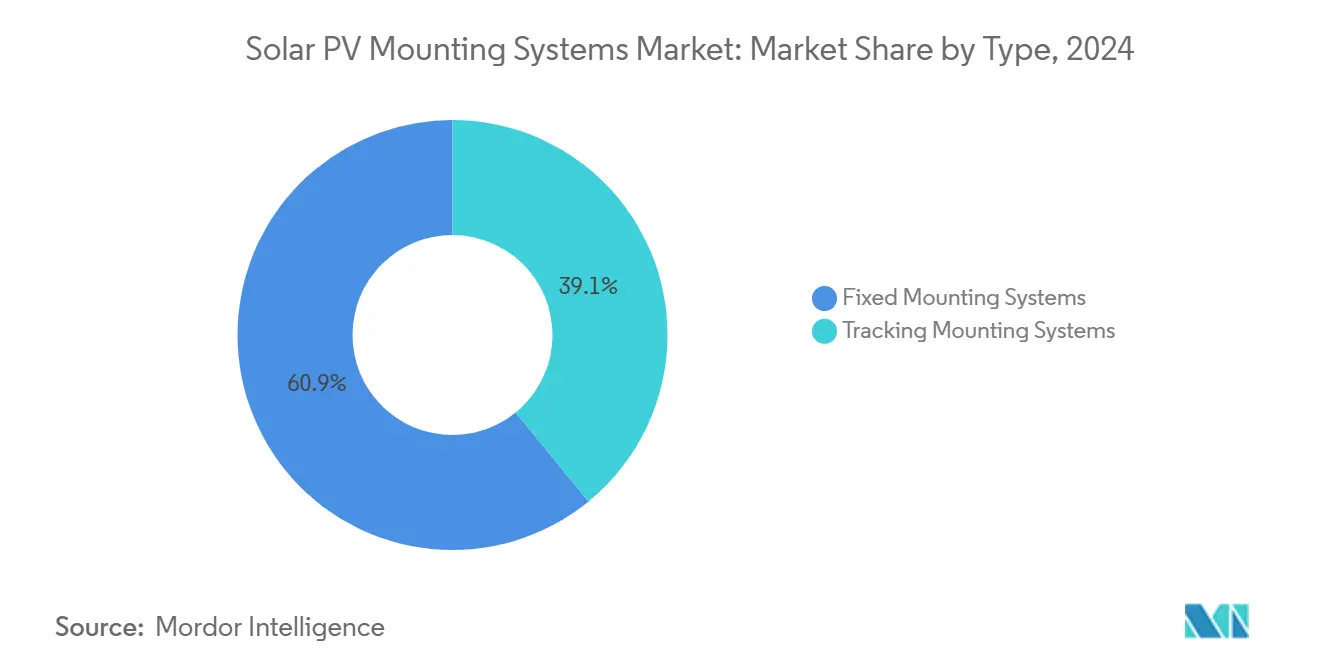
- By type, fixed mounting systems led with a 60.9% revenue share in 2024, while tracking systems are projected to post the fastest 5.3% CAGR through 2030.
- By material, aluminum captured 71.5% of the solar PV mounting systems market share in 2024; steel is set to grow the quickest at a 6.2% CAGR to 2030.
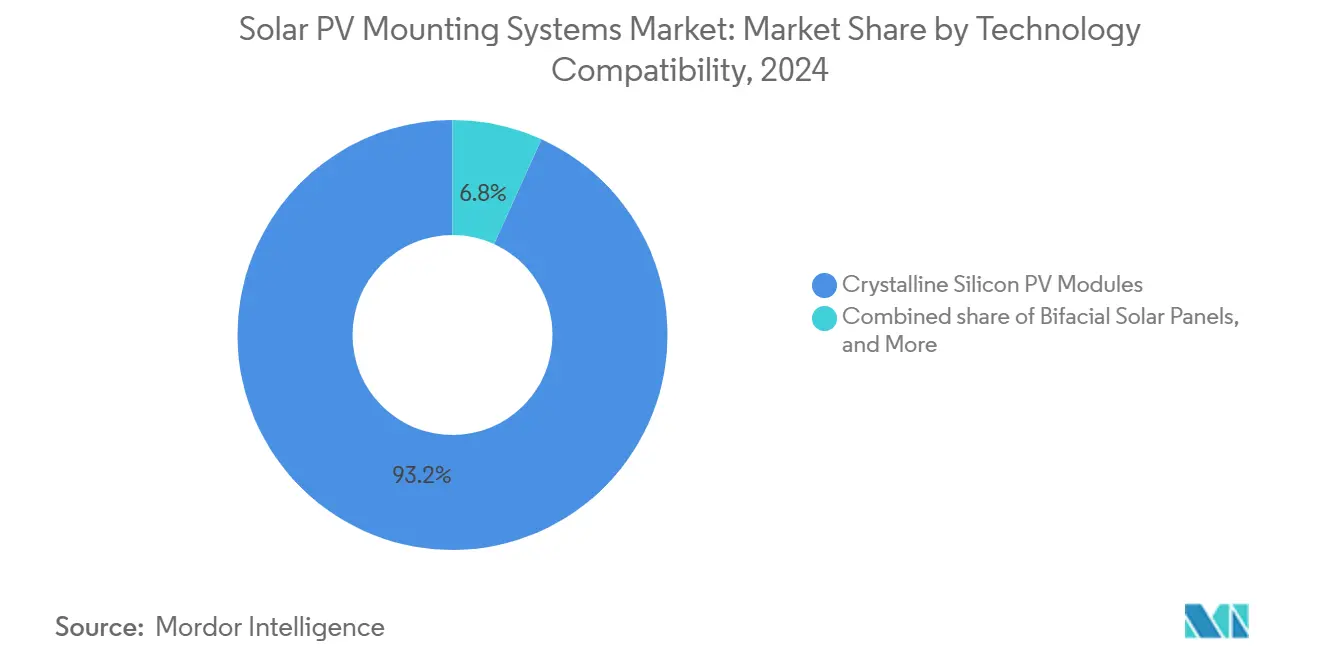
- By technology compatibility, crystalline silicon PV modules dominated with a share of 93.2% of the market in 2024, while bifacial solar panels are projected to grow the fastest, at a CAGR of 10.5% through 2030.
- By application, utility-scale installations accounted for a 54.0% slice of the solar PV mounting systems market size in 2024, yet floating solar is forecast to accelerate at a 15.7% CAGR by 2030.
- By end-user, utilities and IPPs represented 39.8% of 2024 installations; installers and integrators will record the strongest 5.9% CAGR amid industry consolidation.
- By geography, Asia-Pacific held 46.4% of the solar PV mounting systems market in 2024, while North America is anticipated to see the highest regional CAGR of 5.4% over 2025-2030.
Global Solar PV Mounting Systems Market Trends and Insights
Drivers Impact Analysis*
| Driver | (~) % Impact on CAGR Forecast | Geographic Relevance | Impact Timeline |
|---|---|---|---|
| Declining tracker & mounting hardware costs | 1.20% | Global; early gains in U.S., China, India | Medium term (2-4 years) |
| Policy incentives via IRA & EU Green Deal | 1.80% | North America, EU; spill-over to Asia-Pacific | Short term (≤ 2 years) |
| Surge in bifacial & large-format modules | 0.90% | Global; utility-scale projects | Medium term (2-4 years) |
| Agrivoltaic-ready adjustable structures | 0.60% | Asia-Pacific core; expanding to North America, EU | Long term (≥ 4 years) |
| Typhoon-grade elevated systems | 0.40% | Southeast Asia, Caribbean, Pacific Islands | Medium term (2-4 years) |
| Corporate sustainability mandates | 0.70% | Global; led by North America and EU | Short term (≤ 2 years) |
| Source: Mordor Intelligence | |||
Declining Tracker & Mounting Hardware Costs Drive Market Expansion
Manufacturing scale advantages pushed global tracker shipments to 92 GW in 2023 and are on track for 752 GW of cumulative additions over 2024-2030.[2]PV Tech, “2023 Global Tracker Shipment Ranking,” pv-tech.org U.S.-based GameChange Solar expanded domestic capacity to 35 GW annually while introducing haul-stow algorithms that cut operational risk. Nextracker’s low-carbon steel tracker trims embodied carbon by 35%, aligning with emerging procurement criteria.[3]Nextracker, “Low-Carbon Steel Tracker Launch,” nextracker.com These improvements strengthen the solar PV mounting systems market by lowering installed costs and boosting bankability.
Policy Incentives Accelerate Domestic Manufacturing and Deployment
The Inflation Reduction Act’s 45X credits plus a 10% domestic-content bonus propelled the first 100% U.S.-made tracker deliveries in December 2024. In Europe, the Net-Zero Industry Act and Solar Charter target 30 GW of manufacturing and require rooftop arrays on new buildings from 2026, adding 150-200 GW of demand. Mounting suppliers such as IronRidge and PanelClaw publish domestic-content playbooks, reinforcing localized supply chains that enlarge the solar PV mounting systems market.
Surge in Bifacial & Large-Format Modules Reshapes Mounting Requirements
Bifacial module penetration is reaching 90% within a decade, with up to 4.4% energy-yield gains over monofacial systems. Mounting heights, rear-side shading, and albedo optimization now dictate structural design. Companies deliver reinforced rails for 715 W large-format panels, addressing higher wind and snow loads while preserving micro-crack resistance.
Agrivoltaic-Ready Adjustable Structures Enable Dual Land Use
Elevated trackers allow simultaneous crop cultivation and solar generation, adding potential annual farm revenue of USD 142,000 from combined produce and electricity sales. Proprietary layout software such as GameChange Solar’s TopoSmart™ tailors designs to uneven terrain, aiding the solar PV mounting systems market in penetrating rural regions where agricultural stakeholders demand dual-use value.
Restraints Impact Analysis*
| Restraint | (~) % Impact on CAGR Forecast | Geographic Relevance | Impact Timeline |
|---|---|---|---|
| Steel & aluminum price volatility | −0.8% | Global; sharpest in emerging markets | Short term (≤ 2 years) |
| Land-acquisition constraints | −1.1% | North America, EU, India | Long term (≥ 4 years) |
| Insurance premium hikes for tracker faults | −0.6% | North America, Australia, severe-weather zones | Medium term (2-4 years) |
| Gear-motor/controller supply bottlenecks | −0.5% | Global; concentrated in Asia-Pacific supply hub | Short term (≤ 2 years) |
| Source: Mordor Intelligence | |||
Steel & Aluminum Price Volatility Pressures Project Economics
Commodity swings feed directly into mounting-system bills of materials, squeezing margins despite Section 232 tariff exemptions for many solar components. Producers diversify suppliers and trial composite substitutes, but price hedging remains limited, preserving near-term cost uncertainty for the solar PV mounting systems market.
Land-Acquisition Constraints Limit Large-Scale Development
Developers in India report difficulty stitching contiguous parcels over 100 MW, while one-third of U.S. siting applications have been canceled on community-opposition grounds. Solar parks with pre-approved land grow in popularity, though permitting delays still stretch project timelines and cap the addressable solar PV mounting systems market size.
*Our forecasts treat driver/restraint impacts as directional, not additive. The impact forecasts reflect baseline growth, mix effects, and variable interactions.
Segment Analysis
By Type: Tracking Systems Gain Momentum Despite Fixed Dominance
Fixed mounting systems retained a 60.9% share of the solar PV mounting systems industry in 2024, owing to cost-effective fixed-tilt popularity in rooftops; tracking mounting systems recorded the fastest 5.3% CAGR outlook. The segment’s growth links to 12-20% energy-production gains under standard climates.[4] Dual-axis variants, though pricier, deliver up to 45% output lifts in high-irradiance locations, sustaining niche demand.
Continued innovation, such as Array’s wireless SkyLink controls and automatic haul-stow protocols, removes reliability doubts, spurring hybrid portfolios that mix fixed and tracking across utility portfolios. Stepped terrain projects adopt OmniTrack™ lateral-adjust modules to bypass costly grading, shrinking civil works by nearly 20%. The solar PV mounting systems market benefits as developers swap fixed rows for trackers on land-rich sites.


By Material: Steel Growth Challenges Aluminum Supremacy
Aluminum captured 71.5% of 2024 installations due to light weight, corrosion resistance, and rooftop structural limits. Steel, however, is slated for a 6.2% CAGR through 2030 as ground-mount megaprojects prize tensile strength and lower upfront cost per ton.
Hybrid assemblies pair steel foundations with aluminum rails, blending weight savings and strength under larger 2×1.3 m modules. Galvanized iron remains a budget option with low labor costs, while fiber-reinforced polymers debut in coastal markets for salt-spray defense. These shifts diversify supply chains and broaden the solar PV mounting systems market.
By Technology Compatibility: Crystalline Silicon Dominance Faces Bifacial Disruption
Crystalline-silicon panels fitted over 93.2% of mounting shipments 2024, cementing economies of scale across the solar PV mounting systems market. Yet bifacial designs grow 10.5% annually, pushing manufacturers to raise clearance heights and minimize rear shading.
Glass-glass modules demand gentler clamping to prevent micro-cracks, prompting edge-grip solutions that leave the rear untouched. Thin-film maintains footholds in lightweight commercial roofs, where flexible laminates adhere directly without penetrative fixing. Adaptable hardware sustains the solar PV mounting systems industry’s resilience to technology shifts.
By Application: Floating Solar Disrupts Utility-Scale Leadership
Utility-scale projects held 54.0% of 2024 deployment, supported by falling tracker prices and streamlined procurement. Floating solar is projected to surge at a 15.7% CAGR, topping 77 GW by 2033 as reservoirs, mining pits, and hydropower dams host co-located PV arrays.
Water-borne systems can trim module temperatures by 5 °C, unlocking up to 4% yield improvements. Mooring, anchoring, and corrosion-proof fasteners become critical design parameters, stimulating specialized suppliers and enlarging the solar PV mounting systems market size for aquatic environments.
By End-user: Installer Integration Accelerates Market Consolidation
Utilities and IPPs owned 39.8% of 2024 volume, exploiting scale to secure bankable warranties. Installers and integrators will outpace at a 5.9% CAGR as vertical integration and M&A let them capture value across engineering, procurement, and construction.
Government and defense procurements apply typhoon-grade standards, opening high-specification niches. Commercial rooftops grow steadily under sustainability pledges, while residential uptake moderates amid higher borrowing costs, guiding the solar PV mounting systems market toward diverse demand centers.

Geography Analysis
Asia-Pacific retained a 46.4% solar PV mounting systems market share in 2024 and is advancing at a 5.1% CAGR to 2030. China alone installed more than 240 GW in 2024, relying on colossal tracker orders fulfilled by expanded domestic factories. India’s pathway to 500 GW catalytic capacity by 2030 widens demand for agrivoltaic-ready mounts across arid farmland. Regional policies also stimulate floating solar to mitigate land scarcity, with projects in Indonesia and the Philippines exceeding 100 MW each.
North America stands out for policy-induced reshoring. The Inflation Reduction Act’s domestic-content bonus pushes suppliers such as Nextracker to lift U.S. capacity to 4 GW annually. Land-use opposition and interconnection backlogs slow some projects, but community solar and corporate off-take deals keep installations robust. Canada’s provincial net-metering tweaks and Mexico’s distributed-generation cap adjustments maintain moderate growth in residential and C&I segments.
Europe’s Net-Zero Industry Act gears policy toward strategic autonomy, earmarking 30 GW of regional manufacturing by 2030 and enforcing rooftop mandates from 2026. France, Spain, and Germany pivot to tracker-based agrivoltaics to balance food security and clean-power goals. Eastern European members, meanwhile, adopt simplified permitting schemes that accelerate rooftop retrofits and add depth to the solar PV mounting systems market. South America, the Middle East, and Africa collectively contribute rising shares by courting local fabrication and giga-scale desert projects, diversifying supply chains beyond their historic Asia-centric base.


Competitive Landscape
The solar PV mounting systems market exhibits moderate concentration. Nextracker, Array Technologies, and GameChange Solar collectively hover near a 55-60% global share, leveraging integrated design, manufacturing scale, and robust balance-of-system software. Nextracker’s patented SmartTrack™ algorithms deliver up to 6% energy gains, while its low-carbon steel program appeals to investors with Scope 3 emission targets.
Array Technologies expanded vertically with its 2025 APA Solar acquisition, adding engineered foundations that unlock rocky-soil projects and broaden fixed-tilt offerings. GameChange Solar targets emerging regions, doubling Saudi capacity to 6 GW and executing a 450 MW Oman contract tied to green-ammonia ventures, emphasizing mass-manufacturing efficiency.
Second-tier players such as PV Hardware, Arctech, Soltec, and STI Norland vie on regional proximity, specialized floating frames, or dual-row trackers. M&A persists as private equity backs platform roll-ups like Enstall’s Schletter acquisition. In the solar PV mounting systems market, requirements for domestic content, ESG reporting, and extreme-weather resilience reshape competitive criteria from lowest-cost supply toward holistic risk, quality, and sustainability performance throughout the solar PV mounting systems industry.
Solar PV Mounting Systems Industry Leaders
Nextracker Inc.
Array Technologies Inc.
Arctech Solar Holding Co., Ltd.
Soltec Power Holdings
PVHardware (PVH)
- *Disclaimer: Major Players sorted in no particular order

Recent Industry Developments
- June 2025: GameChange Solar secured a 450 MWp Genius Tracker™ supply for Oman’s green-ammonia project.
- June 2025: Array Technologies acquired APA Solar Foundations for USD 179 million.
- June 2025: GameChange Solar doubled its Saudi tracker plant to 6 GW.
- May 2025: Nextracker posted USD 720 million Q1 FY2025 revenue on IRA-driven U.S. deliveries.


Global Solar PV Mounting Systems Market Report Scope
| Fixed Mounting Systems |
| Tracking Mounting Systems |
| Aluminum |
| Steel |
| Galvanized Iron |
| Others (Composites, Polymers) |
| Crystalline Silicon PV Modules |
| Thin-Film PV Modules |
| Bifacial Solar Panels |
| Others |
| Residential |
| Commercial and Industrial |
| Utility-Scale |
| Off-grid Applications |
| Floating Solar Installations |
| EPC Companies |
| Solar Project Developers |
| Installers and Integrators |
| Utilities and IPPs |
| Government and Defense |
| Others |
| North America | United States |
| Canada | |
| Mexico | |
| Europe | Germany |
| United Kingdom | |
| France | |
| Italy | |
| NORDIC Countries | |
| Russia | |
| Rest of Europe | |
| Asia-Pacific | China |
| India | |
| Japan | |
| South Korea | |
| ASEAN Countries | |
| Rest of Asia-Pacific | |
| South America | Brazil |
| Argentina | |
| Rest of South America | |
| Middle East and Africa | Saudi Arabia |
| United Arab Emirates | |
| South Africa | |
| Egypt | |
| Rest of Middle East and Africa |
| By Type | Fixed Mounting Systems | |
| Tracking Mounting Systems | ||
| By Material | Aluminum | |
| Steel | ||
| Galvanized Iron | ||
| Others (Composites, Polymers) | ||
| By Technology Compatibility | Crystalline Silicon PV Modules | |
| Thin-Film PV Modules | ||
| Bifacial Solar Panels | ||
| Others | ||
| By Application | Residential | |
| Commercial and Industrial | ||
| Utility-Scale | ||
| Off-grid Applications | ||
| Floating Solar Installations | ||
| By End-user | EPC Companies | |
| Solar Project Developers | ||
| Installers and Integrators | ||
| Utilities and IPPs | ||
| Government and Defense | ||
| Others | ||
| By Geography | North America | United States |
| Canada | ||
| Mexico | ||
| Europe | Germany | |
| United Kingdom | ||
| France | ||
| Italy | ||
| NORDIC Countries | ||
| Russia | ||
| Rest of Europe | ||
| Asia-Pacific | China | |
| India | ||
| Japan | ||
| South Korea | ||
| ASEAN Countries | ||
| Rest of Asia-Pacific | ||
| South America | Brazil | |
| Argentina | ||
| Rest of South America | ||
| Middle East and Africa | Saudi Arabia | |
| United Arab Emirates | ||
| South Africa | ||
| Egypt | ||
| Rest of Middle East and Africa | ||


Key Questions Answered in the Report
What is the projected value of the solar PV mounting systems market by 2030?
It is forecast to reach USD 55.14 billion, up from USD 43.89 billion in 2025.
Which region leads demand for mounting hardware?
Asia-Pacific held 46.4% of global installations in 2024 and remains the growth engine through 2030.
Why are tracking systems gaining share?
Single-axis trackers add 12-25% energy output and now benefit from lower hardware costs and advanced controls.
How fast will floating solar grow?
The segment is set for a 15.7% CAGR and should top 77 GW of capacity by 2033.
What drives steel demand in mounting structures?
Large ground-mount projects favor steel for strength and cost, supporting a 6.2% CAGR for the material segment.
How are policies influencing domestic production?
U.S. IRA and EU Net-Zero Act incentives spur manufacturers to open local plants and qualify for bonus tax credits.
Page last updated on:


