
Market Overview
| Study Period | 2021 - 2031 |
|---|---|
| Market Size (2026) | USD 461.11 Million |
| Market Size (2031) | USD 718.7 Million |
| Growth Rate (2026 - 2031) | 9.28 % |
| Fastest Growing Market | Asia Pacific |
| Largest Market | Europe |
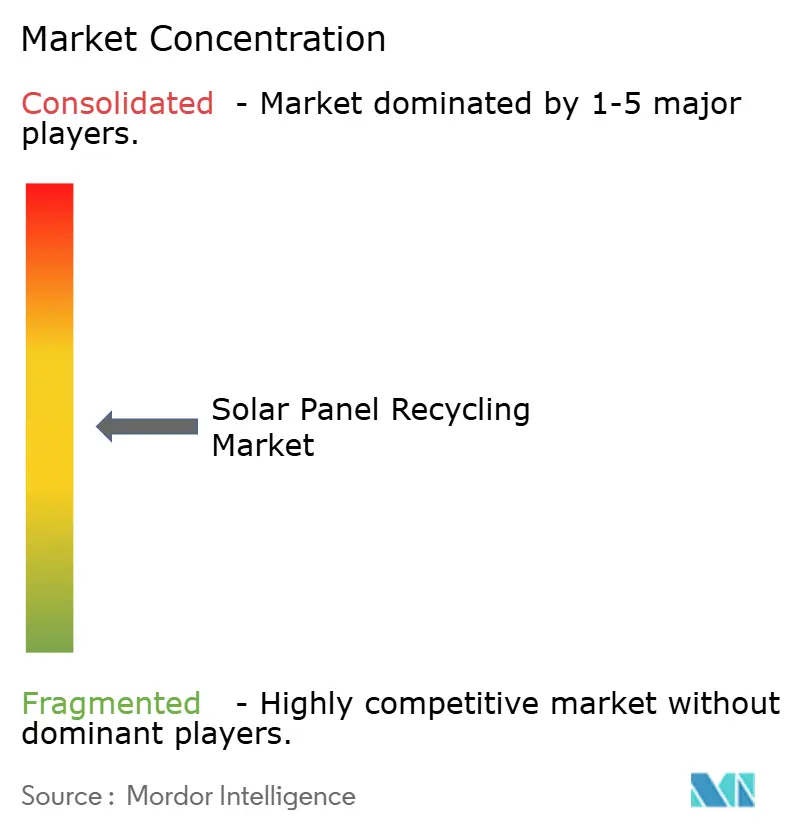
| Market Concentration | Medium |
Major Players *Disclaimer: Major Players sorted in no particular order Image © Mordor Intelligence. Reuse requires attribution under CC BY 4.0. | |
Solar Panel Recycling Market Analysis by Mordor Intelligence
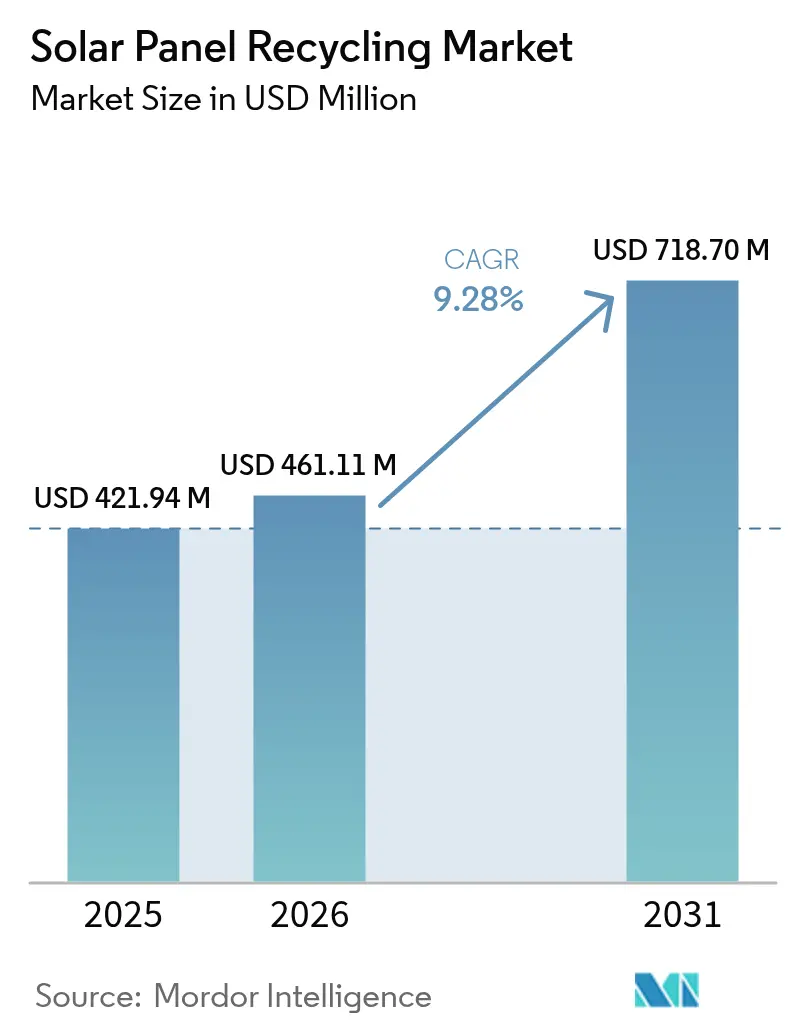
The solar panel recycling market size is expected to grow from USD 421.94 million in 2025 to USD 461.11 million in 2026 and is forecast to reach USD 718.7 million by 2031 at 9.28% CAGR over 2026-2031.
Legislative mandates, an approaching wave of first-generation module retirements, and surging commodity values are converging to reshape business models. Europe’s WEEE-based rules drive predictable material flows, while the United States is channeling Inflation Reduction Act incentives toward domestic recycling capacity. Mechanical processing currently dominates, yet precision laser systems are scaling rapidly as developers seek higher-purity silver and silicon recovery. Supply-chain reshoring further boosts demand for secondary critical minerals, and insurance-linked decommissioning funds are converting end-of-life compliance into a revenue-backed service line.
Key Report Takeaways
- By process, mechanical methods held 63.72% of the solar panel recycling market share in 2025, while laser technology is projected to expand at a 14.88% CAGR through 2031.
- By panel type, crystalline silicon accounted for an 88.34% share of the solar panel recycling market size in 2025; thin film is expected to grow at a 17.46% CAGR through 2031.
- By shelf life, normal-loss modules captured 72.45% of the solar panel recycling market share in 2025, whereas early-loss panels are projected to advance at a 13.52% CAGR through 2031.
- By material recovered, glass commanded a 55.85% share of the solar panel recycling market size in 2025, and silver recovery is projected to rise at a 13.07% CAGR through 2031.
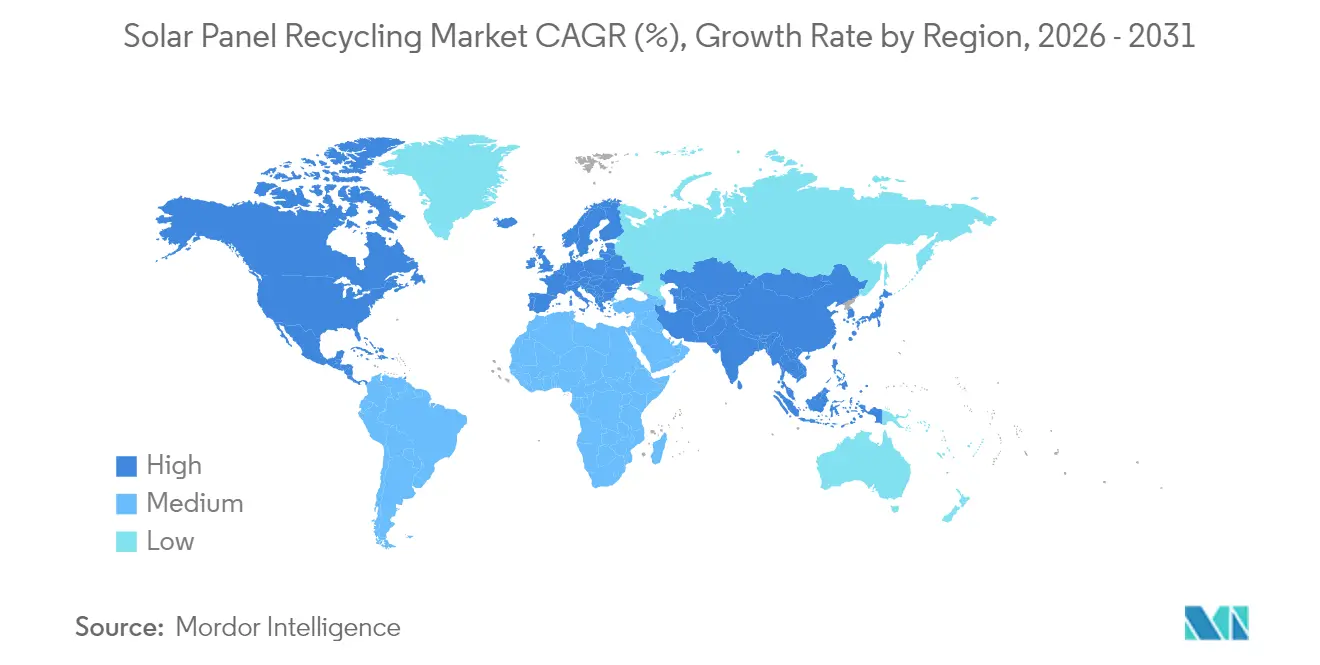
- By geography, Europe led the solar panel recycling market with a 38.15% share in 2025; the Asia-Pacific region is forecast to grow at a 15.92% CAGR between 2026 and 2031.
Note: Market size and forecast figures in this report are generated using Mordor Intelligence’s proprietary estimation framework, updated with the latest available data and insights as of 2026.
Global Solar Panel Recycling Market Trends and Insights
Drivers Impact Analysis*
| Driver | (~) % Impact on CAGR Forecast | Geographic Relevance | Impact Timeline |
|---|---|---|---|
| Wave of end-of-life PV modules, 2025-2030 | 2.80% | Europe, Asia-Pacific, North America | Medium term (2-4 years) |
| Global spread of WEEE-style mandates | 2.10% | Europe leading; North America, Asia-Pacific adopting | Long term (≥ 4 years) |
| Rising silver, indium and other mineral prices | 1.90% | Global, higher where advanced plants exist | Short term (≤ 2 years) |
| Mechanical-thermal hybrid cost reductions | 1.40% | North America, Europe, soon Asia-Pacific | Medium term (2-4 years) |
| Supply-chain reshoring of secondary minerals | 1.20% | Primarily North America and Europe | Long term (≥ 4 years) |
| Insurance-linked decommissioning funds | 0.80% | Early adoption in developed markets | Medium term (2-4 years) |
| Source: Mordor Intelligence | |||
Wave of End-of-Life PV Modules Hitting in 2025-2030
A quarter-century after the first feed-in-tariff boom, a surge of legacy arrays is approaching retirement. Italy expects 4.52 million t of PV waste by 2050, peaking near 2036 when early rooftop incentives reach obsolescence.[1] China, with 393 GW installed by 2022, anticipates 18 GW of discarded modules by 2030 and has established dedicated recycling working groups to address this stream.[2] Volume clustering reduces unit logistics costs and enables processors to amortize high-precision equipment, shifting the solar panel recycling market from waste disposal to value extraction.
EU-Style WEEE Compliance Mandates Expanding Worldwide
The European Union’s 85% collection and 80% material-recovery targets have become the default global template. Washington State’s producer-take-back law took effect in July 2025. South Carolina followed in 2024 with a registration regime for arrays bigger than 13 acres. Proposed U.S. federal universal-waste rules, slated for mid-2025, would harmonize interstate requirements. For investors, predictable compliance costs underpin multiyear recycling-plant paybacks, and for the solar panel recycling market, the mandates lock in recurring feedstock.
Rising Commodity Value of Silver, Indium & Other Critical Materials
Silver prices averaged USD 680/kg for photovoltaic paste in 2024.[3] The sector consumed 6,577 t—19% of global demand. Advanced electrodeposition now extracts 98.7% of silver from shredded cells. Indium scarcity is looming as heterojunction modules scale; recycling could cover a significant share of this metal that currently lacks domestic mining in the United States. Elevated metal values have pulled the solar panel recycling market into profitability even before accounting for avoided landfill fees.
Commercial-Scale Mechanical + Thermal Hybrid Processes Slash Recycling Costs
Traditional crushing recovers bulk glass but contaminates high-value metals. Hybrid lines now integrate mechanical frame removal, low-temperature thermal delamination, and precision pick-and-place robotics, enabling seamless integration of these processes. SOLARCYCLE reports 95% material-value recovery after deploying microwave-assisted delamination and AI quality control. Academic pilots using supercritical CO₂ achieve 96% recovery of glass and metals at lower energy intensity than gas-fired furnaces. These advances are redefining unit economics across the solar panel recycling market.
Restraints Impact Analysis*
| Restraint | (~) % Impact on CAGR Forecast | Geographic Relevance | Impact Timeline |
|---|---|---|---|
| Recycling cost still exceeds bulk-glass value | -1.80% | All markets, glass-price sensitive regions | Short term (≤ 2 years) |
| Patchy collection logistics | -1.40% | North America, emerging economies | Medium term (2-4 years) |
| Fragmented rooftop asset ownership | -1.10% | Residential-heavy markets globally | Long term (≥ 4 years) |
| Trans-boundary hazmat transport rules | -0.90% | Particularly strict in OECD economies | Medium term (2-4 years) |
| Source: Mordor Intelligence | |||
Recycling Cost Still Exceeds Value of Recovered Bulk Glass
Glass accounts for two-thirds of a panel’s mass, yet it offers minimal resale value. The cost to recycle a module can range from USD 15 to USD 45, compared to USD 2 for landfill dumping.[4] Pilot projects in Europe, however, have produced flat glass that meets PV-grade specifications, hinting that premium, low-carbon glass could close the gap. In the near term, subsidies and ecodesign rules remain essential for the glass fraction of the solar panel recycling market.
Patchy Collection Logistics & Reverse-Supply Networks
Many jurisdictions lack standardized pick-up nodes, especially for scattered rooftop arrays. Simulation studies in New South Wales indicate that network optimization can reduce costs by up to 37%, but initial capital expenditures are substantial. Europe’s PV CYCLE has demonstrated mobile shredders that travel to regional depots, offering a blueprint others may adopt. Until the infrastructure densifies, fragmented logistics will continue to hinder the solar panel recycling market.
*Our forecasts treat driver/restraint impacts as directional, not additive. The impact forecasts reflect baseline growth, mix effects, and variable interactions.
Segment Analysis
By Process: Precision Lasers Challenge Mechanical Incumbents
Mechanical shredding held a 63.72% market share in the solar panel recycling market in 2025, favoured for its low capital expenditure and proven throughput. Yet laser-enabled delamination is growing at 14.88% CAGR, leveraging femtosecond pulses to detach cells without melting solder, thereby preserving silver purity. The solar panel recycling market size for laser lines is expected to triple as NREL results move from pilot to commercial adoption. Hybrid flowsheets that begin with frame removal and conclude with laser or thermal delamination now exhibit recovery rates approaching 95%, shrinking the cost gap with raw-material imports.Second-generation facilities increasingly couple machine-vision sorters with robotic grippers, reducing hands-on labor by half and enhancing operator safety. Mechanical platforms continue to handle glass and aluminum disassembly efficiently, particularly for utility-scale inventories. The coexistence of bulk-volume and precision-value streams illustrates the solar panel recycling market’s transition from a single-technology service to a diversified process portfolio optimized for a mix of feedstocks.
By Panel Type: Crystalline Dominance Meets Thin-Film Upswing
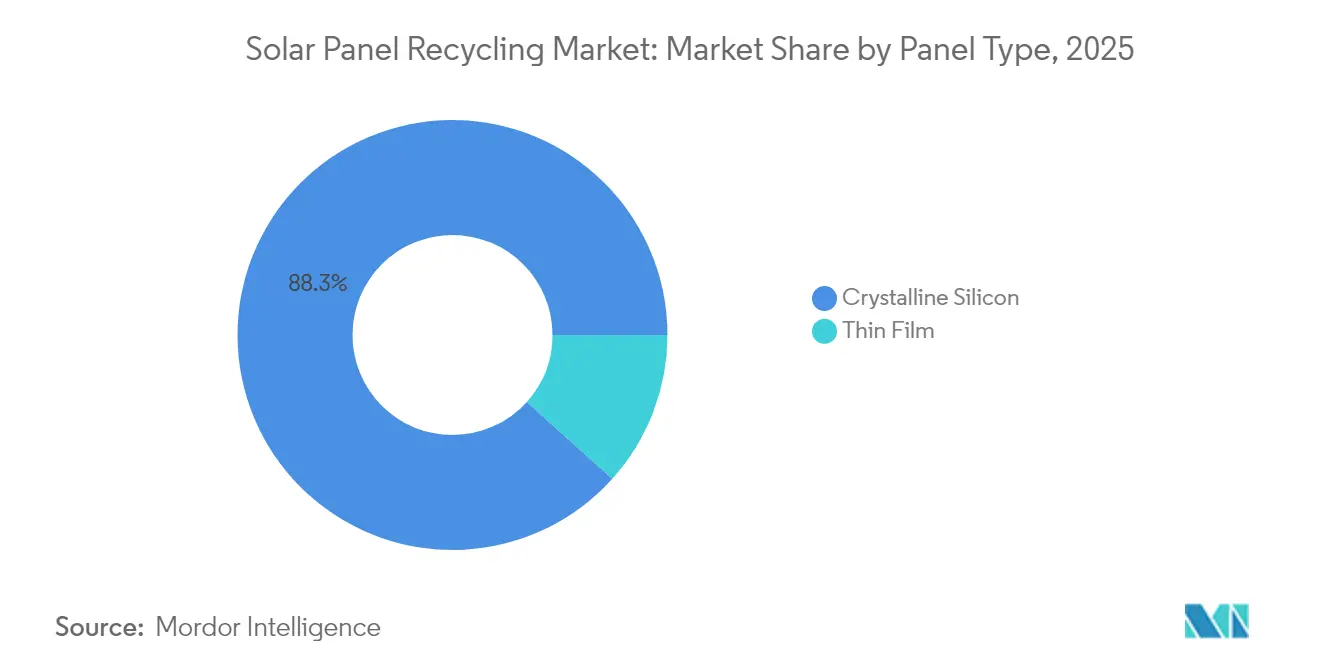
Crystalline silicon modules accounted for 88.34% of 2025 waste inflows, thereby anchoring the solar panel recycling market size for that category. Thin-film volumes remain modest but are forecast to grow at an 17.46% CAGR as CIGS and CdTe deployments rise, especially in utility segments. First Solar’s global network, which has recycled nearly 400,000 tons of CdTe modules, showcases a 95% material recovery rate and sets a benchmark that other thin-film firms aim to match.
The economics diverge sharply: crystalline paths emphasise silver and wafer reclamation, whereas thin-film streams target tellurium, cadmium, and indium. Specialized leaching and electro-winning can now retrieve 52% or more indium within 48 hours, thereby limiting raw-material supply risk for next-generation heterojunction lines. As module diversity grows, so will tailored facilities, adding complexity but also revenue depth to the solar panel recycling market.

By Shelf Life: Early-Loss Streams Gain Strategic Weight
Normal-loss panels, which have exceeded 25 years of service, still make up 72.45% of volumes, underscoring how classic degradation influences the solar panel recycling market share. Early-loss panels, those younger than 10 years, which are frequently replaced for efficiency upgrades or storm damage, will experience a 13.52% CAGR growth. These younger units often retain high-grade cells suitable for refurbishment or secondary sales before final material recovery.
Insurers influence this sub-market by dictating repair-versus-replace decisions post-hail or hurricane events. Infrared thermography and EL imaging are now standard triage tools that direct modules into reuse, resale, or recycling funnels. This diagnostic layer is steering the solar panel recycling market toward a service stack spanning assessment, refurbishment, and high-value recycling.
By Material Recovered: Glass Volume, Silver Value
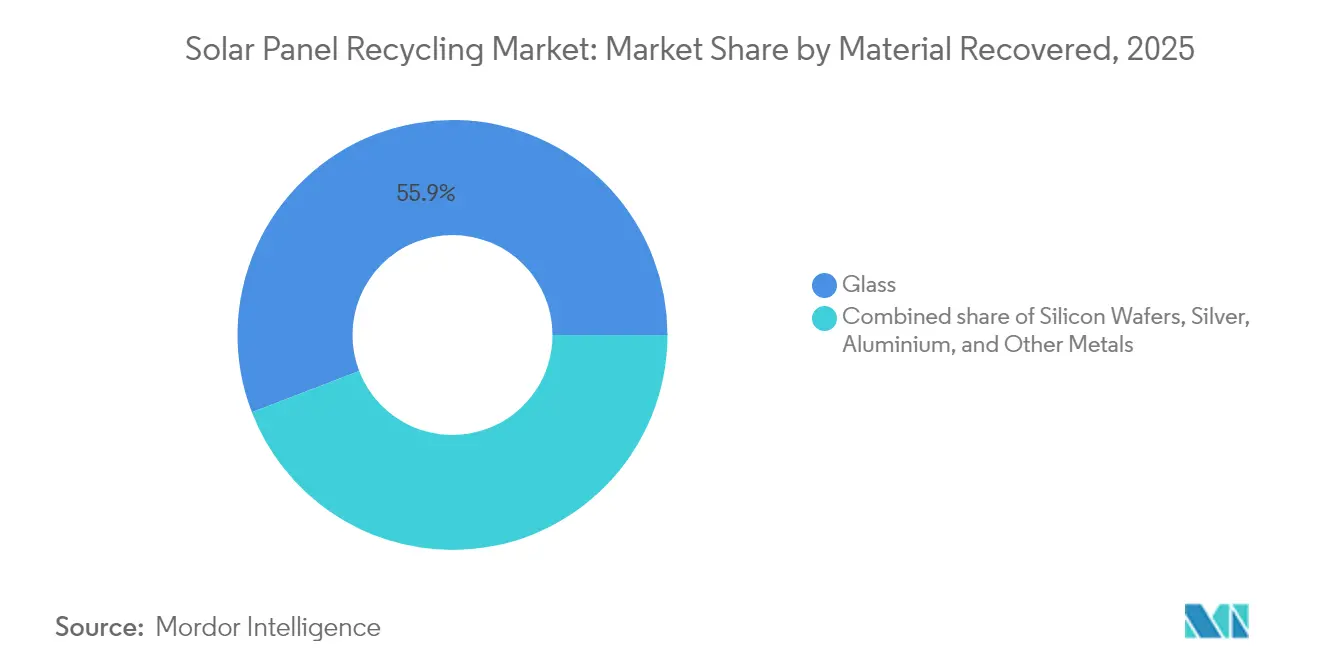
Glass accounted for 55.85% of the 2025 tonnage, yet revenue primarily flowed from silver, whose recovery segment is projected to grow at a 13.07% CAGR. Innovations like salt-etching in molten hydroxide reclaim 99% of silver and 98% of silicon while cutting carbon intensity. Concurrently, closed-loop glass lines in Georgia aim to feed 5-6 GW of new modules annually with recycled sheet, boosting the solar panel recycling market size for glass by attaching a low-carbon premium.
New two-step leaching methods yield 99% aluminum, followed by 99.9% silver of high purity. By integrating multi-metal flows into single facilities, operators reduce waste streams and increase ROIC, reinforcing a value-based hierarchy throughout the solar panel recycling market.
Geography Analysis
Europe controlled 38.15% of the solar panel recycling market in 2025, primarily due to the implementation of mandatory 85% collection and 80% recovery thresholds under the WEEE Directive. Germany forecasts 400,000-1 million t of PV waste by 2030, catalysing capacity expansions aligned with the Ecodesign Directive’s stricter recyclability criteria. Cross-border collaborations, such as AGC Glass Europe partnering with ROSI on ultra-low-carbon glass, exemplify industrial alignment with circular-economy policy.
Asia-Pacific is set for a 15.92% CAGR as China’s 393 GW installed base translates into the world’s largest end-of-life pool. CP-funded working groups are drafting national standards, and pilot plants in Jiangsu and Shanxi are scaling mechanical-thermal hybrids to industrial levels. India’s draft rules propose viability-gap funding for recyclers and mandatory waste reporting, measures expected to unlock investment once adopted. Japan’s reserve-fund policy secures financing for recycling and land restoration, providing a replicable model for the region.
North America benefits from the Inflation Reduction Act's tax credits, which treat recycled metals as domestic content. Washington State’s 2025 take-back law and South Carolina’s 2024 siting rules add sub-national certainty. Federal universal-waste designation, anticipated in 2025, would streamline interstate flows. SOLARCYCLE’s USD 344 million Cedartown plant is emblematic of private-sector confidence, capable of processing 10 million modules per year and supplying 5-6 GW of recycled glass
Regulatory Landscape
Policy frameworks increasingly define collection volumes, permissible handling pathways, and the economics of recovery. In the European Union, photovoltaic modules fall under the WEEE Directive framework with mandated targets (85% collection and 80% material recovery), and Directive (EU) 2024/884 requires the European Commission to assess whether WEEE 2012/19/EU needs revision by December 31, 2026, including the possibility of a dedicated PV category separate from large equipment. In the United States, end-of-life PV is handled mainly through state-level requirements, including Washington State's producer-take-back law effective July 2025 and New Jersey's S3399 (signed January 2026), which uses a mandatory recycling approach that differs from typical EPR structures.
North American rules are also moving toward reclassifying PV modules to streamline compliance and logistics. The US EPA has been developing a proposed RCRA pathway to add end-of-life solar panels to the federal universal waste program (40 CFR Part 273), while California continues to manage PV modules through its DTSC universal waste framework and is considering AB-864 (2025-2026) to develop alternative management standards aimed at improving material recovery. Canada adds another anchor, with Alberta Recycling Management Authority confirming a provincial solar recycling program launch on October 1, 2026, supported by an environmental fee structure (draft CAD 14 per module of 1 square metre or larger), signaling a shift toward fee-funded collection and processing capacity.
Competitive Landscape
The solar panel recycling market remains fragmented, with no firm exceeding a 10% share, yet consolidation is underway. SOLARCYCLE leads North American innovation, pairing 95% value recovery with forward contracts from Canadian Solar and Q-Cells. First Solar operates five global plants focused on thin-film CdTe recycling, achieving 95% recovery, which reinforces its cradle-to-cradle strategy and strengthens regional circular supply chains.
OnePlanet’s USD 90 million Florida facility integrates AI vision and robotics to achieve a 97% metal reclamation rate, illustrating how automation is raising performance benchmarks. European specialists such as ROSI target high-purity silver and silicon feedstock for domestic wafer plants, while Veolia continues to scale mechanical lines across France and the United Kingdom. Patent filings cluster around laser delamination, supercritical CO₂ extraction, and salt-etching, indicating that technological IP is the new moat in the solar panel recycling market.
Solar Panel Recycling Industry Leaders
-
Veolia Environnement SA
-
First Solar Inc.
-
PV Cycle
-
Reclaim PV Recycling Pty Ltd
-
ROSI Solar
- *Disclaimer: Major Players sorted in no particular order
Market Opportunities and Future Outlook
Industrial-scale capacity additions and automation create room for regional hubs that reduce reverse-logistics costs and improve feedstock certainty. In the United States, SOLARCYCLE starting operations at its Cedartown, Georgia, facility in January 2026 (255,000 sq ft) offers a visible template for high-throughput plants tied to domestic manufacturing inputs, with targeted ramp milestones communicated for panels processed and recycled-glass output. Comstock Metals also expanding recycling and logistics infrastructure through a Cambridge, Ohio hub announcement (June 2026) and subsequent commissioning of front-end robotic loading and conveyance systems (July 2026) underscores the investment focus on pre-processing efficiency, sorting, and handling, which can be replicated near large installed bases to reduce transport intensity.
Policy-driven procurement and tender mechanisms can also provide structured access to volumes, particularly in Europe where WEEE obligations already anchor collection and recovery performance. France's Soren selection of multiple industrial operators for PV module recycling capacity (combined capacity exceeding 45,000 metric tons per year, March 2026) shows how compliance schemes can allocate tonnage and underwrite capacity utilization. Opportunity is also clustering around higher-value recovery pathways, where advances in recovery rates for critical components (for example, high silicon recovery reported by technology developers in 2026) support premium-grade outputs for secondary materials markets. This direction aligns with the EU Ecodesign for Sustainable Products Regulation (Regulation 2024/1781/EU), which is phasing in requirements around repairability and recyclability and encourages recyclers and OEMs to integrate design-for-recycling and closed-loop material specifications.
Recent Industry Developments
- July 2026: Comstock Metals integrated and commissioned front-end robotic loading and conveyance systems at its industrial-scale solar panel recycling facility. The upgrade advances automated handling and throughput, strengthening the case for regional hubs that reduce labor intensity and improve consistency in pre-processing before higher-value separation steps.
- March 2026: France's compliance organization Soren selected six industrial operators, including First Solar and ROSI, to manage end-of-life PV panel recycling with combined annual capacity exceeding 45,000 metric tons. The tender-based allocation mechanism formalizes national capacity build-out and improves route-to-volume visibility for processors operating under WEEE-driven obligations.
- June 2025: PV CYCLE reported collecting and managing 17,416 tonnes of photovoltaic panels in 2024, as disclosed in its 2024 annual reporting. The data point shows how established take-back networks translate mandates into measurable material flows that support investment planning for downstream recycling capacity.
Research Methodology Framework and Report Scope
Market Definition and Coverage
This market covers the revenue earned from services that collect, transport, dismantle, and process end-of-life solar PV panels so usable materials can be recovered, treated, and routed back into industrial value chains.
Scope exclusions: We exclude the sale of new solar panels, routine O&M services, and general e-waste handling that is not linked to PV module recycling.
Segmentation Overview
- By Process
- Thermal
- Mechanical
- Laser
- By Panel Type
- Crystalline Silicon
- Thin Film
- By Shelf Life
- Normal Loss (Above 25 yr)
- Early Loss (Below 10 yr)
- By Material Recovered
- Glass
- Silicon Wafers
- Silver
- Aluminium
- Other Metals (Cu, Indium, etc.)
- By Geography
- North America
- United States
- Canada
- Mexico
- Europe
- Germany
- United Kingdom
- France
- Italy
- NORDIC Countries
- Russia
- Rest of Europe
- Asia-Pacific
- China
- India
- Japan
- South Korea
- ASEAN Countries
- Rest of Asia-Pacific
- South America
- Brazil
- Argentina
- Rest of South America
- Middle East and Africa
- Saudi Arabia
- United Arab Emirates
- South Africa
- Turkey
- Rest of Middle East and Africa
- North America
Data Sources, Market Sizing, and Validation
Desk Research
Desk research was used to build the fact base around installed solar PV capacity, expected retirements, and the rules that shape take-back and recycling. We referred to public sources such as the International Energy Agency (IEA), IRENA, the US EPA, Eurostat, and UN Comtrade to understand capacity additions, waste streams, and cross-border movement of related materials.
To make assumptions practical, we also reviewed recycler and solar industry association websites, peer-reviewed articles on PV waste composition and recovery yields, and company filings and investor decks where recycling activity is described. For cross-checks on corporate activity, we used paid subscriptions for company financials and business intelligence, alongside patent databases to spot process changes that can impact recovery value. These examples are not exhaustive, and many other public documents and releases were also used for data collection, validation, and clarification.
Primary Interviews and Surveys
Primary work focused on validating how panels flow into recycling, what pricing is common for collection and processing, and how recovery economics differ by module type and age. We spoke with recyclers, compliance and stewardship stakeholders, logistics partners, and downstream material buyers across APAC, EMEA, and the Americas, so desk research assumptions could be tested and then refined.
Distribution of primary research fieldwork respondents
| Company type | Respondent position | Region |
|---|---|---|
| Top tier: 39% | CXOs: 16% | APAC: 38% |
| Mid tier: 44% | Functional/Unit leaders: 39% | EMEA: 37% |
| Smaller Players: 17% | Managers: 45% | Americas: 25% |
Market-Sizing & Forecasting
Our model starts from a top-down demand pool that is rebuilt from the installed PV base and retirement timing, and it is then converted into recycle-eligible volumes after considering collection pathways and regulatory pull. To keep totals realistic, results are corroborated through selective bottom-up approximations, such as sampled facility capacity checks, ASP-by-service benchmarks (collection, dismantling, material recovery), and volume-to-revenue sanity checks from interview inputs.
Key inputs used in the model include cumulative PV installations by region, expected end-of-life volumes by typical module life and early replacement rates, the split of crystalline silicon versus thin film panels, average panel weight and recoverable material mix (glass, aluminum, silicon, and metals), and observed recycling and transportation fee ranges. When data is thin for smaller countries, gaps are handled using proxy adoption indicators (solar deployment trend and policy maturity) and then normalized against regional waste and capacity signals.
For forecasting, we mainly used scenario analysis supported by simple regression-style sensitivity on installation growth and retirements, because the market can shift quickly with policy enforcement, landfill restrictions, and changes in recovered-material pricing. Assumptions were reviewed with experts and adjusted so the final time series stays consistent with the physical waste pipeline and the service revenue that can be earned from it.
Data Validation & Update Cycle
Validation is done through repeated triangulation across independent signals, including PV installation series, expected retirements, recycler capacity announcements, and observed service pricing ranges. When outliers appear, the drivers are rechecked, the math is walked through again, and follow-up calls are triggered to confirm what changed on the ground.
Before sign-off, the full workbook is reviewed in multiple steps so assumptions, units, and currency conversions stay consistent across regions and years. Reports are refreshed annually, and interim updates are added when material events occur (for example, a major policy shift or a sharp change in recovered material value). Right before delivery, a final analyst pass is completed so clients receive the most current view available at that time.
Mordor Intelligence's Solar Panel Recycling Market Size Measured Against Other Published Estimates
It is normal to see different market sizes for solar panel recycling, even when the same topic is being discussed. The gaps usually come from how each publisher treats the value chain, which years are used as the base, and how panel retirements are converted into paid recycling activity.
Some estimates expand the scope to include broader solar PV waste management and informal disposal handling, and then apply a single revenue factor to the full waste stream. In Mordor Intelligence, revenues are counted only for recycling services tied to PV modules and are built from recycle-eligible volumes and service pricing checks, which reduces double counting when panels are diverted or handled outside formal recycling.
Benchmark comparison
| Source | Market Size | Gaps in Research Methodology |
|---|---|---|
| Mordor Intelligence | USD 461.11 M (2026) | |
| Industry Research House A | USD 404.60 M (2026) | Uses a volume recycled multiplied by an averaged revenue-per-unit approach, which can understate regions where compliance costs lift service pricing and where higher-value recovery routes are used. |
| Market Tracker B | USD 288.32 M (2025) | Base year and forecast window differ, and the coverage appears to lean on earlier-stage recycling adoption assumptions, which can lower implied collection rates and delay revenue recognition. |
The table shows that year selection and how recycle-eligible volumes are defined drive most of the spread, followed by how pricing and recovery value are treated. By keeping the build-up tied to the physical retirement pipeline and then checking it against real-world service pricing signals, we can provide a number that is easier to trace and repeat when the market shifts.
Key Questions Answered in the Report
What is the projected global value of solar panel recycling in 2031?
The activity is forecast to reach USD 718.7 million, up from USD 461.11 million in 2026.
Which region is expected to expand fastest in solar panel recycling between 2026-2031?
Asia-Pacific is set to post a 15.92% CAGR, led by China’s large installed base and emerging policy frameworks in India and Japan.
How do laser-based processes improve recovery from retired photovoltaic modules?
Femtosecond lasers separate cell layers without thermal damage, boosting silver purity and helping operators achieve up to 95% total material-value extraction.
Why are insurance-linked decommissioning funds reshaping end-of-life management for solar assets?
Reserve requirements make recycling a contractual obligation, guaranteeing feedstock for recyclers and reducing liability for financiers and project owners.
What proportion of discarded modules are crystalline silicon today?
Crystalline silicon accounts for about 88.34% of units reaching end of life, reflecting its dominance in historical installations.
How does recycling strengthen supply-chain security for critical minerals such as silver?
Recovered metals provide domestic secondary supply, qualifying for clean-energy incentives and reducing exposure to geopolitical sourcing risks.