Flavored Water Market Size and Share
Market Overview
| Study Period | 2021 - 2031 |
|---|---|
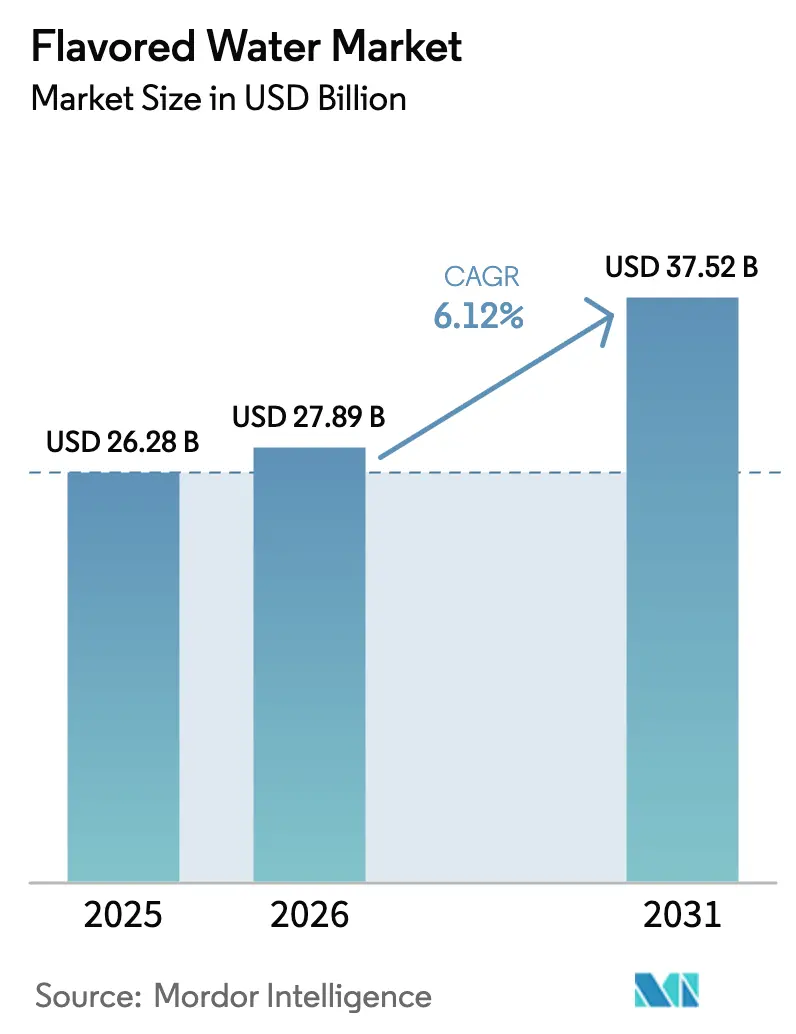
| Market Size (2026) | USD 27.89 Billion |
| Market Size (2031) | USD 37.52 Billion |
| Growth Rate (2026 - 2031) | 6.12% CAGR |
| Fastest Growing Market | Asia Pacific |
| Largest Market | North America |
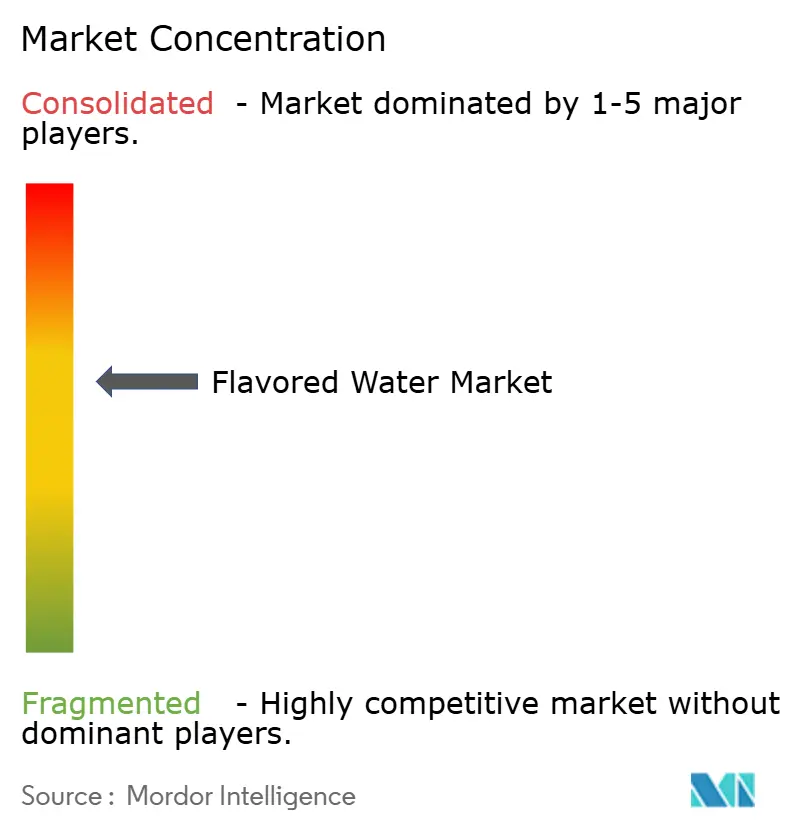
| Market Concentration | Medium |
Major Players *Disclaimer: Major Players sorted in no particular order Image © Mordor Intelligence. Reuse requires attribution under CC BY 4.0. | |
Flavored Water Market Analysis by Mordor Intelligence
The flavored water market size was valued at USD 26.28 billion in 2025 and estimated to grow from USD 27.89 billion in 2026 to reach USD 37.52 billion by 2031, at a CAGR of 6.12% during the forecast period (2026-2031). The market expansion reflects consumers' shift toward healthier hydration options that balance taste and wellness. Flavored water serves as an alternative between plain bottled water and sugar-sweetened beverages, offering hydration, functional benefits, and taste satisfaction while maintaining lower caloric content than traditional soft drinks. The market growth is supported by increasing health awareness among consumers, particularly regarding sugar intake and artificial ingredients. Manufacturers are responding by developing innovative flavor combinations and incorporating natural ingredients, vitamins, and minerals. The rise of premium and functional flavored water variants, including those with added electrolytes, antioxidants, and botanical extracts, is attracting consumers seeking enhanced hydration benefits.
Key Report Takeaways
- By product type, the sparkling segment held 52.10% of the flavored water market share in 2025 and is projected to grow at an 7.78% CAGR during 2026-2031.
- By flavor, citrus flavors dominated with a 28.40% market share in 2025, while botanical/herbal variants are expected to grow at a 7.45% CAGR through 2031.
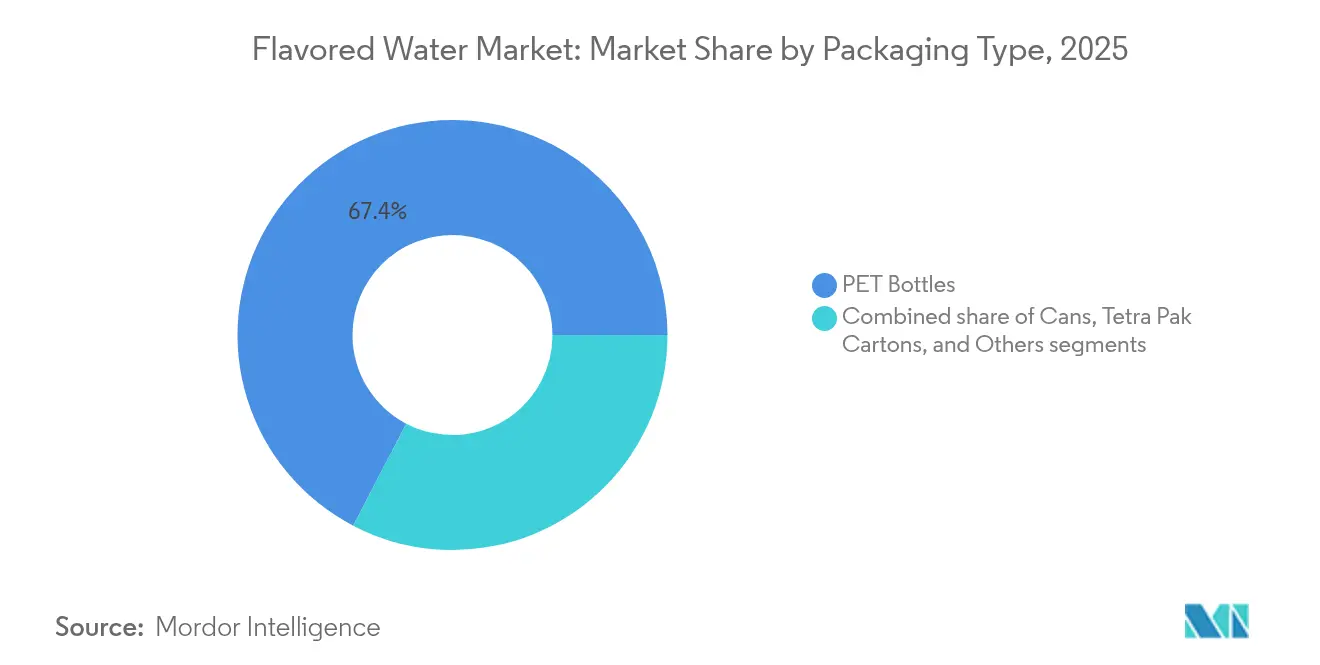
- By packaging type, PET bottles accounted for 67.35% of the flavored water market in 2025, with cans showing the highest growth rate at 8.05% CAGR during the forecast period.
- By distribution channel, off-trade distribution channels represented 55.90% of the market in 2025, while on-trade channels are growing at a 7.26% CAGR through 2031.
- By geography, North America dominated the market with a 32.85% share in 2025, while Asia-Pacific is growing at the fastest rate with a 7.21% CAGR through 2031.
Note: Market size and forecast figures in this report are generated using Mordor Intelligence’s proprietary estimation framework, updated with the latest available data and insights as of 2026.
Global Flavored Water Market Trends and Insights
Drivers Impact Analysis*
| Driver | (~) % Impact on CAGR Forecast | Geographic Relevance | Impact Timeline |
|---|---|---|---|
| Health-driven shift from sugary sodas | +1.8% | Global, strongest in North America and Europe | Medium term (2-4 years) |
| Premiumization and flavor innovation | +1.2% | North America, Europe, Asia-Pacific urban centers | Long term (≥ 4 years) |
| Rapid growth of functional and fortified waters | +1.0% | Asia-Pacific, North America | Medium term (2-4 years) |
| Eco-friendly packaging as a differentiator | +0.8% | Europe, North America, spill-over to Asia-Pacific | Long term (≥ 4 years) |
| Preference for low-/no-calorie and sugar free beverages | +0.7% | Global, led by developed markets | Short term (≤ 2 years) |
| Clean label and natural ingredients | +0.6% | North America, Europe, Asia-Pacific premium segments | Medium term (2-4 years) |
| Source: Mordor Intelligence | |||
Health-driven shift from sugary sodas
Consumer migration from traditional carbonated soft drinks to flavored water represents a structural market transformation in the beverage industry. Health-conscious consumers increasingly demonstrate willingness to pay premium prices for perceived health benefits, particularly in products with functional ingredients and natural formulations. This consumer behavior creates positive spillover effects for flavored water positioned as natural, low-calorie alternatives to conventional sodas. The transformation extends beyond individual preferences, as major beverage companies adapt their product portfolios to meet evolving consumer demands. PepsiCo's commitment to reducing added sugars across 75% of its global portfolio by 2030 reflects the industry's recognition that health-focused products drive long-term growth. This shift continues to strengthen as younger consumers, particularly millennials and Generation Z, view hydration as a wellness investment rather than a basic necessity. The trend has prompted beverage manufacturers to innovate with enhanced water products, incorporating vitamins, minerals, and functional ingredients to capture this growing market segment.
Premiumization and flavor innovation
Premium flavor profiles transform flavored water from a commodity to a lifestyle product, enabling higher margins and brand differentiation. Complex taste combinations and unique flavor pairings allow manufacturers to command premium prices while establishing distinct market positions. Consumer perception of premium flavored water as a sophisticated beverage choice further supports this market evolution. Topo Chico Sabores increased household penetration by over 20% after launch, showing how flavor innovation drives market share in premium segments. The brand's success demonstrates the strong consumer response to well-executed premium flavor strategies and validates the market potential for elevated taste experiences in the flavored water category. Moreover, botanical and herbal flavors represent the fastest-growing segment, reflecting consumer demand for functional ingredients such as adaptogens and natural wellness compounds. These ingredients appeal to health-conscious consumers seeking both flavor and functionality. The integration of these natural compounds allows brands to differentiate their products while addressing growing consumer interest in holistic wellness.
Rapid growth of functional and fortified waters
The positioning of functional water emphasizes its role in wellness rather than basic hydration, creating opportunities for products with health benefits. Waters enhanced with vitamins, minerals, and electrolytes are expected to experience substantial growth during 2025-2030. The U.S. Food and Drug Administration allows structure/function claims for conventional foods without pre-approval, enabling manufacturers to promote hydration and vitamin benefits while adhering to disease claim regulations[1]Source: U.S. Food & Drug Administration, “Structure/Function Claims Guidance,” fda.gov. This regulatory environment benefits companies that can substantiate their health claims. In Mexico, consumers show a preference for natural product claims, demonstrating regional demand for functional beverages. Market research indicates that consumers primarily purchase functional waters for hydration and vitamin intake, supporting health-focused positioning strategies.
Eco-friendly packaging as a differentiator
Sustainable packaging has become essential for regulatory compliance and market differentiation, with aluminum cans experiencing the highest growth rate. Aluminum cans demonstrate the highest growth rate among packaging materials due to their recyclability and alignment with circular economy principles. Ball Corporation demonstrated this trend by shipping 107 billion aluminum packaging units in 2023 and setting a target of 85% recycled content by 2030. The beverage industry generates 1.5 billion tons of CO2e emissions annually, with raw materials and packaging contributing 58%, making sustainable packaging critical for emissions reduction goals. Coca-Cola's progress toward sustainability includes achieving 90% recyclable packaging in 2023, with plans for 100% by 2025, and increasing recycled content from 27% to 50% by 2030. These sustainability initiatives enable companies to establish premium market positions while meeting environmental regulations and consumer expectations.
Restraints Impact Analysis*
| Restraint | (~) % Impact on CAGR Forecast | Geographic Relevance | Impact Timeline |
|---|---|---|---|
| Intense competition from alternative beverages | -0.9% | Global, particularly North America | Short term (≤ 2 years) |
| Consumer skepticism over functional and health claims | -0.6% | North America, Europe | Medium term (2-4 years) |
| Regulatory and compliance complexities | -0.5% | Global, varying by jurisdiction | Long term (≥ 4 years) |
| Price sensitivity relative to alternatives | -0.4% | Emerging markets, price-conscious segments | Short term (≤ 2 years) |
| Source: Mordor Intelligence | |||
Intense competition from alternative beverages
The flavored water market faces increased fragmentation as energy drinks, kombucha, and functional beverages compete for health-conscious consumers. Companies are expanding their product portfolios, with Talking Rain launching Popwell prebiotic lines and Coca-Cola introducing Simply Pop to compete with Olipop and Poppi. This market evolution has led to pressure on flavored water profit margins and necessitated higher marketing expenditure to maintain product differentiation. The North American market experiences significant competitive pressure due to its maturity and the influx of premium alternatives. Enhanced waters in this region show slower growth compared to Asia-Pacific, primarily due to competition from lower-priced flavored water options. The acquisition of specialized brands, such as Spindrift by Gryphon Investors in January 2025, has further intensified market dynamics by bringing additional capital and industry expertise to niche segments.
Consumer skepticism over functional and health claims
The functional water market faces significant barriers due to regulatory oversight and consumer awareness. The U.S. Food and Drug Administration requires manufacturers to support structure/function claims with reliable scientific evidence, resulting in increased compliance costs and restricted marketing options[2]Source: U.S. Food & Drug Administration, “Guidance for Industry: Substantiation for Dietary Supplement Claims Made Under Section 403(r) (6) of the Federal Food, Drug, and Cosmetic Act,” fda.gov. As health claims become more prevalent across beverages, consumers have grown increasingly skeptical, compelling companies to invest in clinical research and independent verification to establish credibility. This scrutiny is particularly evident in developed markets, where informed consumers demand scientific validation of functional benefits. While younger consumers show greater receptivity to functional waters, they require clear ingredient information, and premium pricing remains challenging when consumers question product effectiveness. Companies with scientifically validated claims and strong regulatory compliance capabilities gain competitive advantages, while those lacking proper substantiation face market challenges.
*Our forecasts treat driver/restraint impacts as directional, not additive. The impact forecasts reflect baseline growth, mix effects, and variable interactions.
Segment Analysis
By Product Type: Sparkling Dominance Drives Premiumization
Sparkling variants dominate the market with a 52.10% share in 2025 and are expected to grow at a CAGR of 7.78% through 2031. This growth stems from consumers seeking carbonated alternatives to traditional sodas, along with opportunities in the premium segment. The category's success comes from delivering both sensory enjoyment and health benefits, meeting consumer demands for both wellness and indulgence. The sparkling segment's market dominance is further reinforced by innovative flavor combinations, natural ingredient formulations, and enhanced functional benefits.
The sparkling water segment is growing due to premiumization trends and increased adoption in the foodservice industry. Restaurants, bars, hotels, and other hospitality establishments offer sparkling flavored water as a premium beverage option to increase profit margins. The addition of natural flavors, unique botanical infusions, and sophisticated packaging enhances the appeal of sparkling water among consumers seeking elevated drinking experiences. Still water maintains a significant market share, primarily serving functional purposes in fitness activities, sports events, workplace consumption, and daily hydration needs. The convenience and portability of still water make it a preferred choice for on-the-go consumption, while its essential role in maintaining health and wellness drives consistent demand across various consumer segments.


By Flavor: Botanical Innovation Leads Premium Growth
Citrus-based flavors hold the dominant market position with a 28.40% share in 2025, driven by widespread consumer familiarity and acceptance. Botanical/herbal variants demonstrate the highest growth rate at 7.45% CAGR, indicating increased consumer interest in wellness-oriented products. The strong performance of citrus flavors stems from consumer preference for established options such as lemon, lime, and orange, which offer refreshing taste profiles. Berry variants capitalize on seasonal preferences and health associations, while tropical fruit flavors appeal to consumers seeking new taste experiences. The blended flavor category presents opportunities for product differentiation through flavor combinations.
The botanical and herbal segment has evolved flavored water beyond refreshment into the functional beverage category, supporting premium pricing strategies. Consumer perception of botanical ingredients as functional additives rather than mere flavoring agents drives this growth. The market shows a clear shift toward complex flavor profiles that combine taste appeal with perceived health benefits. This development creates market opportunities for manufacturers with expertise in botanical formulation and regulatory compliance.
By Packaging Type: Aluminum Cans Capture Sustainability Premium
PET bottles hold a dominant 67.35% market share in 2025, supported by their cost efficiency and widespread consumer acceptance. Aluminum cans demonstrate the highest growth rate at 8.05% CAGR, benefiting from their sustainability credentials and increased adoption by premium brands. PET bottles maintain their market leadership through economies of scale in manufacturing and consumer preference for convenience, especially in larger volume formats and home consumption. Tetra Pak cartons maintain their position in institutional and bulk market segments, while glass packaging serves the ultra-premium segment.
The growth in can packaging reflects evolving consumer environmental awareness and increased regulatory requirements for sustainable packaging options. Packaging material selection now significantly impacts consumer purchasing behavior, especially among younger consumers who emphasize environmental considerations. This environmental focus strengthens aluminum's competitive position while creating pressure on PET manufacturers to enhance recycling capabilities and reduce environmental impact.
By Distribution Channel: On-Trade Premiumization Accelerates
Off-trade channels hold 55.90% market share in 2025 through retail convenience and volume sales, while on-trade channels exhibit the highest growth at 7.26% CAGR. The off-trade dominance is attributed to widespread availability in grocery stores, convenience outlets, and mass retailers, which enables both impulse purchases and bulk buying. These channels offer advantages through promotional activities and enhanced brand visibility via strategic shelf placement and point-of-sale marketing.
The rapid growth in on-trade channels is driven by restaurants, bars, and hospitality venues offering flavored water as premium beverage alternatives. This positioning enables higher profit margins and creates opportunities for limited-edition flavors and exclusive partnerships. The increasing use of flavored water as cocktail mixers and non-alcoholic options in foodservice establishments contributes to volume growth and increased brand awareness. Social media exposure helps generate consumer interest and encourages product trials, particularly among younger consumers who influence broader market trends.
Geography Analysis
North America holds 32.85% market share in 2025, establishing it as the largest regional market. This dominance stems from health-conscious consumer behavior and robust retail infrastructure, though the market shows signs of maturation with moderate growth rates compared to emerging regions. The region's market leadership builds on high disposable income, widespread wellness trend adoption, and advanced distribution networks that support premium product positioning. The established regulatory framework enables companies to market substantiated health claims, creating opportunities for botanical and functional variants.
Asia-Pacific demonstrates the strongest growth trajectory with a 7.21% CAGR through 2031. This growth stems from increasing urbanization, higher disposable income, and enhanced health awareness following the pandemic. The region shows strong acceptance of functional beverages and enhanced waters, attracting substantial investment. Market success depends on understanding local preferences and developing innovative flavor profiles.
Europe, South America, and Middle East and Africa each present unique market opportunities. European markets prioritize sustainability, with increasing adoption of aluminum packaging driven by environmental regulations and consumer preferences.. Brazil's flavored water research reveals 37% consumer trial rates driven by novelty, though market awareness remains limited, suggesting significant growth potential with proper marketing investment. The Middle East and Africa show promise as expanding infrastructure and urbanization support modern retail growth and increased demand for premium beverages.
Competitive Landscape
The flavored water market exhibits moderate concentration with a rating of 6 out of 10, indicating significant competitive dynamics amid ongoing consolidation efforts that reshape industry structure and strategic positioning. Major players pursue vertical integration and portfolio diversification strategies, exemplified by the completed Primo Water and BlueTriton merger forming Primo Brands. This consolidation enables scale economies and distribution network optimization while creating barriers for smaller competitors. Private equity involvement intensifies through acquisitions.
Technology adoption drives competitive differentiation through sustainable packaging innovations, functional ingredient integration, and digital marketing capabilities that enable direct consumer engagement and brand building. Companies leverage aseptic processing systems for flavor preservation and quality maintenance, while investing in aluminum packaging capabilities to capture sustainability premiums.
White-space opportunities emerge in botanical and functional segments, where regulatory compliance and ingredient expertise create competitive moats. Emerging disruptors like Aura Bora and Mela Water gain market share through innovative flavor profiles and targeted marketing. The competitive landscape increasingly rewards companies with regulatory compliance capabilities, sustainable packaging expertise, and functional ingredient innovation rather than traditional scale advantages alone.
Flavored Water Industry Leaders
Keurig Dr Pepper Inc.
Danone S.A.
PepsiCo Inc.
The Coca-Cola Company
Nestlé S.A.
- *Disclaimer: Major Players sorted in no particular order

Recent Industry Developments
- April 2025: Next In Natural acquired a majority stake in Aura Bora, a craft sparkling water startup known for botanical ingredients.
- April 2025: KJ Holding Corp., owner of Calypso Lemonades, acquired Mela Water, a plant-based beverage startup specializing in watermelon-flavored waters with natural ingredients and no added sugars.
- January 2025: Gryphon Investors acquired Spindrift, a leading sparkling water company, as part of private equity's increased focus on premium beverage brands and functional hydration products.


Global Flavored Water Market Report Scope
| Still |
| Sparkling |
| Citrus-based |
| Berry-based |
| Tropical Fruits |
| Botanical/Herbal |
| Blends |
| PET Bottles |
| Cans |
| Tetra Pak Cartons |
| Others |
| On-Trade | |
| Off-Trade | Supermarkets/Hypermarkets |
| Convenience Stores | |
| Online Retail | |
| Others |
| North America | United States |
| Canada | |
| Mexico | |
| Rest of North America | |
| Europe | Germany |
| United Kingdom | |
| Italy | |
| France | |
| Spain | |
| Netherlands | |
| Poland | |
| Belgium | |
| Sweden | |
| Rest of Europe | |
| Asia-Pacific | China |
| India | |
| Japan | |
| Australia | |
| Indonesia | |
| South Korea | |
| Thailand | |
| Singapore | |
| Rest of Asia-Pacific | |
| South America | Brazil |
| Argentina | |
| Colombia | |
| Chile | |
| Peru | |
| Rest of South America | |
| Middle East and Africa | South Africa |
| Saudi Arabia | |
| United Arab Emirates | |
| Nigeria | |
| Egypt | |
| Morocco | |
| Turkey | |
| Rest of Middle East and Africa |
| By Product Type | Still | |
| Sparkling | ||
| By Flavor | Citrus-based | |
| Berry-based | ||
| Tropical Fruits | ||
| Botanical/Herbal | ||
| Blends | ||
| By Packaging Type | PET Bottles | |
| Cans | ||
| Tetra Pak Cartons | ||
| Others | ||
| By Distribution Channel | On-Trade | |
| Off-Trade | Supermarkets/Hypermarkets | |
| Convenience Stores | ||
| Online Retail | ||
| Others | ||
| By Geography | North America | United States |
| Canada | ||
| Mexico | ||
| Rest of North America | ||
| Europe | Germany | |
| United Kingdom | ||
| Italy | ||
| France | ||
| Spain | ||
| Netherlands | ||
| Poland | ||
| Belgium | ||
| Sweden | ||
| Rest of Europe | ||
| Asia-Pacific | China | |
| India | ||
| Japan | ||
| Australia | ||
| Indonesia | ||
| South Korea | ||
| Thailand | ||
| Singapore | ||
| Rest of Asia-Pacific | ||
| South America | Brazil | |
| Argentina | ||
| Colombia | ||
| Chile | ||
| Peru | ||
| Rest of South America | ||
| Middle East and Africa | South Africa | |
| Saudi Arabia | ||
| United Arab Emirates | ||
| Nigeria | ||
| Egypt | ||
| Morocco | ||
| Turkey | ||
| Rest of Middle East and Africa | ||


Key Questions Answered in the Report
What is the current size of the flavored water market?
The flavored water market size stands at USD 27.89 billion in 2026.
How fast is the flavored water market expected to grow?
Global revenue is forecast to rise at a 6.12% CAGR, reaching USD 37.52 billion by 2031.
Which product segment leads sales?
Sparkling flavored water dominated with 52.10% share in 2025 and is projected to post the fastest 7.78% CAGR through 2031.
What packaging format is gaining ground?
Cans are the fastest-growing format at 8.05% CAGR due to sustainability appeal despite PET’s current majority share.
Page last updated on:


