
Market Overview
| Study Period | 2019 - 2031 |
|---|---|
| Market Size (2026) | USD 10.94 Billion |
| Market Size (2031) | USD 15.74 Billion |
| Growth Rate (2026 - 2031) | 7.56 % |
| Fastest Growing Market | Asia-Pacific |
| Largest Market | North America |
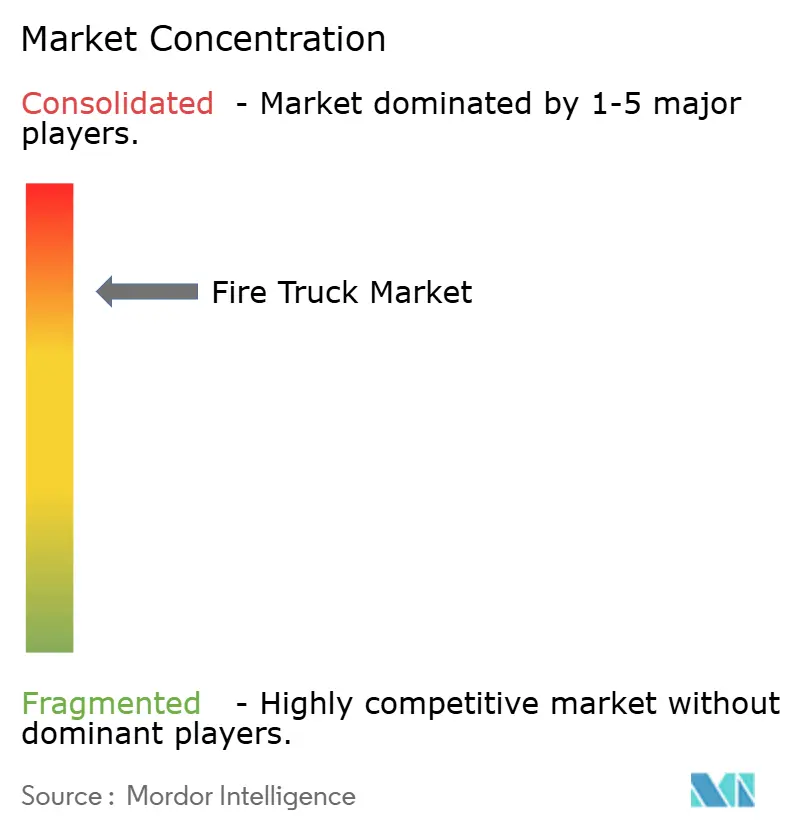
| Market Concentration | High |
Major Players *Disclaimer: Major Players sorted in no particular order Image © Mordor Intelligence. Reuse requires attribution under CC BY 4.0. | |
Fire Truck Market Analysis by Mordor Intelligence
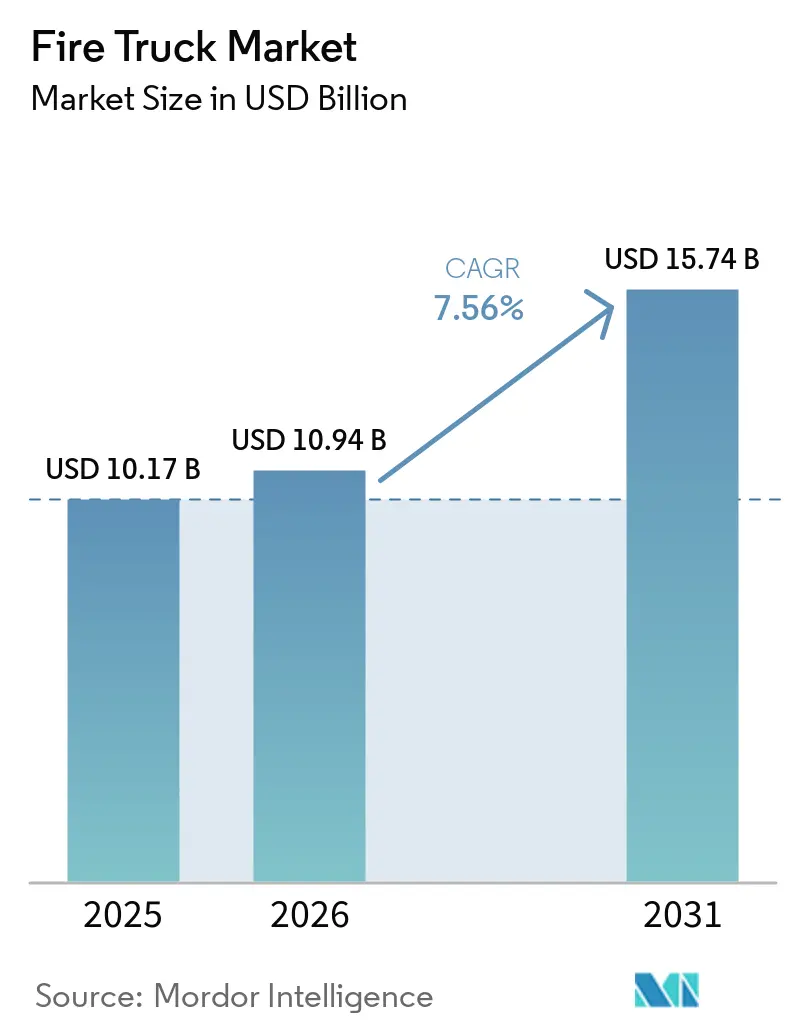
The Fire Truck Market was valued at USD 10.17 billion in 2025 and is expected to reach USD 10.94 billion in 2026, and is forecast to reach USD 15.74 billion by 2031 at 7.56% CAGR over 2026-2031. Fleet replacement cycles, electrification momentum, and climate-driven wildfire risk are combining to lift procurement budgets despite lingering supply-chain bottlenecks. Extended order lead times of 18-33 months are prompting departments to modernize maintenance programs while they wait for new deliveries. Yet, the fire truck market continues to absorb higher unit prices as safety and performance features become non-negotiable. Battery-electric models are moving from pilot to production status in North America and Europe, supported by clean-fleet mandates and measurable savings in fuel and maintenance outlays. Meanwhile, an increase in large-scale wildfire incidents stimulates demand for specialized wildland configurations, and consolidated OEM power is drawing heightened regulatory scrutiny in the United States.
Key Report Takeaways
- By type, pumpers led with 36.28% revenue share in 2025, and the segment is projected to expand at a 7.62% CAGR through 2031.
- By application, residential and commercial operations accounted for 56.90% of the fire truck market share in 2025, while wildland and forestry applications are on track for a 7.86% CAGR to 2031.
- By propulsion, internal-combustion platforms retained 77.60% share in 2025, yet battery-electric units posted the highest growth at 7.71% CAGR through 2031.
- By end-user, municipal departments captured 60.55% of demand in 2025, whereas airport authorities recorded the strongest 7.58% CAGR outlook to 2031.
- By geography, North America held 33.95% of 2025 revenues, while Asia-Pacific is poised for a 7.72% CAGR on the back of rapid urbanization.
Note: Market size and forecast figures in this report are generated using Mordor Intelligence’s proprietary estimation framework, updated with the latest available data and insights as of 2026.
Market Trends and Insights
Drivers Impact Analysis of Fire Truck Market*
| Driver | (~) % Impact on CAGR Forecast | Geographic Relevance | Impact Timeline |
|---|---|---|---|
| Stringent Global and Regional Fire-Safety Regulations | +1.8% | Global, with early gains in North America, EU, Australia | Long term (≥ 4 years) |
| Rising Frequency and Severity of Wildfires | +1.5% | North America, Australia, Mediterranean Europe | Short term (≤ 2 years) |
| Growing Adoption of Electric Fire Trucks | +1.2% | North America and EU, expanding to APAC | Medium term (2-4 years) |
| Rapid Replacement of Ageing Municipal Fleets | +1.1% | Europe core, spill-over to North America | Medium term (2-4 years) |
| Urban High-Rise Construction | +0.9% | APAC core, spill-over to MEA and South America | Long term (≥ 4 years) |
| Integration of IoT-Telematics | +0.8% | Global, with early adoption in North America and EU | Medium term (2-4 years) |
| Source: Mordor Intelligence | |||


Stringent Global and Regional Fire-Safety Regulations
The new NFPA 1900 standard unifies previous apparatus rules and introduces mandatory rear-view cameras, LED lighting, and electric-vehicle guidance.[1]Larry Anderson, “New NFPA 1900 Standard Guides Manufacture of Fire Apparatus,” thebigredguide.com By shifting from prescriptive checklists toward performance-based criteria, such as those defined by the National Fire Protection Association and European standards bodies like CEN, regulators allow OEMs greater design flexibility while maintaining measurable safety benchmarks.This approach enables optimization of pump capacity, structural integrity, braking performance, and emissions compliance without mandating fixed component layouts.
Rising Frequency and Severity of Wildfires
U.S. wildfire acreage hit 7.7 million acres in 2024, outpacing the 10-year average despite fewer total incidents.[2]Katie Hoover and Laura Hanson, “Wildfire Statistics,” fas.org Larger and more intense wildfire events are accelerating procurement of Type 1 Wildland Urban Interface engines equipped with high-capacity tanks and auxiliary pumps that can operate while the vehicle is in motion, improving suppression efficiency during fast-moving incidents. Guidelines from the National Fire Protection Association increasingly emphasize WUI-specific capabilities, prompting departments to modernize fleets with enhanced crew protection and off-road performance.
Growing Adoption of Electric Fire Trucks
Deployments of electric fire trucks have moved beyond pilot programs, with Boulder Fire-Rescue operating two Rosenbauer RTX pumpers, marking a first for any U.S. department. The St. Paul Fire Department invested in a USD 1.8 million RTX vehicle, projected to reduce annual operating costs by approximately USD 25,000 through lower fuel and maintenance expenses. Electric drivetrains reduce noise and eliminate diesel fume exposure, enhancing crew health, situational awareness, and on-scene communication. Cold-weather testing in sub-zero conditions demonstrates that battery thermal management systems maintain reliable performance, ensuring operational readiness in extreme climates. Integration of propulsion-specific criteria in NFPA 1900 has simplified compliance and certification for electric units, lowering technical and regulatory barriers. Municipal carbon-neutral targets and sustainability initiatives are further driving the adoption of zero-emission apparatus in urban fleets.
Rapid Replacement of Ageing Municipal Fleets in Europe
More than two-fifths of European fire stations were built before 1985, and many fire trucks now exceed their nominal 20-year service life, creating a pressing need for fleet renewal. Stricter emissions regulations, set to take effect in 2027, are further shortening replacement intervals and raising compliance costs for older units. Municipalities are increasingly leveraging cooperative purchasing programs to secure volume discounts and manage wait times that can exceed two years, ensuring timely access to modern apparatus. This environment is steering demand toward modular fire truck designs that integrate advanced telematics, low-emission drivetrains, and enhanced safety features. Pumpers and aerial units are at the forefront of these upgrades, benefiting from adaptable chassis and scalable systems that can be tailored to diverse operational requirements. OEMs are responding with flexible manufacturing platforms and standardized componentry to support multiple fleet configurations.
Restraints Impact Analysis of Fire Truck Market*
| Restraint | (~) % Impact on CAGR Forecast | Geographic Relevance | Impact Timeline |
|---|---|---|---|
| High Upfront Cost of Next-Gen Platforms | -1.4% | Global, with acute impact in developing economies | Short term (≤ 2 years) |
| Semiconductor and Chassis Supply-Chain | -1.1% | Global, with concentration in North America and EU | Medium term (2-4 years) |
| Shortage of Skilled Emergency-Vehicle Operators | -0.6% | Global, with acute impact in North America and EU | Long term (≥ 4 years) |
| Tight Municipal Budgets | -0.5% | APAC, South America, MEA core markets | Medium term (2-4 years) |
| Source: Mordor Intelligence | |||
High Upfront Cost of Next-Gen (EV/Hybrid) Platforms
An electric pumper, such as the Rosenbauer RTX, lists for close to a million dollars, roughly double the cost of a comparable diesel engine, creating a significant upfront capital hurdle that delays adoption among volunteer and rural departments. While operational savings from lower fuel consumption and reduced maintenance improve the total cost of ownership over time, initial investment remains a barrier, particularly outside well-funded metropolitan areas. Grant programs partially offset these costs, with Boulder Fire-Rescue securing substantial external funding for its second electric unit, yet financing gaps continue to limit broader deployment. Battery costs are declining but are unlikely to reach parity with diesel engines until production volumes scale meaningfully after 2027, keeping electric units premium priced. This creates a two-tier market dynamic, where well-funded departments accelerate adoption while smaller or resource-constrained fleets lag behind. OEMs are introducing modular battery options and hybrid drivetrains to bridge the affordability gap and expand operational flexibility.
Semiconductor and Chassis Supply-Chain Disruptions
Chip shortages have extended fire apparatus lead times to 18-33 months, forcing departments such as Grand Chute, WI, to operate aged ladder trucks far beyond their planned service life, raising maintenance burdens and operational risk. Lawmakers, including Senators Hawley and Kim, have launched inquiries into the pricing power of the highly consolidated OEM cohort and the safety implications of delayed deliveries, highlighting regulatory scrutiny of the market. Chassis bottlenecks further exacerbate the situation as fire truck manufacturers compete with commercial truck producers for limited base frames, intensifying production constraints. OEMs with vertically integrated supply chains can partially buffer these shocks and maintain more consistent delivery schedules, while smaller builders face slippages that threaten market credibility and strain customer relationships.
*Our forecasts treat driver/restraint impacts as directional, not additive. The impact forecasts reflect baseline growth, mix effects, and variable interactions.
Fire Truck Market Segment Analysis
By Type:
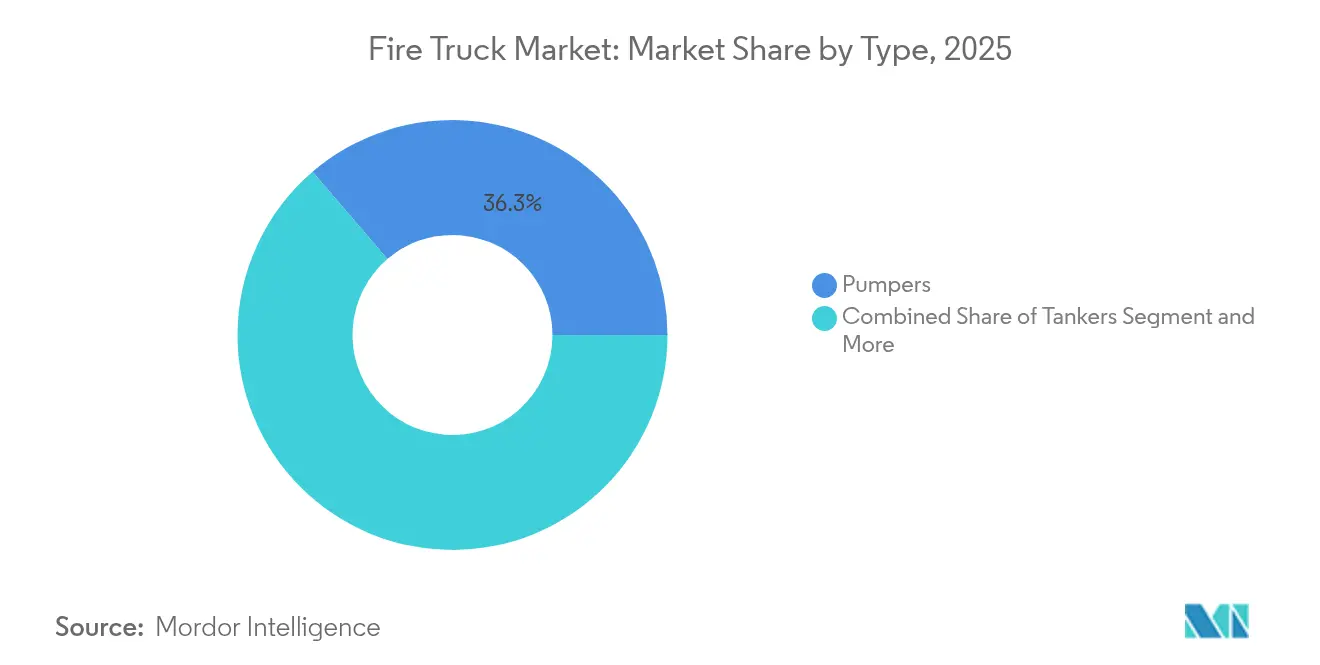
Pumpers sustain leadership while nurturing innovationThe pumper segment held 36.28% of the fire truck market in 2025 and is set to advance at a 7.62% CAGR to 2031. Pumper evolution adds compressed-air foam systems and modular bodywork, giving departments multi-purpose capability. Segment revenue also benefits from early electrification, with Rosenbauer’s RTX platform offering identical pump-rating performance to diesel models. Tankers remain indispensable where hydrant networks are sparse, and ladder platforms satisfy growing urban skylines, including Bronto Skylift’s 230-foot reach that covers 20-story buildings.
Modern rescue units embed hydraulic extrication tools and battery-powered cutting devices, reducing scene set-up time. Demand is also rising for combination apparatus that blend pumper, tanker and rescue functions to save procurement budgets and station footprints. Wildland trucks add auxiliary pumps that deliver water while the vehicle is moving, a feature vital during fast-moving fires. ARFF vehicles command premium pricing due to FAA Part 139 standards that mandate stringent acceleration and foam-delivery benchmarks. With incremental innovation, the pumper’s share of the fire truck market is likely to remain above one-third through the forecast horizon.


By Application:
Wildland growth narrows the gap with structural demandResidential and commercial protection accounted for 56.90% of 2025 revenues, making it the largest single application inside the fire truck market. Fire service mandates for dense urban cores keep order flow steady, and new building codes continue to shift equipment needs toward higher pump capacity and integrated decontamination systems.
Wildland and forestry, however, are expanding at a 7.86% CAGR as climate patterns intensify the severity and length of fire seasons. Vehicle designs incorporate greater ground clearance, reinforced underbodies, and pump-and-roll capacity so crews can attack advancing flames without stopping. Federal grants tied to wildfire mitigation programs sustain procurement budgets even during municipal revenue downturns. Industrial applications demand chemical-proof seals and fire suppression agents compatible with class B hazards, while airports continue ordering ARFF units compliant with fluorine-free foam requirements set by the FAA’s ongoing F3 transition initiative. Taken together, these shifts demonstrate how diverse risk profiles shape the evolving fire truck market.
By Propulsion:
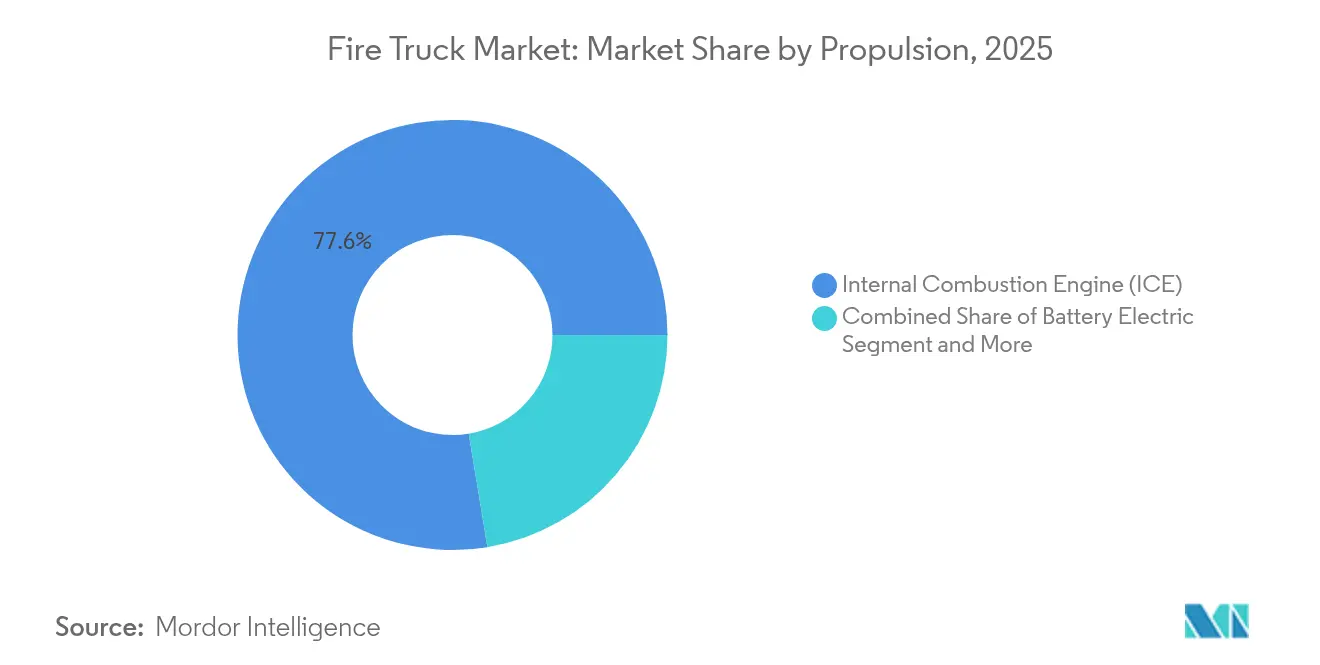
Electric acceleration challenges diesel dominanceInternal-combustion engines still controlled 77.60% of deliveries in 2025, sustaining the traditional backbone of the fire truck market. Yet battery-electric units are climbing at 7.71% CAGR, aided by municipal climate objectives and evidence of operational savings. Early adopters such as the City of Boulder report meaningful reductions in diesel-particulate exposure for crews, bolstering the case for wider rollout.
Hybrid configurations present an interim solution, allowing electric pump operation at the scene and diesel power for long-range travel. Fuel-cell concepts remain nascent but could solve range and recharge downtime for rural agencies once hydrogen infrastructure expands. NFPA 1900’s propulsion-agnostic architecture brings electric safety features under the same umbrella as diesel, reducing compliance uncertainty. With these enablers, the electric share of the fire truck market could reach one-fifth of the total by the end of the decade, particularly in urban jurisdictions that backfill diesel fleets with zero-emission replacements.
By End-User:
Airport authorities outpace municipal purchasersMunicipal departments delivered 60.55% of demand in 2025, reflecting their core role in community protection. Nonetheless, airport authorities exhibit the fastest 7.58% CAGR, propelled by terminal expansions and stricter ARFF vehicle criteria. Foam system transitions away from PFAS chemicals add urgency to refresh older fleets, while modern aircraft sizes demand higher agent-flow rates for incident response.
Industrial brigades continue to specify purpose-built units for petrochemical and manufacturing sites, integrating gas-detection telemetry with vehicle control systems. Defense agencies maintain specialized fleets that can deploy abroad or on base, often procuring through multi-year contracts that stabilize builder production lines. Private-contract services are also gaining traction, particularly in campus-style industrial parks where dedicated fire protection yields insurance advantages. This expanding buyer mix broadens the addressable fire truck market beyond its municipal nucleus.
Geography Analysis
North America Fire Truck Market
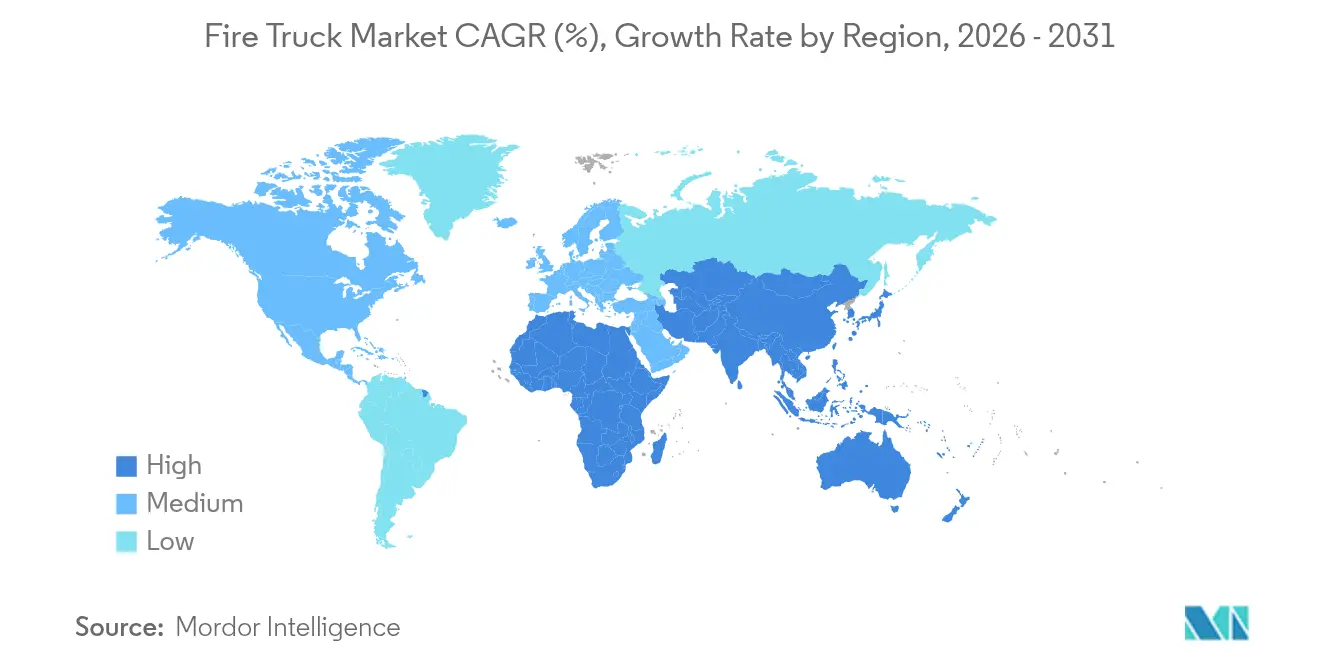
North America commanded 33.95% of 2025 revenue, benefiting from mature emergency-services funding and advanced technology trials, and the region hosts the bulk of early electric fire truck deployments, reinforcing its role as a bellwether for future global adoption patterns. Ongoing federal infrastructure programs provide supplemental funding to replace apparatus older than 20 years, keeping the order pipeline resilient and supporting fleet modernization across both urban and suburban departments. Large municipal budgets and cooperative purchasing agreements further stabilize demand, enabling OEMs to scale production of advanced pumpers, aerials, and electric units.
APAC Fire Truck Market
Asia-Pacific, recording a 7.72% CAGR, is rapidly scaling municipal fire services to match urbanization in China, India, and Southeast Asia, with tier-2 and tier-3 Chinese cities allocating capital to expand station networks and invest in pumps and aerials designed for dense, high-rise districts. India issues regular tenders prioritizing local assembly, encouraging joint ventures between global OEMs and domestic chassis suppliers, while Southeast Asian nations are focusing on modernizing fleets with low-emission drivetrains and integrated telematics. Emerging interest in battery-electric commercial vehicles at a robust CAGR hints at a budding market for zero-emission apparatus once charging infrastructure matures, positioning the region for accelerated adoption in the mid-term.
EMEA and South America Fire Truck Market
Europe remains a large yet slower-growing arena, focused on green compliance and replacement rather than fleet expansion, with tightening emissions rules and NFPA-aligned standards influencing procurement criteria and stimulating uptake of Euro-VI engines and hybrid drives. The Middle East and Africa register steady orders linked to expanding urban footprints and industrial megaprojects, while South America’s demand is tempered by macroeconomic volatility and inconsistent funding for municipal fleets. Collectively, these regional trajectories underscore the geographic diversity of the fire truck market, highlighting varied growth drivers, regulatory pressures, and adoption timelines that shape global market dynamics.

Regulatory Landscape
Fire truck design and procurement are anchored to safety and performance standards that increasingly harmonize requirements across apparatus types and propulsion. NFPA 1900 consolidated multiple prior NFPA apparatus standards into one framework effective January 1, 2024, while NFPA 1910 consolidated inspection, maintenance, and testing requirements, which shifts manufacturers and departments toward clearer, unified compliance checklists that also incorporate guidance for electric-vehicle integration.
In Europe, EN 1846-2 (issued in 2024 and updated into 2025 national adoptions such as SS-EN 1846-2 and NEN-EN 1846-2) sets common safety and performance requirements for firefighting and rescue service vehicles, supporting cross-border tender comparability. In the United States, operational and vehicle-level rules also shape apparatus configurations and use, including FMCSA provisions (49 CFR 390.3T(f)(5)) that address emergency-operation exemptions, and NHTSA updates in June 2026 that amended portions of FMVSS references relevant to modern vehicle systems. Electric powertrain integrity requirements under FMVSS 305a include a mandatory compliance date beginning September 1, 2027 (with certain extensions for specific manufacturer categories), which creates a defined validation timeline for electric and hybrid fire apparatus.
Value Chain Analysis
The fire truck value chain starts with chassis and powertrain supply (commercial truck OEMs and specialty platforms), then moves to body and module fabrication, pump and foam-system integration, electrical and lighting packages, and the final assembly and certification workflows for municipal, industrial, and ARFF applications. A multi-tier supplier ecosystem provides pumps, valves, tanks, hose reels, agent systems, lighting, and control electronics, while final-stage builders handle integration, water-flow testing, road testing, and configuration-to-spec documentation aligned with standards such as NFPA 1900 and EN 1846-2.
Lead-time management and chassis availability remain central to how value is captured and risk is managed across the chain. OEMs have leaned into modular production to decouple body manufacturing from chassis delivery, illustrated by Rosenbauer marking the delivery of its 100th tanker fire truck using the modular MT body design in April 2026, with modules manufactured in-house ahead of chassis arrival to shorten the critical path. Upstream partnerships also help secure base platforms and service coverage, such as Zoomlion signing a global strategic cooperation agreement with Mercedes-Benz Trucks in April 2025 focused on specialized fire truck chassis and overall vehicle solutions, aligning chassis supply, integration engineering, and aftersales support across regions.
Competitive Landscape
The fire truck market is highly concentrated; three global manufacturers account for a significant share, giving them scale advantages in R&D and supply-chain bargaining. This dominance has drawn bipartisan Senate attention over pricing power and delivery delays, with legislators probing whether consolidation undermines preparedness.[3]Elizabeth Warren, “Bipartisan Investigation Into Harms of Private Equity,” warren.senate.gov OEMs respond by expanding domestic capacity; Pierce Manufacturing, for instance, added production shifts and facility square footage to trim backlogs.
Electrification has become the primary competitive arena. OshHKosh exhibited its AI-enabled Collision Avoidance Mitigation System at CES 2025, positioning software-driven safety as a differentiator. Rosenbauer’s continued rollout of the RTX series in North America and Europe signals confidence in scaling electric production. REV Group leverages its mixed-fleet portfolio to offer hybrid ladder trucks aimed at cities with sparse charging infrastructure.
New entrants target niche opportunities like IoT-based fleet-management platforms that integrate predictive maintenance and driver-behavior analytics. Smaller chassis integrators also find openings in custom wildland configurations, where agility and specialized protection features outweigh scale. With buyer priorities shifting toward life-cycle value over upfront cost alone, integrated service contracts that bundle training, parts and telematics stand to reshape the revenue mix for participants in the fire truck industry.
Fire Truck Industry Leaders
Oshkosh Corporation
Rosenbauer International AG
Magirus GmbH.
REV Group
Morita Holdings Corporation
- *Disclaimer: Major Players sorted in no particular order
Fire Truck Market Companies Covered in this Report
- Rosenbauer International AG
- Oshkosh Corporation (Pierce)
- REV Group
- Morita Holdings Corporation
- Magirus GmbH
- W.S. Darley & Co.
- KME (Kovatch Mobile Equipment)
- Sutphen Corporation
- Gimaex GmbH
- Albert Ziegler GmbH
- Bronto Skylift Oy
- NAFFCO
- Emergency One UK Ltd
- Weihai Guangtai
- Iturri Group
- Zhongtian Heavy Industry
- Sides S.A.
- BAI Brescia Antincendi International
- Fouts Bros Fire Equipment
- Alexis Fire Equipment

Market Opportunities and Future Outlook
Electrification has moved into higher-complexity apparatus categories, creating whitespace for suppliers that can deliver certified performance, thermal management, and duty-cycle reliability in heavy, safety-critical missions. In June 2026, Rosenbauer unveiled the L32A-XS electric aerial ladder on a MAN eTGM chassis at INTERSCHUTZ 2026, positioned as the first all-electric aerial ladder under 16 tonnes. This expands the addressable zero-emission portfolio beyond pumpers into aerial segments where payload, stability, and power-demand requirements are more demanding. ARFF electrification is also showing up in in-service trials, with Rosenbauer delivering an all-electric PANTHER 6x6 to Dallas Fire-Rescue at Love Field for a six-month trial, and OEM roadmaps highlighting electric ARFF platforms such as Rosenbauer PANTHER electric and Oshkosh Airport Products Striker Volterra.
Extended delivery windows and visible pricing pressure support modular architectures, lifecycle service contracts, and digital fleet tools that reduce downtime while departments wait for new apparatus. With reported order lead times stretching into multi-year cycles in parts of the market, demand is shifting toward solutions that improve availability, including modular builds that reduce rework, predictive maintenance offerings, and standardized option packages that simplify procurement. Updated compliance frameworks (NFPA 1900 and EN 1846-2:2024/2025) also reinforce a clearer pathway for manufacturers to commercialize electric and hybrid variants at scale, while raising the bar on documentation, testing, and safety features that can differentiate suppliers able to industrialize these platforms across municipal, airport, and industrial end users.
Recent Industry Developments in Fire Truck Market
- June 2026: Rosenbauer unveiled the L32A-XS electric aerial ladder built on a MAN eTGM chassis at INTERSCHUTZ 2026, positioned as the first all-electric aerial ladder under 16 tonnes. The launch extends electrification beyond pumpers into aerial apparatus where payload, stability, and power demands are higher. It also broadens competitive differentiation around battery management, integration engineering, and compliance readiness for zero-emission configurations.
- March 2026: Oshkosh Airport Products announced that Groupe ADP ordered a fourth Striker Volterra 6x6 electric ARFF vehicle for Paris-Le Bourget Airport. Repeat orders from a major airport operator signal operational confidence and support broader adoption of electric ARFF platforms in airport fleet renewal cycles. The deal strengthens Oshkosh positioning in premium ARFF segments where specifications and total lifecycle support heavily influence procurement.
- December 2024: Rosenbauer America partnered with Dallas Fire Rescue to deploy a PANTHER 6x6 electric fire truck at Dallas Love Field Airport in 2025. The collaboration placed electrified ARFF technology into an operational airport environment, supporting validation of performance, charging workflows, and maintenance needs. It also helped normalize electric specifications in airport tenders as foam systems, safety requirements, and emissions goals converge.


Fire Truck Market Report Scope and Research Methodology
Market Definition and Coverage
This market is defined as revenues earned from new fire trucks that are purpose-built for firefighting and rescue response, including specialized units used by municipal services, airports, industrial facilities, and defense users. Values are tracked at the point of vehicle sale, in nominal USD.
Scope exclusions: Used vehicle resale, routine maintenance services, financing, and stand-alone spare parts are not counted unless they are bundled into a new vehicle contract value.
Segments Covered in This Report
- By Type
- Pumpers
- Tankers
- Rescue Trucks
- Aerial/Platform Trucks
- Multi-tasking Modular Trucks
- Wildland Fire Trucks
- Airport Crash Tender (ARFF)
- By Application
- Residential and Commercial
- Industrial and Manufacturing
- Airports
- Military
- Wildland and Forestry
- By Propulsion
- Internal Combustion Engine (ICE)
- Hybrid
- Battery Electric
- Fuel-Cell Electric
- By End-User
- Municipal Fire Departments
- Industrial Facility Brigades
- Airport Authorities
- Defense and Military
- Contract and Private Fire Services
- By Geography
- North America
- United States
- Canada
- Rest of North America
- South America
- Brazil
- Argentina
- Rest of South America
- Europe
- Germany
- United Kingdom
- France
- Italy
- Spain
- Russia
- Rest of Europe
- Asia-Pacific
- China
- India
- Japan
- South Korea
- Australia
- Rest of Asia-Pacific
- Middle East and Africa
- Saudi Arabia
- United Arab Emirates
- South Africa
- Egypt
- Rest of Middle East and Africa
- North America
Data Sources, Market Sizing, and Validation
Desk Research
Desk research begins by building the fire-services demand and procurement context, because purchase cycles and public budgets are direct drivers in this market. We reviewed public sources such as national fire incident reporting statistics, government procurement portals, and transport or vehicle registration releases where available, and then cross-checked complete-vehicle coverage using customs trade data.
To keep assumptions grounded, we also used municipal and airport authority budget documents, standards and guidance references published by fire protection bodies, and peer-reviewed or engineering journals that address vehicle safety, pump performance, and equipment requirements. Company annual reports, investor decks, and trusted press were reviewed to understand order backlogs and delivery lead times. Where specific company financial splits were not public, paid subscriptions for company financials and news intelligence, plus patent databases and shipment-level import and export data, were used to fill gaps. This list is not exhaustive, and many other public sources were also used for data collection, validation, and clarification.
Primary Interviews and Surveys
Primary work focused on interviews and structured surveys with vehicle OEM staff, component suppliers, dealers and integrators, and end users involved in procurement and fleet planning. Respondent input was used to confirm regional replacement timing, the cadence of new-vehicle orders, and how alternative propulsion options are being considered, then these checks were applied to fine-tune the model across the Americas, EMEA, and APAC.
Distribution of primary research fieldwork respondents
| Company type | Respondent position | Region |
|---|---|---|
| Top tier: 29% | CXOs: 13% | APAC: 43% |
| Mid tier: 49% | Functional/Unit leaders: 33% | EMEA: 32% |
| Smaller Players: 22% | Managers: 54% | Americas: 25% |
Market-Sizing & Forecasting
Sizing was built using a top-down method where public procurement spend patterns, fleet replacement cycles, and vehicle delivery pipelines are reconstructed by region, then allocated into fire truck types and end-user pools. The totals were checked with selective bottom-up approximations, mainly by sampling typical unit pricing by truck class and multiplying by estimated annual deliveries, and then adjusting where channel checks showed consistent gaps.
A few inputs carried the most weight: annual municipal and airport capital budget trends, incident and wildfire activity signals that affect fleet urgency, average replacement age and out-of-service rates, order backlog and lead-time ranges, and price movement driven by chassis, pumps, and onboard safety equipment. Where unit volumes were not directly observable, gaps were handled using import and export flows for complete vehicles, alongside expert-led ranges for local assembly versus imported share.
Forecasts were produced using scenario analysis supported by regression checks on budget growth, replacement timing, and delivery capacity constraints, because these variables explain year-to-year movement more reliably than a straight-line trend. Assumptions were finalized after discussions on what changes first in a tightening cycle, which is typically order intake and delivery timing rather than immediate cancellations.
Data Validation & Update Cycle
Model outputs are cross-checked against independent signals such as public tender activity, disclosed backlog commentary, and visible trade flows, and then variances are reviewed before sign-off. If a region shows an unusual swing, we re-check currency timing, large one-off procurement programs, and whether delivery delays shifted revenue across years.
The work goes through multi-step analyst review so assumptions, calculations, and definitions stay consistent across segments and regions. Reports are refreshed annually, and interim updates are triggered when material events occur, such as large regulatory changes, major fleet recapitalization announcements, or sustained price shifts. Before delivery, a final pass is completed so clients receive the latest updated view.
Mordor Intelligence's Fire Truck Market Size Compared With Other Published Estimates
Published market sizes for fire trucks often differ even when the topic label appears the same, because the included vehicle classes and the revenue point in the value chain can change across studies. Differences also come from the starting year, how multi-year delivery backlogs are recognized, and whether pricing is treated as stable or adjusted over time.
In fire trucks specifically, the gap usually comes from whether airport rescue and specialized rescue units are fully included, whether refurbishment and service contracts are added to new-vehicle revenue, and whether the model is anchored to procurement and delivery timing instead of relying only on long-run vehicle parc assumptions. Currency conversion timing and the use of aggressive versus conservative replacement-cycle assumptions also shift results, particularly when lead times extend and deliveries move across calendar years.
Benchmark comparison
| Source | Market Size | Gaps in Research Methodology |
|---|---|---|
| Mordor Intelligence | USD 10.94 B (2026) | |
| Global Consultancy A | USD 8.37 B (2025) | Uses an earlier base year and a slower growth view, and it can understate value when long delivery lead times shift revenue recognition away from procurement intent. |
| Trade Journal B | USD 12.35 B (2026) | Tends to group adjacent emergency-response apparatus and related contract values into the total, which can lift the figure versus a new-vehicle-only view. |
The table shows that scope choices and timing assumptions are the main reasons for different values, not a simple math error. When specialized units are separated from adjacent apparatus, and revenues are aligned to delivery-linked vehicle sales rather than broader emergency spending, the estimate stays easier to replicate and explain, which is the approach applied by Mordor Intelligence.


Key Questions Answered in the Report
What is the current value of the fire truck market?
The fire truck market size is valued at USD 10.94 billion in 2026, with projections pointing to USD 15.74 billion by 2031.
Which fire truck type generates the most revenue?
Pumpers hold the lead, securing 36.28% of 2025 global revenue and maintaining the fastest 7.62% CAGR outlook to 2031.
How quickly are electric fire trucks being adopted?
Battery-electric models are expanding at 7.71% CAGR, and early adopter departments report annual savings of about USD 25,000 per unit.
Why are airport authorities a key growth segment?
Airport fire services must meet strict ARFF standards and are modernizing fleets amid terminal expansions, driving 7.58% CAGR growth through 2031.
What factors constrain near-term supply?
Semiconductor shortages and chassis bottlenecks have stretched delivery windows to as long as 33 months, delaying fleet replacements.
How concentrated is the competitive landscape?
Three global manufacturers control roughly around four fifth of output, leading to a market concentration score of 8.
Page last updated on:


 Your data is secure and never sold or shared.


