
Fingerprint Module Market Size and Share
Market Overview
| Study Period | 2021 - 2031 |
|---|---|
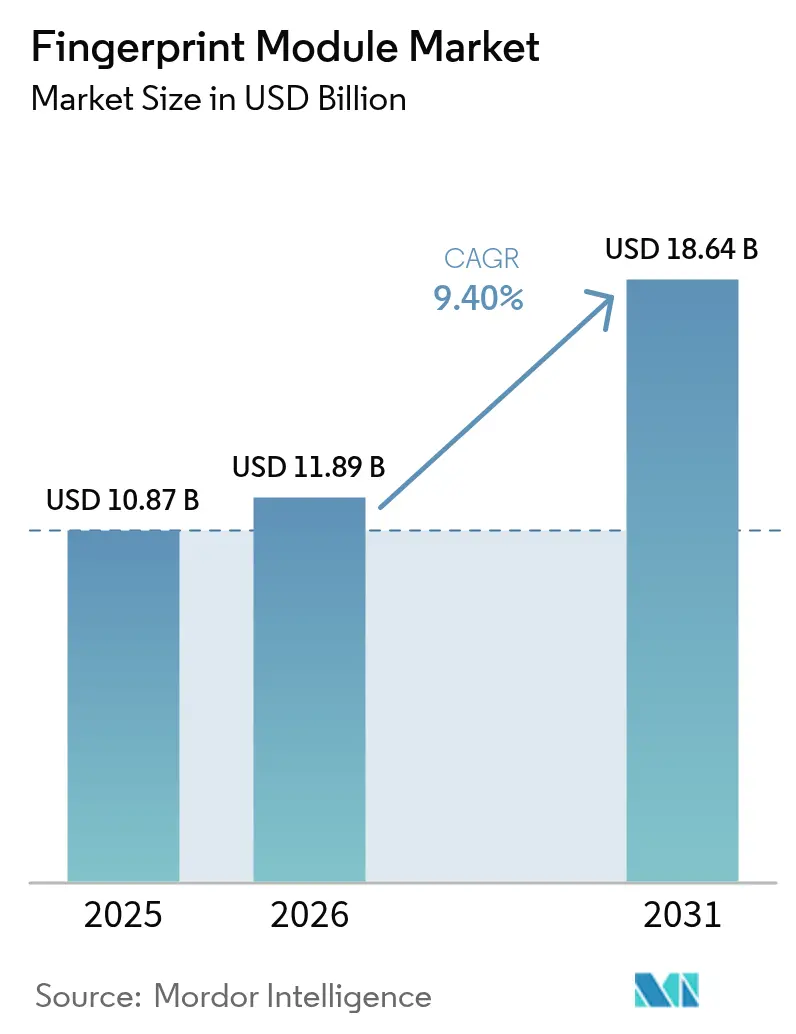
| Market Size (2026) | USD 11.89 Billion |
| Market Size (2031) | USD 18.64 Billion |
| Growth Rate (2026 - 2031) | 9.40 % |
| Fastest Growing Market | Asia Pacific |
| Largest Market | Asia Pacific |
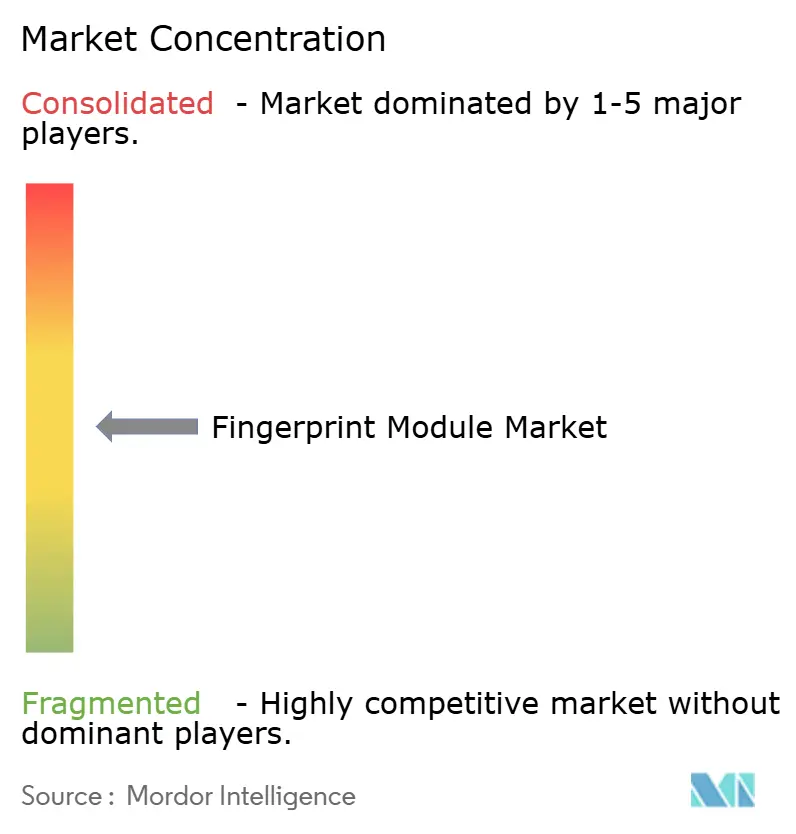
| Market Concentration | Medium |
Major Players *Disclaimer: Major Players sorted in no particular order Image © Mordor Intelligence. Reuse requires attribution under CC BY 4.0. | |
Fingerprint Module Market Analysis by Mordor Intelligence
The fingerprint module market size was valued at USD 10.87 billion in 2025 and estimated to grow from USD 11.89 billion in 2026 to reach USD 18.64 billion by 2031, at a CAGR of 9.40% during the forecast period (2026-2031). Momentum stems from sovereign digital-identity projects, rapid smartphone authentication upgrades, and the commercial roll-out of biometric payment cards. Capacitive sensors still dominate volume demand, yet ultrasonic technology is expanding fastest as premium devices seek higher spoof-resistance. System-on-chip (SoC) integration is shrinking footprint and bill-of-materials costs, while in-display modules underpin the push for bezel-less handset designs. Volume procurement for Asia-Pacific government programs, falling average selling prices, and automotive adoption together keep the fingerprint module market on a multi-year growth arc.
Key Report Takeaways
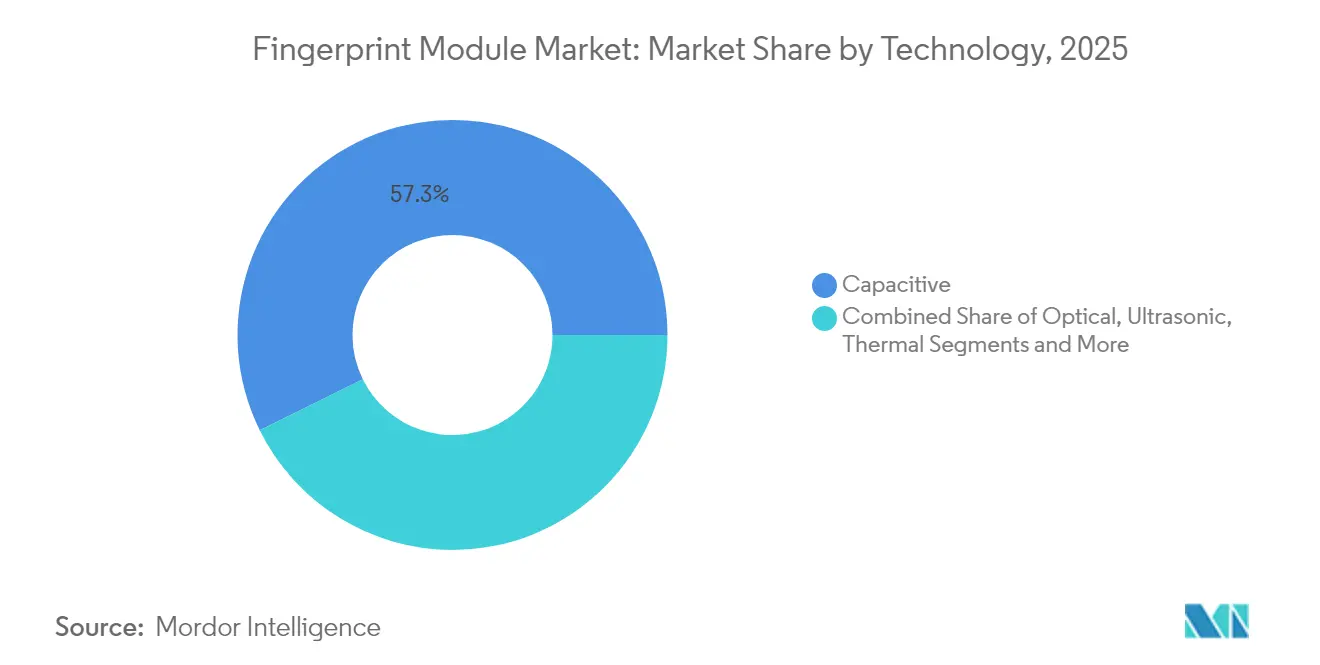
- By technology, capacitive sensors led with 57.30% of fingerprint module market share in 2025; ultrasonic sensors are projected to grow at 10.05% CAGR to 2031.
- By sensor type, area/touch modules held 60.40% revenue share in 2025, while in-display sensors are advancing at an 11.1% CAGR through 2031.
- By form factor, stand-alone modules commanded 45.20% of the fingerprint module market size in 2025; SoC-integrated solutions are set to expand at 9.75% CAGR by 2031.
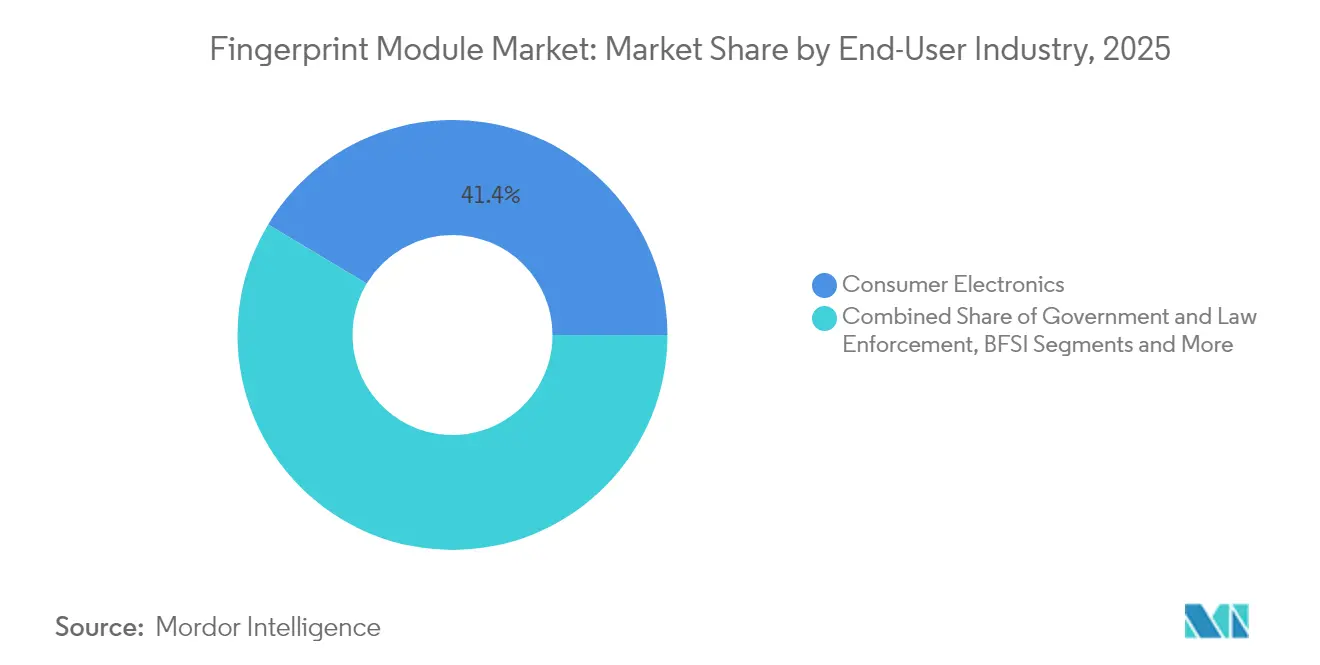
- By end-user industry, consumer electronics retained 41.40% share in 2025, whereas automotive applications are forecast to post the highest 10% CAGR.
- By application, device unlocking accounted for 37.50% of the fingerprint module market size in 2025; biometric payment authentication is accelerating at 11.9% CAGR through 2031.
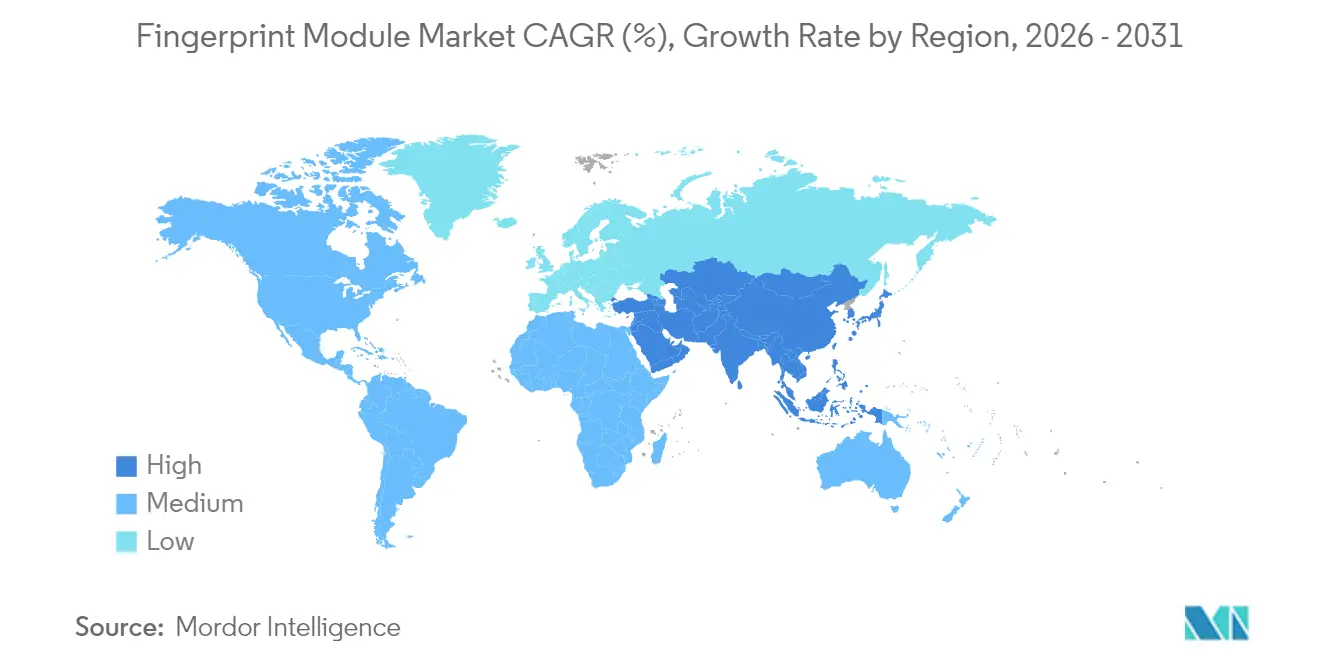
- By geography, Asia-Pacific captured 40.60% of fingerprint module market share in 2025 and is projected to register a 9.55% CAGR to 2031.
Note: Market size and forecast figures in this report are generated using Mordor Intelligence’s proprietary estimation framework, updated with the latest available data and insights as of 2026.
Market Trends and Insights
Drivers Impact Analysis of Fingerprint Module Market*
| Driver | (~) % Impact on CAGR Forecast | Geographic Relevance | Impact Timeline |
|---|---|---|---|
| Government biometric ID megaprojects surge | +2.1% | APAC, Africa, Latin America | Long term (≥ 4 years) |
| Explosive smartphone integration for on-device authentication | +1.8% | Global, led by APAC & North America | Medium term (2-4 years) |
| Falling ASP of capacitive & optical modules | +1.4% | Global, strongest in emerging markets | Short term (≤ 2 years) |
| Biometric payment cards reach mass-issuance stage | +1.2% | North America & Europe early, global follow-on | Medium term (2-4 years) |
| Automotive and smart-gun makers embed fingerprint modules | +0.9% | North America & EU demand, APAC supply | Medium term (2-4 years) |
| Source: Mordor Intelligence | |||
Government Biometric ID Megaprojects Surge
Large-scale national identity programs are rewriting baseline demand. Ethiopia’s Fayda scheme targets 90 million registrations by 2030, backed by USD 350 million in multilateral funding.[1]World Bank Group, “The Transformative Power of Ethiopia's Digital ID,” worldbank.orgNigeria’s USD 430 million digital ID project pursues universal coverage for more than 200 million citizens. Such contracts specify robust, long-life modules and create multi-year replenishment revenue. The volume sheerly outstrips consumer-device cycles, ensuring predictable pull for suppliers and stabilizing factory utilization across the fingerprint module market.
Explosive Smartphone Integration for On-Device Authentication
Flagship and mid-tier handsets now treat fingerprint biometrics as baseline functionality. Under-display modules permit full-screen designs, while ultrasonic units lift security by imaging sub-epidermal ridges. Android handset makers in North America and China have embedded dual sensing zones to quicken unlock speed, raising average content per device. This trend expands addressable volume and pressures suppliers to meet tighter thickness and power-budget envelopes.
Falling ASP of Capacitive & Optical Modules Broadens Adoption
Mature manufacturing nodes, optimized driver ICs and yield improvements have cut average selling prices of legacy capacitive modules by double-digit percentages since 2023. As cost falls below USD 1 in high-volume lots, industrial handhelds, connected locks and IoT endpoints adopt biometrics instead of PIN pads, widening mid-volume demand bands. Lower ASPs also enable manufacturers to integrate two or more sensors per device, driving incremental unit growth despite price erosion.
Biometric Payment Cards Reach Mass-Issuance Stage
Mastercard’s pledge to phase out embossed card numbers by 2030 has moved pilots to commercial roll-out. Banks in Europe and the United States are ordering fingerprint-enabled dual-interface cards to curb card-not-present fraud. The Smart Payment Association recorded 2.5 billion card and module shipments in 2024, 92% of them contactless.[2]Smart Payment Association, “2.5 Billion Units of Cards and Modules Shipped by SPA in 2024,” smartpaymentassociation.comPayment-grade sensors must fit ISO card thickness and operate at milliwatt power budgets, attracting specialist suppliers able to co-package the sensor, secure element, and power management inside the antenna loop.
Restraints Impact Analysis of Fingerprint Module Market*
| Restraint | (~) % Impact on CAGR Forecast | Geographic Relevance | Impact Timeline |
|---|---|---|---|
| Data-privacy and breach litigation risk | -1.6% | North America primary; EU & APAC emerging | Medium term (2-4 years) |
| Tight MEMS / IC packaging capacity limits supply elasticity | -1.1% | Global; APAC fab clusters | Short term (≤ 2 years) |
| Hygiene backlash on shared touch sensors | -0.8% | Global; sector-specific sensitivity | Short term (≤ 2 years) |
| Source: Mordor Intelligence | |||
Data-Privacy & Breach Litigation Risk
Class actions under statutes such as Illinois’ BIPA have generated multimillion-dollar settlements for improper fingerprint capture, raising compliance overheads for enterprises. Corporate buyers now demand on-device template storage and revocable consent flows, extending design-in cycles and regulatory consultations. Vendors marketing the fingerprint module market solutions must add encryption, secure-element isolation, and third-party audits, which inflate the bill-of-materials and certification costs.
Hygiene Backlash on Touch Sensors in Post-Pandemic Settings
Shared access points in healthcare, food service and transportation remain wary of tactile surfaces. Facility managers in North America and Europe increasingly favor contactless face or iris systems for multi-user portals, holding back unit growth for communal fingerprint terminals. While single-user smartphones are unaffected, the restraint still trims potential volumes in enterprise time-and-attendance and public kiosk segments.
*Our forecasts treat driver/restraint impacts as directional, not additive. The impact forecasts reflect baseline growth, mix effects, and variable interactions.
Fingerprint Module Market Segment Analysis
By Technology:
Ultrasonic Sensors Propel Premium DevicesUltrasonic units contributed a minor yet fast-advancing slice of 2025 revenue and should expand at 10.05% CAGR to 2031, outpacing all other categories. Capacitive solutions still delivered the bulk of shipments, anchoring 57.30% fingerprint module market share in 2025. The fingerprint module market size for capacitive sensors rose on the back of low-cost Android models, whereas ultrasonic adoption correlated with premium ASP smartphones and finance-grade wearables.
Developers prize ultrasonic technology for its capacity to image sweat pores and sub-dermal capillary structures, defeating thin-film screen protectors and partial contaminants. Qualcomm’s third-generation 3D Sonic packages achieve sub-200-micron Z-stack height, freeing OEMs to pursue edge-to-edge glass builds. Capacitive incumbents continue to raise spatial resolution and cut idle power below 5 µA, preserving relevance in mass-market phones and consumer IoT. Optical modules, meanwhile, land in mid-tier devices where backlighting can be reused from display engines to trim costs.



By Sensor Type:
In-Display Integration Steadies MomentumArea/touch modules accounted for 60.40% of 2025 due to proven reliability across consumer devices and enterprise door locks. Nonetheless, in-display sensors are forecast to climb 11.1% annually to 2031, reflecting handset makers’ race for uninterrupted OLED panels. The fingerprint module market size linked to in-display designs will benefit from premium ASPs, offsetting lower density per handset.
Swipe sensors linger in point-of-sale terminals and rugged handhelds where narrow bezels remain. Hybrid touch-plus-pressure packages are gaining brand traction among notebook PC vendors, enabling palm-rest integration without enlarging the chassis. The sensor-type mix underlines the fingerprint module industry shift toward invisible biometrics that harmonize with industrial design goals.
By Form Factor:
SoC Integration Sharpens Cost CurveStand-alone units still delivered 45.20% of 2025 revenue, favored by device OEMs needing fast time-to-market and field-replaceable parts. Yet, SoC integration is projected to register a 9.75% CAGR by 2031 as mixed-signal co-design pulls the analog front-end, cryptographic core, and microcontroller into a single die. The resulting power domains cut leakage and simplify PCB layout, pushing component counts below four per module.
Embedded board-level solutions remain relevant in industrial scanners and police mobile ID terminals, where designers demand specific RF shielding or antenna couplings. Cost-down roadmaps among leading suppliers rely on advanced wafer-level chip-scale packaging to slot integrated sensors beside Bluetooth and PMIC blocks inside a unified substrate, reinforcing the densification trajectory of the fingerprint module market.
By End-User Industry:
Automotive Overtakes Growth LeagueConsumer electronics kept 41.40% in 2025, but vehicle programs will post the quickest 10% CAGR through 2031. Automakers link biometric ignition to in-car payment wallets, driver-assistance profiles, and insurance telematics, widening integration scope. The fingerprint module market share derived from automotive dashboards will therefore climb steadily.
Government and law enforcement demand remains a baseline through ID card tenders and border kiosks, underpinning volume stability. Banks and payment processors amplify orders for dual-interface biometric cards to curb account-takeover fraud. Healthcare deployments proceed as hospitals morph into digital front-door models requiring secure patient check-in, and IoT vendors add compact sensors to smart locks, safes, and appliance panels.
By Application:
Payments Register Highest CAGRDevice unlocking represented 37.50% of the 2025, as every mid-range handset shipped with a sensor. Payments, however, are slated for 11.9% CAGR as biometric credit and debit cards roll out across North America and Western Europe. The fingerprint module market size attached to payment authentication will accelerate once issuers absorb per-card sensor premiums into fraud-loss budgets.
Identity and access management systems continue installing hardened readers in defense, energy, and data-center facilities, though litigation risk moderates the corporate clock-in subsegment. Border-control e-gates move toward multimodal screening, securing steady procurement of higher-grade, low-latency modules able to process wet fingers and gloved users.
Geography Analysis
APAC Fingerprint Module Market
Asia-Pacific combined the world’s biggest production basin with the largest deployment programs, holding 40.60% market share in 2025 and tracking a 9.55% CAGR to 2031. China’s handset OEM ecosystem absorbs tens of millions of sensors monthly, while India’s Digi Yatra expansion and airport e-gate tenders elevate domestic civil demand. ASEAN’s commitment to interoperable digital public infrastructure harmonizes standards, letting suppliers ship common module footprints across multiple jurisdictions.
North America Fingerprint Module Market
North America shows mature yet lucrative conditions: handset replacement cycles, wearables upgrades, and enterprise security retrofits keep volumes stable, whereas stringent privacy legislation prompts buyers to favor on-device template storage, lifting ASPs. The fingerprint module market continues to profit from U.S. automotive biometrics, where luxury brands localize sourcing to hedge supply-chain risk after North Carolina quartz mine disruptions threatened wafer output.
EMEA and South America Fingerprint Module Market
Europe advances on the back of GDPR-aligned national e-ID plans and bank-driven biometric card launches. Middle East & Africa’s latent demand crystallizes in national ID projects such as Cameroon’s 2025 biometric card roll-out under a 15-year concession. South America provides incremental gains as smartphones penetrate mid-income cohorts and governments modernize social-benefits disbursement platforms, though macro volatility elongates procurement cycles.

Regulatory Landscape
Compliance is increasingly shaped by interoperability and security-validation expectations set by public standards bodies and government programs. In China, the Ministry of Public Security issued module-specific requirements for small-size fingerprint recognition modules under GA/T 2154-2024 (implemented 2024-12-01) and for access control fingerprint modules under GA/T 701-2024 (implemented 2025-01-01), tightening baseline performance and integration expectations for deployed readers.
For cross-border and multi-agency use cases, standardized data interchange formats and law-enforcement frameworks influence procurement. NIST published ANSI/NIST-ITL 1-2025 (SP 500-290e4) in March 2026, updating how fingerprint and other biometric data and metadata are transmitted between systems, while the EU established a framework for automated biometric data search and exchange via the Prum router under Regulation (EU) 2024/982 (March 2024). Taken together, these standards and policies emphasize secure template handling, consistent metadata, and auditability across identity, border, and policing deployments.
Value Chain Analysis
The fingerprint module value chain begins with sensor and mixed-signal silicon design (capacitive, optical, and ultrasonic front ends plus MCU/cryptography), then moves through foundry fabrication and packaging (wafer-level and system-in-package), module assembly (SMT, encapsulation, flex integration, and calibration), and finally algorithm and security-software integration for matching, liveness detection, and secure storage. Standards and ecosystem bodies such as ISO/IEC JTC 1/SC 37 and INCITS biometrics committees shape interoperability requirements, while authentication frameworks such as FIDO Alliance specifications pull modules toward certified component security and metadata disclosure.
Downstream integration proceeds via OEM design-in, reference designs, and distribution to handset, PC, automotive, access-control, and payment-card supply chains. Long qualification cycles and program certifications act as gatekeeping steps. Recent channel moves also show a shift from discrete sensors to integrated platforms: Fingerprint Cards AB expanded distribution for its AllKey Ultra single-chip fingerprint solutions through a global partnership with AdvanIDe (June 2026), while localization pressures show up in India-focused silicon and platform collaborations such as the Mindgrove Technologies and Pinetics partnership targeting biometric and identity applications (May 2026). Supply elasticity remains constrained by packaging and test capacity, as well as by 12-24 month qualification timelines for security and environmental resilience in regulated deployments.
Competitive Landscape
The fingerprint module market features moderate fragmentation and active patent combat. Established sensor specialists leverage accumulated IP and algorithms, yet semiconductor majors now bundle biometric functions within edge AI chipsets, compressing margins for discrete suppliers. Leading vendors anchor design wins by co-engineering reference boards with smartphone and laptop OEMs, creating high switching costs.
Patent filings topped 1,800 families in 2024 as players sought coverage on pressure-wave ultrasonic capture, screen-embedded optics, and self-calibrating capacitive arrays. Apple’s USPTO-registered under-display claims exemplify defenses mounted to lock in premium handset differentiation. Meanwhile, publicly listed leaders such as Synaptics disclosed strategic M&A—acquiring ultra-low-power vision AI—to broaden integrated authentication stacks. [4]SEC, “Synaptics Inc. Form 10-K,” sec.gov
Cost leadership battles center on wafer-level packaging access and captive testing lines. Suppliers with direct access to APAC front-end fabs can pivot capacity faster during demand swings, a decisive edge during pandemic-era constraints. The competitive tempo pushes smaller niche players toward alliance models—licensing algorithms or focusing on ruggedized industrial sub-segments—to avoid head-on price wars with diversified chip conglomerates.
Fingerprint Module Industry Leaders
Fingerprint Cards AB
GOODIX Technology Inc.
Synaptics Incorporated
Integrated Biometrics LLC
SecuGen Corporation
- *Disclaimer: Major Players sorted in no particular order
Fingerprint Module Market Companies Covered in this Report
- Fingerprint Cards AB
- GOODIX Technology Inc.
- Synaptics Incorporated
- Integrated Biometrics LLC
- SecuGen Corporation
- HID Global Corporation
- Qualcomm Technologies Inc.
- Suprema Inc.
- Apple Inc.
- NITGEN Co., Ltd.
- NEC Corporation
- NEXT Biometrics ASA
- Anviz Global
- IDEMIA France SAS
- Thales Group
- Egis Technology Inc.
- IDEX Biometrics ASA
- Infineon Technologies AG
- Samsung Electronics Co., Ltd.
- ZKTeco Co., Ltd.
- Precise Biometrics AB
- Shenzhen SYNOCHEM Microelectronics

Market Opportunities and Future Outlook
A key whitespace is in compliance-led upgrades where liveness detection and independently validated performance become purchasing prerequisites rather than optional features. The publication of ANSI/NIST-ITL 1-2025 (SP 500-290e4) in March 2026 raises interoperability expectations for agencies and integrators exchanging fingerprint records, while ISO/IEC standards for fingerprint data formats continue to anchor minutiae and image interchange in government and large enterprise deployments. That mix creates opportunities for module suppliers that package secure processing, encryption, and standardized output into compact modules that reduce integration burden for system OEMs supporting national ID, border, and law-enforcement tenders.
Payments and consumer authentication also support premium niches where third-party validation can reduce issuer risk. Fingerprint Cards AB reported passing the EMVCo biometric assessment for payment-card fingerprint sensors (March 2026), which supports broader commercialization of biometric cards that must meet tight thickness, power, and security constraints. In parallel, platform-style offerings are broadening beyond sensors into turnkey authentication components, illustrated by Fingerprint Cards AllKey initiatives and FIDO-oriented packaging approaches that target security tokens and enterprise access ecosystems, linking module sales to certification-driven procurement rather than handset unit cycles.
Recent Industry Developments in Fingerprint Module Market
- June 2026: Fingerprint Cards AB expanded distribution for its AllKey Ultra single-chip fingerprint solutions through a global partnership with AdvanIDe. The move broadens access to integrated biometric modules and accelerates adoption in enterprise and payment contexts.
- March 2026: Fingerprint Cards AB became the first biometric company to pass the EMVCo assessment process for fingerprint sensors used in payment cards. The milestone aligns its sensor technology with payment-network validation requirements and lowers procurement friction for issuers moving from pilots to scaled card programs.
- November 2025: Synaptics Incorporated entered a strategic partnership with Qualcomm Technologies to advance fingerprint sensor and touch technology across mobile and compute platforms. The collaboration links biometric hardware roadmaps with major platform enablement, supporting tighter integration paths for OEMs designing across smartphones, PCs, and related connected devices.


Fingerprint Module Market Report Scope and Research Methodology
Market Definition and Coverage
This market is defined as revenue generated from fingerprint modules that combine the sensing element with supporting electronics and interfaces, sold for identity verification and secure access use cases across devices and systems.
The scope excludes standalone biometric software services and broader access-control systems unless the fingerprint module hardware is explicitly priced and counted.
Segments Covered in This Report
- By Technology
- Optical
- Capacitive
- Ultrasonic
- Thermal
- Multispectral
- By Sensor Type
- Area/Touch
- Swipe
- In-display
- Hybrid/Combo
- By Form Factor
- Stand-alone Module
- System-on-Chip (SoC) Integrated
- Embedded ASIC/Board-level
- By End-user Industry
- Government and Law Enforcement
- Consumer Electronics
- BFSI
- Healthcare
- Aviation
- Automotive
- Smart Home and IoT
- Other Industrial
- By Application
- Identity and Access Management
- Payment and Transaction Authentication
- Time and Attendance
- Border Control and Immigration
- Device Unlocking
- By Geography
- North America
- United States
- Canada
- Mexico
- South America
- Brazil
- Argentina
- Rest of South America
- Europe
- Germany
- United Kingdom
- France
- Italy
- Spain
- Russia
- Rest of Europe
- APAC
- China
- Japan
- South Korea
- India
- Australia and New Zealand
- ASEAN-5
- Rest of APAC
- Middle East and Africa
- Middle East
- UAE
- Saudi Arabia
- Turkey
- Rest of Middle East
- Africa
- South Africa
- Nigeria
- Kenya
- Rest of Africa
- Middle East
- North America
Data Sources, Market Sizing, and Validation
Desk Research
For the initial build, we start with public references that describe how biometric hardware demand is forming by device category and by country. Sources used include, for example, U.S. International Trade Commission trade data, UN Comtrade, the International Organization for Standardization (biometrics and data security standards), NIST biometric performance publications, and World Bank macro indicators that help normalize device shipments and spending capacity.
Alongside these, we review company filings, investor presentations, product documentation, and reputable press coverage to understand module form factors, interface choices, and price direction. Patent databases are also used to map technology shifts such as ultrasonic adoption and under-display integration. An import and export shipment-level database is selectively referenced to sanity-check shipment movement patterns. These examples are not exhaustive, and other public sources were also used for data collection, validation, and research clarification.
Primary Interviews and Surveys
Primary work was used to pressure-test the demand pool and the pricing logic, especially where public reporting is thin. We spoke with module suppliers, device OEM ecosystem participants, distributors, and system integrators across APAC, EMEA, and the Americas, so assumptions on attach rates, replacement cycles, and ASP changes could be corrected before finalizing the model.
Distribution of primary research fieldwork respondents
| Company type | Respondent position | Region |
|---|---|---|
| Top tier: 34% | CXOs: 16% | APAC: 41% |
| Mid tier: 50% | Functional/Unit leaders: 24% | EMEA: 35% |
| Smaller Players: 16% | Managers: 60% | Americas: 24% |
Market-Sizing & Forecasting
Sizing starts with a top-down build where device and system demand pools are reconstructed from shipment indicators and then filtered through fingerprint penetration. For smartphone and consumer device-linked demand, we apply fingerprint adoption rates, in-display versus rear or side placement mix, and typical module value contribution, and then we extend this logic to adjacent demand such as access control and time and attendance deployments.
To keep the totals realistic, we cross-check with selective bottom-up approximations, such as sampled ASP multiplied by estimated unit volumes for key module form factors, plus channel checks on replacement and project cycles. In the steps where direct unit visibility is patchy, gaps are handled using ranges agreed during interviews, then narrowed using observable signals like device cycles, regulatory ID rollouts, and payment card biometric pilots.
For forecasting, scenario analysis is used to reflect how adoption can move faster or slower depending on device refresh timing, security policy changes, and pricing declines. Inputs tracked include consumer electronics shipment trends, module ASP progression by technology (optical, capacitive, ultrasonic), attach rate shifts by form factor (stand-alone module versus SoC-integrated), and the pace of government identity and border control procurements.
Data Validation & Update Cycle
Estimates are validated through triangulation across multiple independent checks, not a single data stream. Model outputs are compared with external signals such as device shipment direction, technology mix changes, and observed price bands, and any variance that looks too large is reviewed and recalculated.
Before sign-off, the work goes through multi-step analyst review so assumptions remain consistent across regions and end uses. If a material event occurs, such as a demand shock in consumer electronics or a step change in biometric policy adoption, we re-contact sources to re-test the key inputs. The report is refreshed annually, and right before delivery a final pass is completed so clients receive the latest updated view.
Mordor Intelligence's Fingerprint Module Market Size Versus Other Published Estimates
Published market values for fingerprint modules often differ because firms count different things and start from different demand anchors, and then the forecast path is shaped by their price and adoption assumptions. In practice, small differences in what is treated as a module, and when software or device-level biometrics get included, can move the total by billions.
Some external estimates expand the scope into fingerprint sensors plus surrounding biometric stacks and adjacent authentication hardware. In Mordor Intelligence, the number is kept tied to fingerprint module hardware value and checked against technology mix and device and system demand signals before forecasts are extended.
Benchmark comparison
| Source | Market Size | Gaps in Research Methodology |
|---|---|---|
| Mordor Intelligence | USD 11.89 B (2026) | |
| Industry Publisher A | USD 11.03 B (2024) | Uses an earlier base year and includes component-level splits that can pull in software and controller value, which can make comparisons against module-only revenue inconsistent if definitions are not separated clearly. |
| Global Consultancy B | USD 4.10 B (2024) | Appears to apply a narrower demand pool and a different inclusion rule for integrated designs, which can reduce the counted value when SoC-integrated module revenue is treated as part of a broader device bill of materials rather than module revenue. |
The spread in the table mainly comes from scope and accounting choices, plus base-year timing and how ASP decline is applied across technologies. When the market is traced through a clear demand pool and cross-checked with pricing and mix indicators, the resulting value is easier to reproduce and to update as adoption patterns shift.


Key Questions Answered in the Report
What is the current size of the fingerprint module market?
The market stands at USD 11.89 billion in 2026 and is projected to hit USD 18.64 billion by 2031.
Which technology segment is growing fastest?
Ultrasonic sensors are expected to rise at 10.05% CAGR as premium devices demand higher security.
Why are biometric payment cards important for market growth?
Banks are adopting fingerprint-enabled cards to curb fraud, driving a 11.9% CAGR in payment-authentication modules.
Which region will contribute the most incremental revenue?
Asia-Pacific, already holding 40.60% share, will advance at 9.55% CAGR on the back of sovereign ID projects and handset manufacturing.
How will privacy legislation impact market expansion?
Stricter laws such as Illinois’ BIPA increase compliance costs and could trim forecast CAGR by 1.6 percentage points.
What is the competitive outlook for new entrants?
Moderate consolidation (score 6) leaves room for niche suppliers focused on ruggedized or highly integrated solutions, but winning design-ins requires strong IP and fab access.
Page last updated on:





