
Biometrics Market Size and Share
Market Overview
| Study Period | 2020 - 2031 |
|---|---|
| Market Size (2026) | USD 67.86 Billion |
| Market Size (2031) | USD 136.86 Billion |
| Growth Rate (2026 - 2031) | 15.07 % |
| Fastest Growing Market | Asia-Pacific |
| Largest Market | North America |
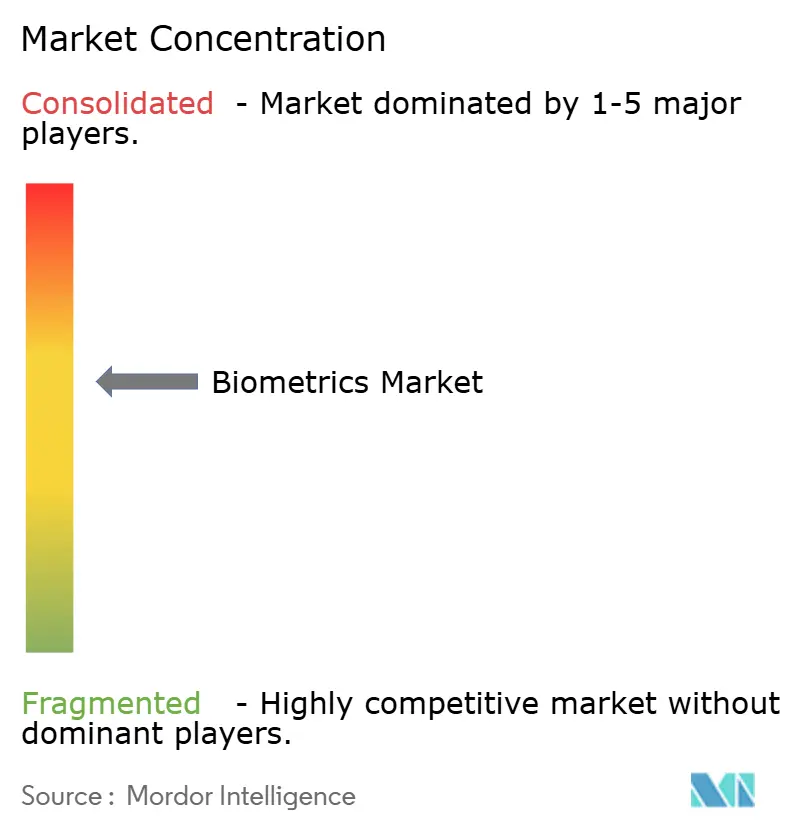
| Market Concentration | Medium |
Major Players *Disclaimer: Major Players sorted in no particular order Image © Mordor Intelligence. Reuse requires attribution under CC BY 4.0. | |
Biometrics Market Analysis by Mordor Intelligence
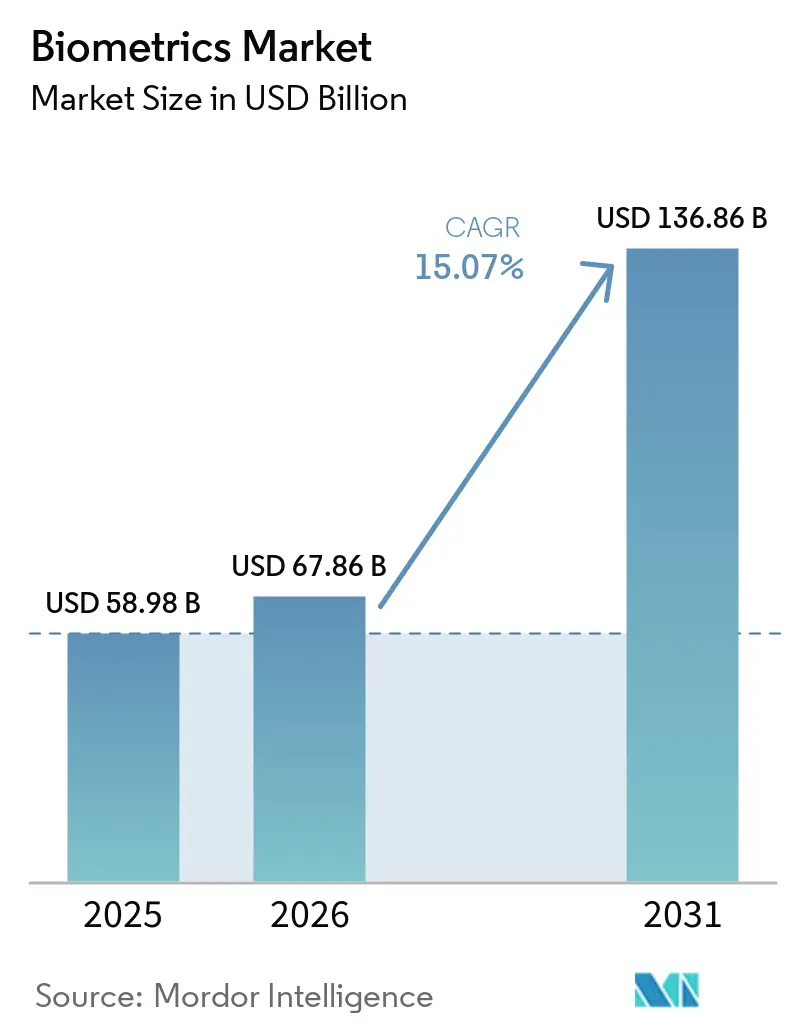
The biometrics market size is expected to grow from USD 58.98 billion in 2025 to USD 67.86 billion in 2026 and is forecast to reach USD 136.86 billion by 2031 at 15.07% CAGR over 2026-2031. The expansion is underpinned by government digital-ID programs, rising payments tokenization, and surging airport modernization that collectively elevate the need for frictionless identity proofing. Hardware still dominates current deployments, yet cloud-ready software engines are scaling fastest as enterprises shift from point solutions to platform models. New privacy regulations in China and the European Union are tightening compliance requirements, simultaneously encouraging multi-modal architectures that balance accuracy with consent management. In North America, REAL ID enforcement from May 2025 is driving an urgent wave of federal and state procurements for airport and DMV roll-outs. Asia Pacific’s integration of biometrics into super-apps, wallets, and bank e-KYC frameworks positions the region as the long-run demand accelerator.
Key Report Takeaways
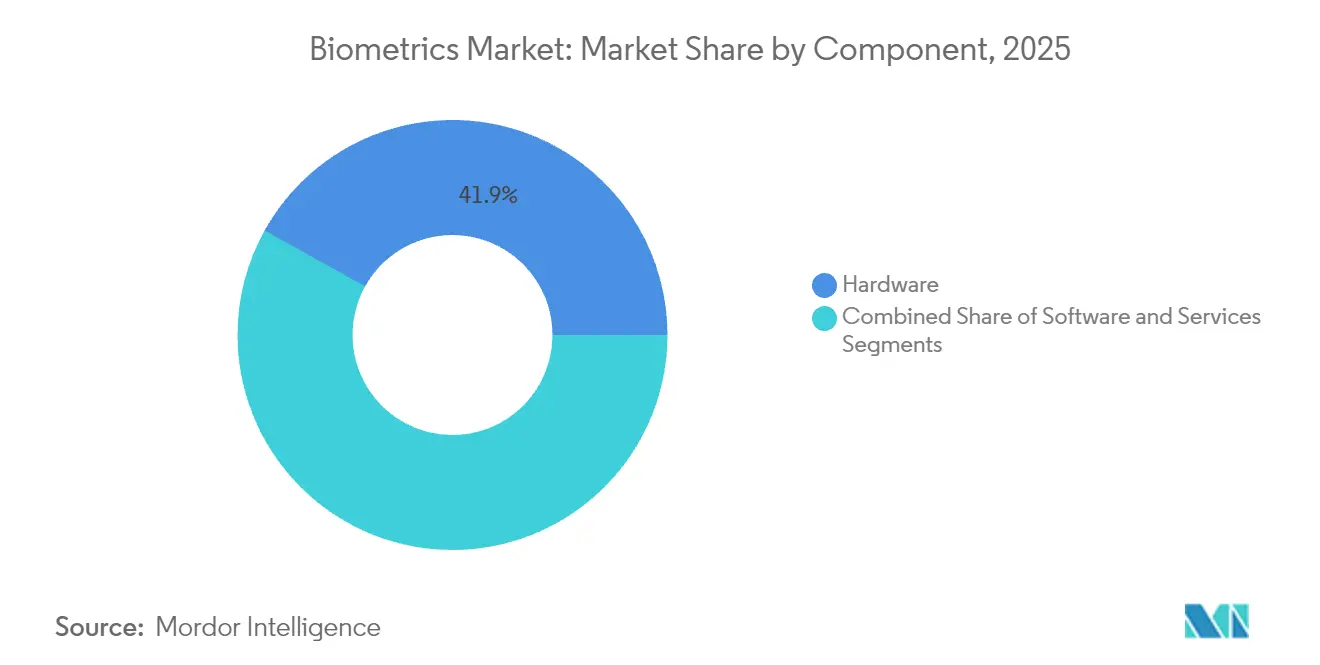
- By component, hardware led with 41.92% revenue share in 2025 while software is projected to grow at a 16.35% CAGR to 2031.
- By biometric modality, fingerprint technology captured 36.55% of biometrics market share in 2025; iris recognition is forecast to expand at an 19.68% CAGR through 2031.
- By authentication type, single-factor methods held 63.40% share in 2025 whereas multi-factor approaches are advancing at a 16.75% CAGR.
- By contact type, contact-based systems accounted for 35.95% of the biometrics market size in 2025, and contactless solutions are expected to grow at a 16.72% CAGR.
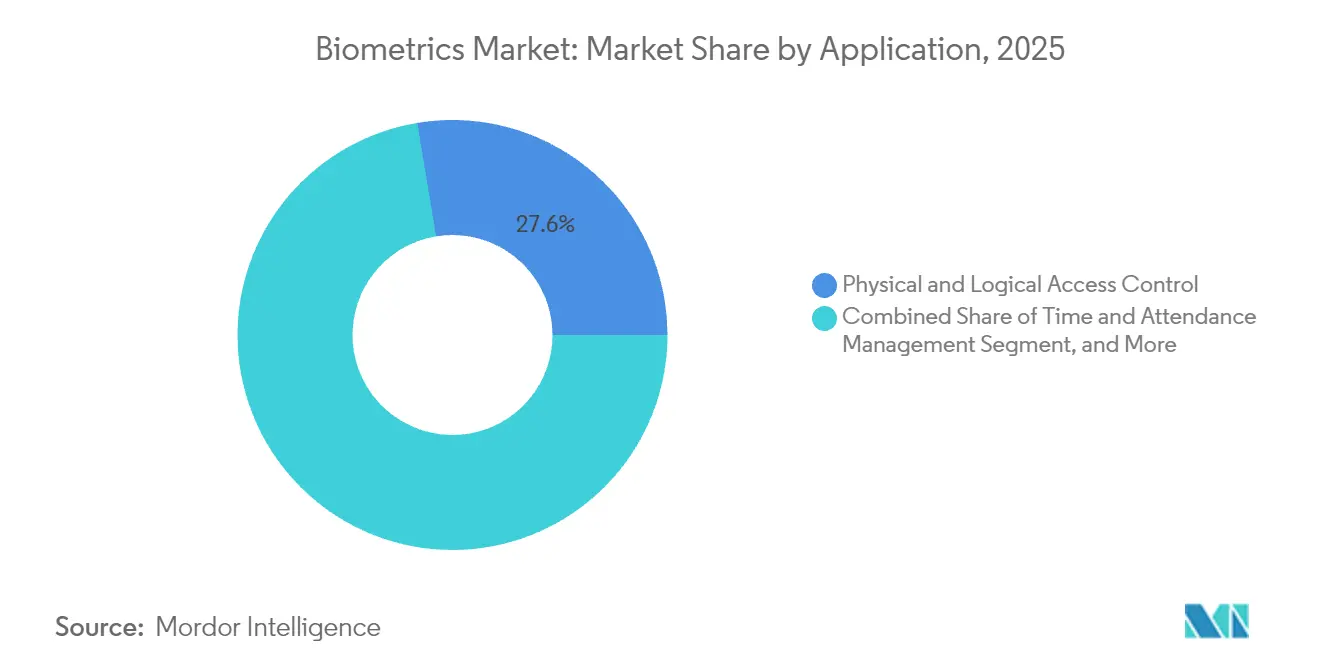
- By application, physical and logical access control commanded 27.62% of the biometrics market size in 2025; payment and transaction authentication is rising at an 17.95% CAGR to 2031.
- By end-use industry, government and law-enforcement held 38.10% share of the biometrics market size in 2025, with healthcare growing fastest at 16.20% CAGR.
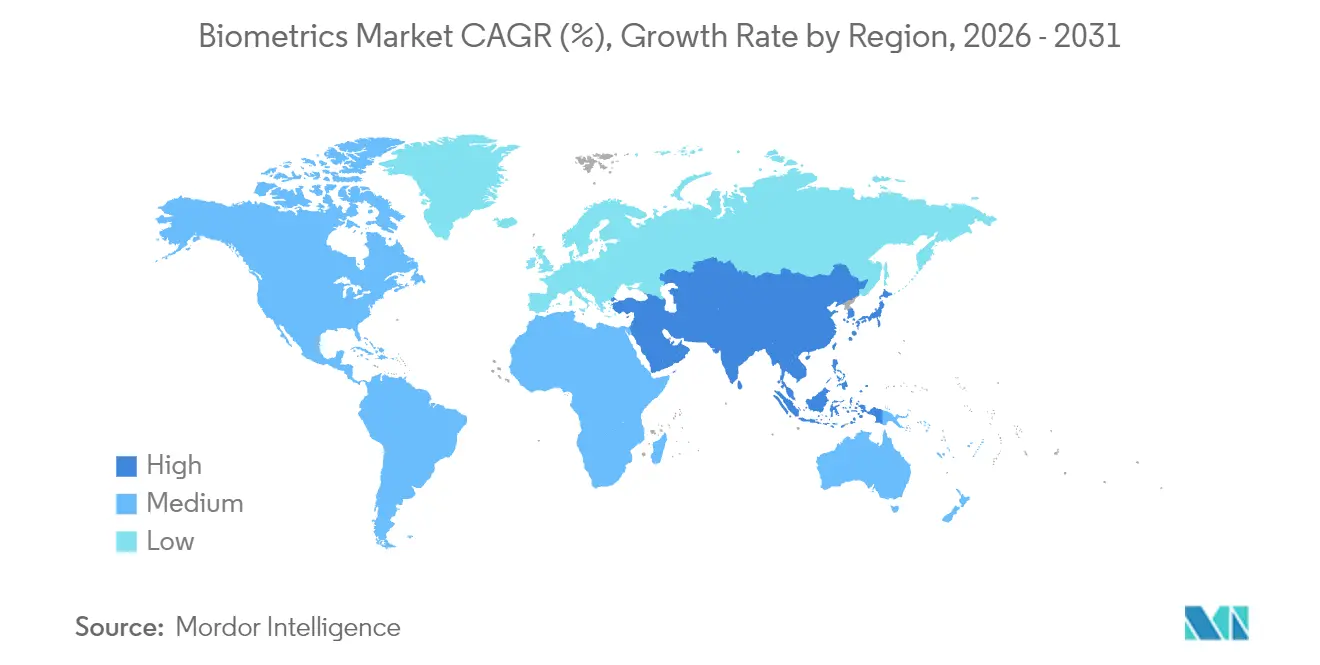
- By geography, North America dominated with 30.35% share in 2025, while Asia Pacific is poised for an 18.10% CAGR as digital wallets exceed 4.8 billion users globally.
Note: Market size and forecast figures in this report are generated using Mordor Intelligence’s proprietary estimation framework, updated with the latest available data and insights as of 2026.
Market Trends and Insights
Drivers Impact Analysis of Biometrics Market*
| Driver | (~) % Impact on CAGR Forecast | Geographic Relevance | Impact Timeline |
|---|---|---|---|
| Government-backed National e-ID Programs Across Asia | +3.20% | Asia Pacific core, spill-over to MEA | Medium term (2-4 years) |
| EMVCo and ISO Standards Catalyzing Fingerprint Payment Cards in North America and Europe | +2.80% | North America and EU | Short term (≤ 2 years) |
| U.S. TSA Biometrics Road-map Driving Federal Procurement Surge | +2.10% | North America, with early gains in major airports | Medium term (2-4 years) |
| China's "Smart Airport 2025" Policy Accelerating Face and Voice Biometrics | +1.90% | APAC core, spill-over to global aviation hubs | Short term (≤ 2 years) |
| Biometric KYC Mandates by GCC and African Central Banks | +1.70% | Middle East and Africa | Long term (≥ 4 years) |
| Healthcare Digital Transformation Driving Patient Identification Systems | +1.40% | Global, with concentration in developed markets | Medium term (2-4 years) |
| Source: Mordor Intelligence | |||
Government-backed National e-ID Programs Across Asia
Asian authorities are orchestrating large-scale digital identity transformations. South Korea’s smartphone-based resident registration card and Vietnam’s decision to extend biometric IDs to foreign nationals by July 2025 have set benchmarks for inclusive ecosystems. Indonesia’s USD 200 million INA Digital platform and the Philippines’ registration of 89.5 million citizens unlock financial services for previously unbanked adults. Sri Lanka’s multi-modal program combining fingerprints, face, and retina scans targets completion in 2026, illustrating how emerging economies leapfrog legacy infrastructures.
EMVCo and ISO Standards Catalyzing Fingerprint Payment Cards
Harmonized EMVCo and ISO rules have moved biometric cards from pilots to commercial issuance. Infineon’s SECORA Pay Bio silicon and Thales’ global trials cut false-accept rates and allow higher transaction ceilings [1] Infineon Technologies AG, “SECORA Pay Bio enhances convenience…,” infineon.com. Mastercard’s Identity Check and passkey support promise frictionless authentication, helping issuers reduce fraud and chargebacks. Vendors forecast shipments of 113.3 million biometric cards by 2028 as banks prioritize PIN-free contactless experiences.
U.S. TSA Biometrics Road-map Driving Federal Procurement Surge
The TSA is investing USD 250.8 million to expand face and fingerprint capture to hundreds of airport lanes by late 2025. Migration to the AI-enabled Homeland Advanced Recognition Technology system will process millions of passengers daily and spur mobile credential innovation through Cooperative Research and Development Agreements. REAL ID compliance gaps further lift demand for rapid, standards-based identity verification at DMVs and security checkpoints.
China’s “Smart Airport 2025” Policy Accelerating Face & Voice Biometrics
Beijing and Guangzhou airports demonstrate one-ID journeys blending face, voice, and behavior analytics that meet new personal-data filing requirements effective June 2025. A USD 12 billion pipeline of smart-airport upgrades channels funding into multi-modal kiosks that handle 100 million passengers annually. The legislated ban on facial recognition as a sole factor pushes airlines toward layered architectures that align with global privacy norms.
Restraints Impact Analysis of Biometrics Market*
| Restraint | (~) % Impact on CAGR Forecast | Geographic Relevance | Impact Timeline |
|---|---|---|---|
| GDPR and BIPA Litigation Risks Curtailing Facial-Recognition Roll-outs | -2.40% | Global, with concentration in EU and Illinois | Short term (≤ 2 years) |
| Algorithmic Bias Against Dark-Skin Demographics Triggering Procurement Moratoriums | -1.80% | North America and EU | Medium term (2-4 years) |
| CMOS Image-Sensor Shortages Constricting Fingerprint Module Supply | -0.90% | Global, with concentration in Asia manufacturing hubs | Short term (≤ 2 years) |
| Supply Chain Disruptions and Component Cost Inflation | -0.70% | Global, with acute impact in semiconductor-dependent regions | Short term (≤ 2 years) |
| Source: Mordor Intelligence | |||
GDPR and BIPA Litigation Risks Curtailing Roll-outs
More than USD 200 million in BIPA settlements during 2024-2025, including Clearview AI’s USD 51.75 million payment, signals material liability for enterprises deploying facial recognition without explicit consent. GDPR’s strict data-minimization and local-processing rules add EUR 50,000-200,000 (USD 56,500-226,000) compliance cost per European installation, shrinking the addressable base for small projects. The FTC’s enforcement against Rite Aid sets a U.S. precedent for algorithmic-bias audits, compelling vendors to redesign architectures for privacy by design.
Algorithmic Bias Triggering Procurement Moratoriums
GAO findings on racial disparities in face-matching accuracy have led some municipalities to pause new procurements until vendors prove demographic fairness. DHS and DOJ are now weighting bias-mitigation scores in tender evaluations, lengthening sales cycles. IDEMIA’s top ranking in DHS fairness metrics underscores how intensive RandD into representative training data is becoming a competitive prerequisite.
*Our forecasts treat driver/restraint impacts as directional, not additive. The impact forecasts reflect baseline growth, mix effects, and variable interactions.
Biometrics Market Segment Analysis
By Component:
Software Drives InnovationSoftware engines grew from a supporting role to the highest-growth component at a 16.35% CAGR, even while hardware kept the 41.92 revenue share. Organizations value cloud orchestration, AI-based liveness detection, and decentralized identity wallets that continuously adapt to evolving fraud. Entrust’s acquisition of Onfido aligns with this trajectory, adding deep-fake countermeasures that improved forged-ID prevention five-fold.
The hardware segment remains indispensable where specialized sensors deliver cryptographic templates to secure elements. Infineon’s automotive-qualified fingerprint ICs illustrate how production-grade components expand the biometrics market into mobility and access domains. Services, while smallest, record consistent uptake as integrators customize multi-modal deployments for regulated industries.



By Biometric Modality:
Iris Recognition EmergesIris recognition posts an 19.68% CAGR, supported by liquid-lens optics that lower bill-of-material cost and shrink form factors. Fingerprint remains entrenched with 36.55% of biometrics market share in 2025, thanks to smartphones, payment cards, and time-clock systems. Facial recognition steadily penetrates airports and stadiums, while voice analytics gains footing in call-center authentication.
Behavioral biometrics, particularly gait and keystroke dynamics, add passive layers that elevate security without user friction, expanding opportunities in consumer biometrics. Mature fingerprint and facial solutions increasingly pair with iris, palm-vein, or voice modules in multi-modal kits, diversifying revenue and diluting single-modality risk.
By Contact Type:
Contactless TransformationContactless modalities are scaling at 16.72% CAGR as hygiene and convenience trump legacy mindset. The biometrics market size for contact-based systems, despite a 35.95% share in 2025, is losing momentum to touchless fingerprint, face, and iris kiosks rolled out in healthcare and retail. ZKTeco identifies contactless preference as a long-term secular shift.
Invisible sensing, showcased by Continental’s in-vehicle camera-laser combo, morphs biometrics beyond access into wellness monitoring. AI improvements cut false rejects, moving touchless accuracy closer to contact-based benchmarks and satisfying high-assurance sectors.
By Authentication Type:
Multi-Factor MomentumSingle-factor approaches still account for 63.40% of the 2025 installed base due to ease of deployment. Yet enterprises face deepfake escalations that expose stand-alone biometrics to spoofing. Multi-factor deployments, advancing at a 16.75% CAGR, layer device signals, behavioral analytics, and FIDO passkeys to harden security.
Meta’s patents that fuse vocalization with skin-vibration inputs illustrate how consumer platforms innovate to deliver zero-friction yet resilient sign-in flows. Continuous risk scoring allows adaptive step-ups only when anomalies surface, keeping user effort minimal
By Application:
Payment Authentication AcceleratesPhysical and logical access control retains the largest slice of the biometrics market size at 27.62%, bolstered by commercial real estate retrofits. Payment authentication, however, expands at an 17.95% CAGR, aided by Mastercard’s plan to replace 16-digit numbers with biometric tokens by 2030. Banks benefit from lower fraud and higher approval rates as PINs disappear from tap-to-pay journeys.
eKYC onboarding tools cut account-opening time from days to minutes, driving adoption in challenger banks and fintechs. Automotive OEMs test in-car payments linked to driver profiles, adding incremental volume to payment-focused vendors.
By End-Use Industry:
Healthcare TransformationGovernment and law-enforcement drove 38.10% of 2025 revenue by funding passport, border, and policing upgrades. Healthcare, growing at 16.20% CAGR, exemplifies next-wave potential. NYU Langone’s deployment of palm-vein scanning offers 99.9999% recognition accuracy, reducing duplicate medical records and fraud.
Electronic health record integration and medication-dispensing audits fuel demand for iris and face biometrics. Insurance carriers follow by linking claims processing to verified patient identities, tightening leakage across the care continuum.
Geography Analysis
North America Biometrics Market
North America produced 30.35% of global revenue in 2025, anchored by federal budgets and widespread private-sector adoption. TSA’s accelerating lane expansions and DHS’s USD 250.8 million line-item for identity management provide a multi-year demand floor for vendors . Canada and Mexico modernize land-border e-gates to streamline trade, reinforcing continental scale.
APAC Biometrics Market
Asia Pacific records the steepest trajectory with an 18.10% CAGR forecast to 2031. South Korea’s nationwide mobile-ID completion, China’s codified face-recognition rules, and India’s Aadhaar-linked pay services cultivate a unified biometrics market bigger than any single-country program. The region’s 4.8 billion digital-wallet users push biometric KYC from optional to mandatory across banks and telecoms.
Europe Biometrics Market
Europe’s growth remains steady under strict GDPR oversight. The EU Entry/Exit System rolls out border biometrics across Schengen states, while the United Kingdom’s new trust framework fosters private-sector credential innovation. Nordic pilots prove that on-device processing can satisfy privacy watchdogs without sacrificing speed, shaping procurement criteria across the continent.

Regulatory Landscape
Biometrics deployments are increasingly shaped by converging privacy, AI, and interoperability requirements. In the European Union, the Artificial Intelligence Act, Regulation (EU) 2024/1689, classifies biometric identification as a high-risk AI use case under Annex III. That designation increases compliance expectations around risk management, technical documentation, and conformity assessment for systems used in sensitive contexts. In the United States, the USCIS proposal on the collection and use of biometrics (Federal Register, November 2025) keeps biometric data governance in focus for immigration and identity workflows.
At the technical-standard layer, agencies are also updating interchange formats to support cross-organization use while accommodating newer capture methods. NIST published the ANSI/NIST-ITL 1-2025 update as NIST SP 500-290e4 on March 25, 2026, expanding the data-format foundation used across fingerprint, facial, and other biometric exchanges, including contactless friction ridge capture. For cross-border law-enforcement cooperation, the EU adopted Regulation (EU) 2026/1064 setting technical rules for automated search and exchange of biometric data (DNA, facial images, dactyloscopic data) via the Prum router, which raises the bar for vendors on secure interoperability and standardized data handling.
Value Chain Analysis
The biometrics value chain begins with upstream components, including capacitive, optical, and ultrasonic sensors, cameras and illumination, secure elements and ICs, and compute for on-device or edge inference. From there, the flow moves into OEM module assembly and device manufacturing, then into biometric engines (matching, liveness detection, and orchestration), system integration, and finally channel delivery into government, BFSI, travel, healthcare, and enterprise access control.
Standards and certification function more as gating points than simple checkboxes. High-assurance products often require extended qualification cycles (commonly cited at 12 to 24 months for programs such as FBI-focused or identity-credential related requirements), which influences time-to-revenue and increases the role of specialized test labs and compliance partners. Downstream value creation concentrates in platform integration and lifecycle operations, including enrollment workflows, template management, consent and audit tooling, and ongoing model tuning for bias mitigation and presentation-attack defense. Supply concentration remains a structural constraint in the physical layer, with specialty wafer fabrication and sensor production clustered in hubs including Taiwan, South Korea, and Germany, creating exposure to allocation shocks and encouraging vendors to maintain qualified alternate component lists. Performance sensitivity during substitutions is a recurring operational risk, because mid-production changes in camera or sensor parts can affect liveness and matching outcomes, pushing integrators and software providers to tighten equivalence tolerances and validation processes across deployments.
Competitive Landscape
The biometrics market exhibits moderate consolidation as incumbents buy niche capabilities to satisfy rising regulatory and technical complexity. Entrust closed its Onfido deal to integrate AI-driven forgery detection, targeting enterprises confronting deepfake attacks. IN Groupe’s planned EUR 1 billion (USD 1.13 billion) purchase of IDEMIA Smart Identity would forge a EUR 1 billion-plus revenue powerhouse with diversified geographic reach[3]Security World Market, “IN Groupe set to acquire Smart Identity division…,” securityworldmarket.com.
Strategic alliances pursue standards compliance: Infineon and Fingerprint Cards co-developed SECORA Pay Bio, passing Visa and Mastercard thresholds for commercial launch. Patent analytics show Microsoft, Oracle, and Bank of America filing blockchain and biometric verification patents, underscoring how big-tech and financial institutions converge on decentralized identity.
Emerging disruptors focus on vertical niches. Wink’s merger with Phoenix Managed Networks addresses omnichannel retail, while BioCenturion targets iris and behavioral fusion for defense. Automotive, healthcare, and payment tokens remain under-penetrated white spaces where differentiated UX and compliance acumen translate into margin expansion.
Biometrics Industry Leaders
Fujitsu Limited
NEC Corporation
HID Global Corporation
IDEMIA France SAS
Thales Group
- *Disclaimer: Major Players sorted in no particular order
Biometrics Market Companies Covered in this Report
- Thales Group
- NEC Corporation
- IDEMIA France SAS
- Fujitsu Limited
- HID Global Corporation
- Assa Abloy AB
- Aware Inc.
- Suprema Inc.
- Synaptics Incorporated
- Bio-Key International Inc.
- Zwipe AS
- Fingerprint Cards AB
- M2SYS Technology
- Infineon Technologies AG
- Entrust Corporation
- ImageWare Systems Inc.
- Phonexia s.r.o.
- BioID AG
- Crossmatch Technologies Inc.
- Hitachi Ltd.

Market Opportunities and Future Outlook
Border control and government identity infrastructure continue to generate large, multi-year procurement lanes for biometric capture, matching, and orchestration platforms. The United States advanced this pathway through DHS and CBP actions tied to the Biometric Entry/Exit program, including a final rule effective in December 2025 that formalizes biometric collection requirements at ports of entry. That decision increases demand for interoperable capture devices, liveness checks, and workflow integration across airports and land borders. Standards modernization also supports upgrades from legacy contact capture to newer modalities: NIST SP 500-290e4 (ANSI/NIST-ITL 1-2025), published in May 2026, codifies updated interchange formats that include support for contactless friction ridge capture, helping agencies and suppliers align on consistent data formats.
A second opportunity area sits where privacy compliance and multi-modal architectures intersect, especially in regions tightening controls on biometric identification. The EU AI Act (Regulation (EU) 2024/1689) elevates biometric identification to a high-risk AI category, which increases enterprise willingness to purchase packaged compliance features such as risk-management documentation, audit trails, and deployment guardrails alongside core matching performance. This environment favors vendors that can deliver end-to-end platforms covering hardware capture, software engines, and services for conformity processes, while also supporting sector-specific integrations in payments, access control, healthcare patient identity, and travel ecosystems already shifting toward touchless experiences.
Recent Industry Developments in Biometrics Market
- February 2026: Fujitsu introduced a FIDO2-standard passkey authentication service used by SMBC Nikko Securities to secure online trading accounts with biometric authentication. The deployment supports the shift from passwords toward phishing-resistant sign-in flows, expanding biometrics demand in high-risk digital channels where account takeover has material financial impact.
- December 2025: NEC partnered with emaratech to deploy six biometric smart gates for flydubai's Airport Operations Centre using NeoFace Express X5 facepods. The rollout extends contactless passenger processing and operational access workflows, strengthening airport modernization demand for integrated biometric capture, matching, and lane-management software.
- November 2024: NEC announced development of a compact multimodal face and iris authentication technology targeted for commercial deployment by late 2026. The design direction highlights vendor focus on smaller form factors and multi-modal fusion to improve accuracy, convenience, and policy fit where single-modality use is constrained in sensitive environments.


Biometrics Market Report Scope and Research Methodology
Market Definition and Coverage
For this study, the biometrics market covers revenues earned from technologies and deployments used to identify or authenticate people using biological or behavioral traits, across public and private use cases. It includes the related hardware, software, and solution layers sold for these deployments.
Scope exclusions: We exclude general IT services that are not specific to biometric enablement, and projects that are only identity consulting without biometric capture or matching.
Segments Covered in This Report
- By Component
- Hardware
- Software
- Services
- By Biometric Modality
- Physiological Biometrics
- Fingerprint AFIS
- Fingerprint Non-AFIS (Automated Fingerprint Identification System)
- Facial Recognition
- Iris Recognition
- Others (Palm Vein, Hand Geometry)
- Behavioral Biometrics
- Voice Recognition
- Signature Verification
- Others (Gait Analysis, Keystroke Dynamics)
- Physiological Biometrics
- By Contact Type
- Contact-based
- Contactless
- Hybrid
- By Authentication Type
- Single-factor
- Multi-factor
- By Application
- Physical and Logical Access Control
- Time and Attendance Management
- Payment and Transaction Authentication
- e-Passport and Border Control
- Patient Identification and EHR Security
- Customer On-boarding (eKYC)
- Public Surveillance and Safety
- Automotive and Smart Vehicle Interfaces
- By End-Use Industry
- Government and Law Enforcement
- BFSI
- Healthcare
- Consumer Electronics
- Commercial and Retail
- Travel and Immigration
- Military and Defense
- Automotive
- Education
- Others
- By Geography
- North America
- United States
- Canada
- Mexico
- South America
- Brazil
- Argentina
- Rest of South America
- Europe
- United Kingdom
- Germany
- France
- Italy
- Spain
- Nordics
- Russia
- Rest of Europe
- Asia-Pacific
- China
- Japan
- South Korea
- India
- ASEAN
- Australia
- New Zealand
- Rest of Asia-Pacific
- Middle East and Africa
- Middle East
- Saudi Arabia
- United Arab Emirates
- Turkey
- Israel
- Rest of Middle East
- Africa
- South Africa
- Nigeria
- Kenya
- Rest of Africa
- Middle East
- North America
Data Sources, Market Sizing, and Validation
Desk Research
Desk work started by mapping where biometrics is being adopted and how rules shape deployments, then translating those patterns into revenue pools. Public sources were used to anchor demand signals and timing, such as U.S. government and agency publications on identity programs and travel compliance, European Commission materials and official EU privacy guidance, UN and World Bank digital identification and inclusion indicators, and patent databases that show filing intensity by modality.
After the initial demand picture was anchored, the model was tightened using company filings, investor presentations, product literature, and reputable press coverage, since these sources clarify price direction and shifts in solution mix. We also relied on paid subscriptions for company financials and intelligence, news and financials, and patent databases to speed up screening and cross-check claims. The sources mentioned here are illustrative, and additional public references were also reviewed for collection, validation, and clarification.
Primary Interviews and Surveys
Primary interviews focused on confirming what is being bought and deployed, plus how spending is split between modalities and solution layers, before final assumptions were set. We spoke with technology suppliers, system integrators, channel partners, and large end users across APAC, EMEA, and the Americas, which helped us check adoption pace, average deal sizing, and replacement cycles in operational settings.
Distribution of primary research fieldwork respondents
| Company type | Respondent position | Region |
|---|---|---|
| Top tier: 36% | CXOs: 16% | APAC: 53% |
| Mid tier: 43% | Functional/Unit leaders: 33% | EMEA: 29% |
| Smaller Players: 21% | Managers: 51% | Americas: 18% |
Market-Sizing & Forecasting
Sizing begins with a top-down build where digital identity rollouts, travel and border modernization, device and endpoint penetration, and security compliance requirements are converted into an addressable demand pool by region. Once those demand pools are formed, we apply realistic adoption curves and spending weights, so large one-time programs are not treated as steady recurring demand.
To keep totals grounded, we corroborate with selective bottom-up approximations, including sampled average selling price times expected unit volumes for key modalities, channel checks on deal sizes, and supplier revenue splitting between hardware and software where disclosures allow it. In areas where disclosures are thin, we use ranges from interviews and then narrow them using public program scale markers and import or production signals where relevant.
Forecasts are built using scenario analysis supported by trend consensus from primary respondents, since budgets can shift quickly with regulation and large government tenders. Inputs that typically move the curve include the cadence of national ID and e-gate projects, smartphone and enterprise authentication adoption, privacy regulation enforcement timing, multimodal deployment share, and software platform migration that changes the recurring revenue mix.
Data Validation & Update Cycle
Validation is done through repeated checks that compare model outputs with independent signals, and then variances are investigated until they are explainable. We run anomaly reviews at the country and regional level, test currency conversion timing, and re-check assumptions that create sharp step changes, such as program start dates and replacement cycles.
Before sign-off, the work goes through multi-step analyst reviews where the logic, inputs, and arithmetic are checked separately. Reports are refreshed annually, and interim updates are triggered when material events occur, such as major regulation changes or unusually large contract awards. Right before delivery, an analyst performs a final pass so clients receive the most current view available.
Mordor Intelligence's Biometrics Market Size Measured Against Other Published Estimates
Published market sizes for biometrics can look inconsistent, even when the topic sounds identical, because the boundaries and counting rules are not always the same. Differences usually come from what gets included in scope, how recurring software revenue is treated, and whether one-time public-sector programs are smoothed or counted as sharp jumps.
By tracking program start dates, refresh cadence for regulation-driven demand, and cross-checking modality mix shifts, Mordor Intelligence keeps the 2025 total tied to deployments that involve biometric capture or matching, rather than broader identity spending. Some estimates also apply aggressive growth curves from a single driver, while others compress the market by excluding platform software or by using older exchange-rate timing that understates current-year values.
Benchmark comparison
| Source | Market Size | Gaps in Research Methodology |
|---|---|---|
| Mordor Intelligence | USD 58.98 B (2025) | |
| Industry Publisher A | USD 52.17 B (2025) | Uses a narrower revenue capture approach in 2025, which can occur when platform software and multi-year government rollouts are averaged down, and when coverage emphasizes long-range CAGR over near-term deployment timing. |
| Global Consultancy B | USD 60.32 B (2025) | Shows a slightly higher 2025 level and a much steeper long-term path, which can happen when adjacent identity and security spend is blended in, and when scenario assumptions lean toward faster adoption with limited re-checks against program execution pace. |
Across the three estimates, the spread is mainly explained by scope edges and how quickly adoption is assumed to accelerate after 2025. Our approach stays traceable to clear deployment triggers, realistic spending weights, and repeatable checks, which makes the number easier to defend in planning discussions.


Key Questions Answered in the Report
What is the current size of the biometrics market?
The biometrics market stands at USD 67.86 billion in 2026 and is projected to more than double to USD 136.86 billion by 2031.
Which component segment is growing fastest?
Software leads growth with a 16.35% CAGR as enterprises integrate AI-driven liveness and cloud orchestration.
Why is Asia Pacific the fastest-growing region?
Government digital-ID programs, mobile wallets, and financial-inclusion mandates power an 18.10% CAGR across the region.
How are regulatory risks affecting deployments?
GDPR and BIPA compliance costs plus litigation risks can reduce planned roll-outs by as much as 2.4 percentage points of CAGR, especially in Europe and Illinois.
Page last updated on:




