
Fibrate Drugs Market Size and Share
Market Overview
| Study Period | 2020 - 2031 |
|---|---|
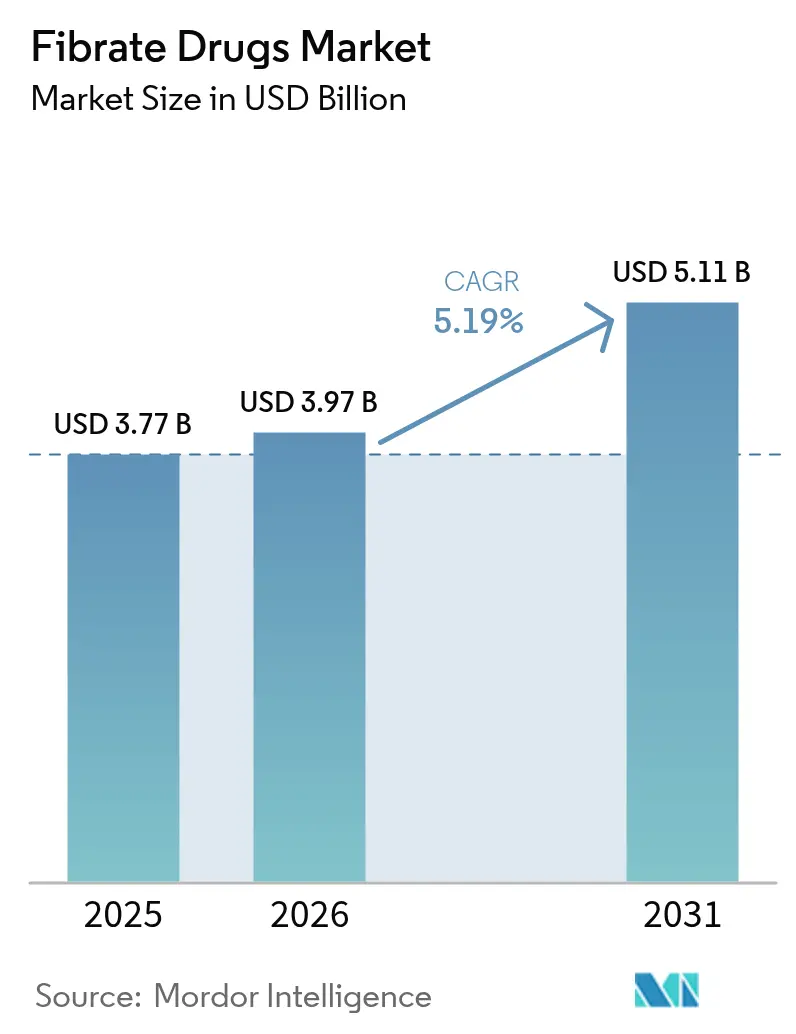
| Market Size (2026) | USD 3.97 Billion |
| Market Size (2031) | USD 5.11 Billion |
| Growth Rate (2026 - 2031) | 5.19 % |
| Fastest Growing Market | Asia-Pacific |
| Largest Market | North America |
| Market Concentration | Medium |
Major Players *Disclaimer: Major Players sorted in no particular order Image © Mordor Intelligence. Reuse requires attribution under CC BY 4.0. | |
Fibrate Drugs Market Analysis by Mordor Intelligence
The fibrate drugs market size was valued at USD 3.77 billion in 2025 and estimated to grow from USD 3.97 billion in 2026 to reach USD 5.11 billion by 2031, at a CAGR of 5.19% during the forecast period (2026-2031). Demand remains steady as cardiovascular risk factors surge worldwide and research broadens fibrate use beyond lipid lowering. The number of adults living with hypertension and diabetes—two key drivers of hypertriglyceridemia—is climbing sharply, with U.S. prevalence alone projected to hit 61.0% and 26.8%, respectively, by 2050. The successful therapeutic repurposing of fenofibrate for diabetic retinopathy, validated by the 27% disease-progression reduction reported in the 2024 LENS trial, further expands the market opportunity. Intensifying generic output—particularly from India and China—keeps prices in check, yet branded competitors are capturing growth through extended-release designs, fixed-dose combinations, and pharmacogenomic positioning. Meanwhile, emerging RNA-based lipid therapies have proven superior triglyceride reduction in Phase II results, signalling stiffer competition but also reinforcing the clinical importance of triglyceride control.
Key Report Takeaways
- By drug class, fenofibrate led with 61.90% of fibrate drugs market share in 2025; bezafibrate is forecast to register the fastest 7.12% CAGR through 2031.
- By product type, generics dominated 2025 revenue with a 74.85% stake, while branded offerings are projected to expand at 6.73% CAGR to 2031.
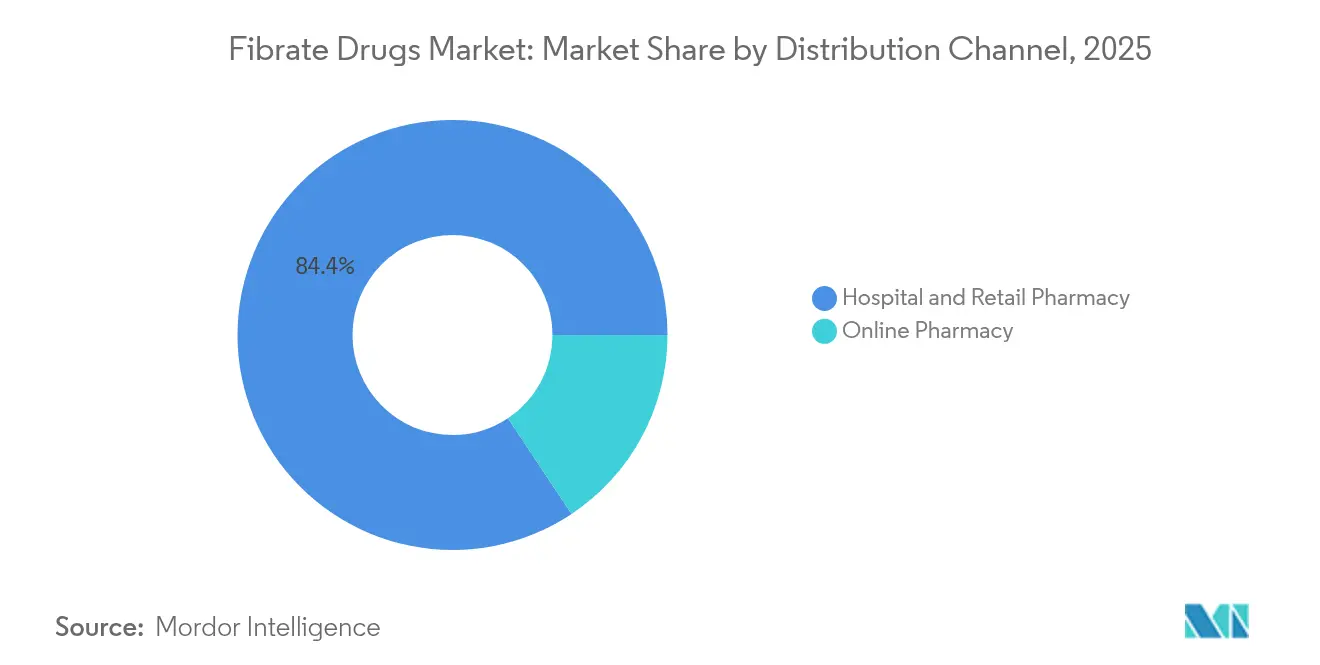
- By distribution channel, hospital and retail pharmacies commanded 84.35% of the market in 2025; online pharmacies represent the fastest-growing channel at an 11.03% CAGR.
- By geography, North America held 38.20% of 2025 revenue; Asia-Pacific is poised to deliver the highest 8.76% CAGR through 2031.
Note: Market size and forecast figures in this report are generated using Mordor Intelligence’s proprietary estimation framework, updated with the latest available data and insights as of 2026.
Global Fibrate Drugs Market Trends and Insights
Drivers Impact Analysis*
| Driver | (~) % Impact on CAGR Forecast | Geographic Relevance | Impact Timeline |
|---|---|---|---|
| Increasing Prevalence Of Cardiovascular Diseases | +1.8% | Global, with highest impact in North America & Europe | Long term (≥ 4 years) |
| High Investment In R&D Of Lipid–Lowering Drugs | +1.2% | North America & EU, spill-over to APAC | Medium term (2-4 years) |
| Rising Incidence Of Metabolic Syndrome & Hypertriglyceridemia | +1.5% | Global, with early gains in Asia-Pacific emerging markets | Long term (≥ 4 years) |
| Expanding Generic Manufacturing Capacity In Emerging Markets | +0.9% | APAC core, spill-over to MEA and South America | Short term (≤ 2 years) |
| Therapeutic Repurposing For Diabetic Retinopathy & CKD | +0.7% | Global, with early adoption in developed markets | Medium term (2-4 years) |
| Precision-Medicine Tools Enabling Targeted Fibrate Therapy | +0.4% | North America & EU initially, expanding globally | Long term (≥ 4 years) |
| Source: Mordor Intelligence | |||
Increasing Prevalence of Cardiovascular Diseases
Cardiovascular morbidity is climbing worldwide, pushing continuous demand for triglyceride-lowering agents. Chinese adults under 40 exhibited a 2.26-fold higher cardiovascular risk in the top triglyceride quartile, underscoring the contribution of elevated TG to early-age events. The American Heart Association’s 2024 update projects sustained expansion of diabetes and hypertension, enlarging the clinical pool for fibrate prescriptions. Hypertriglyceridemia-induced acute pancreatitis already causes one-fifth of global cases, with the burden highest in Asia[1]Jiongdi Lu et al., “Hypertriglyceridemia-Induced Acute Pancreatitis,” BMC Gastroenterology, bmcbio.com. Together, these patterns keep the fibrate drugs market firmly positioned within standard lipid-management algorithms.
High Investment in R&D of Lipid-Lowering Drugs
Capital inflows into lipid science spur innovation that often complements fibrate therapy. Breakthrough RNA therapeutics plozasiran and olezarsen lowered triglycerides far beyond conventional benchmarks in 2024 ACC presentations. Separately, Croda’s USD 133 million project to expand lipid-systems capacity—bolstered by USD 75 million in U.S. federal backing—signals supply-chain confidence in lipid-based technologies[2]Croda International, “U.S. Government Support to Expand Lipid Systems,” croda.com. Such investment nurtures combination-product pipelines pairing fibrates with statins or novel biologics.
Rising Incidence of Metabolic Syndrome & Hypertriglyceridemia
Metabolic syndrome prevalence is accelerating, led by urbanizing economies adopting Westernised diets. In Mongolia, 19.7% of adults screened in 2024 recorded high triglycerides, with abdominal obesity as a chief predictor. Korean cohort data showed the triglyceride-glucose index outperforming HOMA-IR as a predictor of future metabolic syndrome. Women of child-bearing age now carry a heavier metabolic burden, boosting the patient pool eligible for fibrate therapy.
Expanding Generic Manufacturing Capacity in Emerging Markets
India and China continue upgrading capacity, reliability, and compliance, lowering overall cost of therapy. India targets a USD 120 billion pharmaceutical footprint by 2030 and supplies one-fifth of U.S. generic volume. China secured 71% of 2024 NRDL drug listings for domestic firms, reinforcing domestic affordability. These trends underpin cost-effective access and intensify competitive pricing.
Restraints Impact Analysis*
| Restraint | (~) % Impact on CAGR Forecast | Geographic Relevance | Impact Timeline |
|---|---|---|---|
| Frequent Product Recalls & Discontinuations | -0.8% | Global, with highest impact in regulated markets | Short term (≤ 2 years) |
| Stringent Regulatory Framework | -1.1% | North America & EU primarily, expanding globally | Medium term (2-4 years) |
| Payer Preference For Statins & PCSK9 Inhibitors | -1.3% | Developed markets with advanced reimbursement systems | Long term (≥ 4 years) |
| Environmental Curbs On Fluorinated Intermediates Supply Chain | -0.6% | Global manufacturing, concentrated in developed markets | Medium term (2-4 years) |
| Source: Mordor Intelligence | |||
Payer Preference for Statins & PCSK9 Inhibitors
Reimbursement bodies prioritise statins and, increasingly, PCSK9 inhibitors, relegating fibrates to second line unless severe hypertriglyceridemia persists. Claims data reveal 30.95% PCSK9 prescriptions were denied despite price cuts, exposing formulary pressure. Cost-effectiveness models for inclisiran call for an 88% price haircut in China before parity with statin therapy frontiersin.org. Such dynamics reduce fibrate volume where payers enforce step-therapy protocols.
Environmental Curbs on Fluorinated Intermediates Supply Chain
The 2024 EPA rules mandate phasedown of hydrofluorocarbons and close TSCA exemptions for new PFAS, forcing costlier solvent management[3]EPA, “Phasedown of Hydrofluorocarbons,” federalregister.gov. Wastewater studies show fluorinated drugs form up to 75% of extractable organofluorine, intensifying pressure for greener synthesis. Manufacturers lacking alternative chemistries face higher compliance outlays and potential shortages.
*Our forecasts treat driver/restraint impacts as directional, not additive. The impact forecasts reflect baseline growth, mix effects, and variable interactions.
Segment Analysis
By Drug: Fenofibrate Dominance Faces Emerging Competition
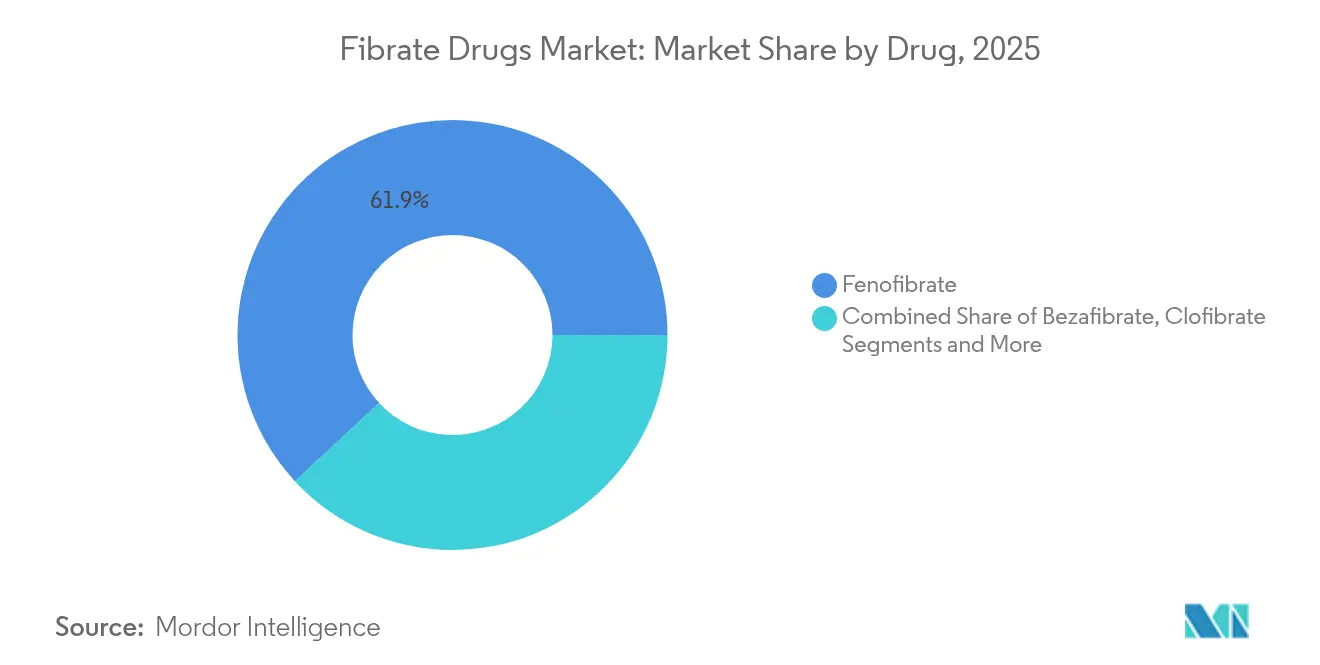
The fibrate drugs market remains led by fenofibrate, which captured 61.90% of global revenue in 2025, a level equal to the largest fibrate drugs market share across any therapeutic class. This anchor position reflects broad clinical familiarity, once-daily dosing, and robust evidence for triglyceride lowering. Growth now centres on repurposing; LENS data show a 27% decline in diabetic-retinopathy progression, enlarging the addressable base within ophthalmology. Bezafibrate, meanwhile, enjoys the quickest uptake, advancing at a 7.12% CAGR as clinicians value its balanced safety-efficacy profile, especially in metabolic-syndrome cohorts. Gemfibrozil retains a niche role where statin interactions are mitigated, while ciprofibrate and clofibrate shrink in volume following legacy safety concerns.
Continued investment in real-world safety monitoring shapes competitive positioning. FDA adverse-event surveillance flagged 68 signals for rosuvastatin-fenofibrate combinations, 28 of which are absent from current labels, underscoring vigilance needs. That scrutiny benefits bezafibrate’s reputation for lower myopathy risk. RNA-based antagonists, though not yet direct fibrate replacements, spotlight the triglyceride pathway’s clinical weight, keeping the fibrate drugs market essential within multimodal lipid control regimens.



By Product Type: Generic Dominance With Branded Innovation
Generics supplied 74.85% of 2025 volume, reflecting mature chemistry, widespread Active Pharmaceutical Ingredient (API) availability, and aggressive tender pricing, chiefly from South Asian producers. The segment delivers predictable revenue but strained margins. Branded products, however, are set to grow 6.73% annually, buoyed by fixed-dose statin-fibrate combinations and extended-release micro-encapsulation that lifts adherence. Where PPARA genotyping identifies likely responders, premium positioning is increasingly defended—an approach that keeps the fibrate drugs industry anchored in value-based care.
Adoption of continuous-flow manufacturing and higher Good Manufacturing Practice thresholds in emerging markets should uplift overall quality, limiting the risk of product recalls that have periodically dented category trust. As a result, branded players that cultivate supply-chain transparency and pharmacovigilance may outsprint generic rivals despite headline price gaps.
By Distribution Channel: Digital Transformation Accelerates Online Growth
Hospital and retail pharmacies sustained an 84.35% share in 2025 thanks to embedded prescribing pathways and insurance ties. Yet, online pharmacies—supported by e-prescription mandates and telehealth norms established during the pandemic—are scaling at an 11.03% CAGR, the briskest within the fibrate drugs market. Automated refill systems and last-mile logistics enhance treatment continuity for chronic indications requiring daily dosing. Traditional channels respond by integrating click-and-collect services and digital counselling, underlining a migration to hybrid dispensing. This shift aligns with payer objectives to improve adherence metrics and cut cardiovascular readmissions, reinforcing market growth.
Two-way data flow between pharmacies and prescribers also feeds population-health analytics, enabling targeted adherence interventions for patients whose pharmacy claims flag poor refill behaviour. Consequently, digital competence is emerging as a differentiator for marketing teams within the fibrate drugs industry.
Geography Analysis
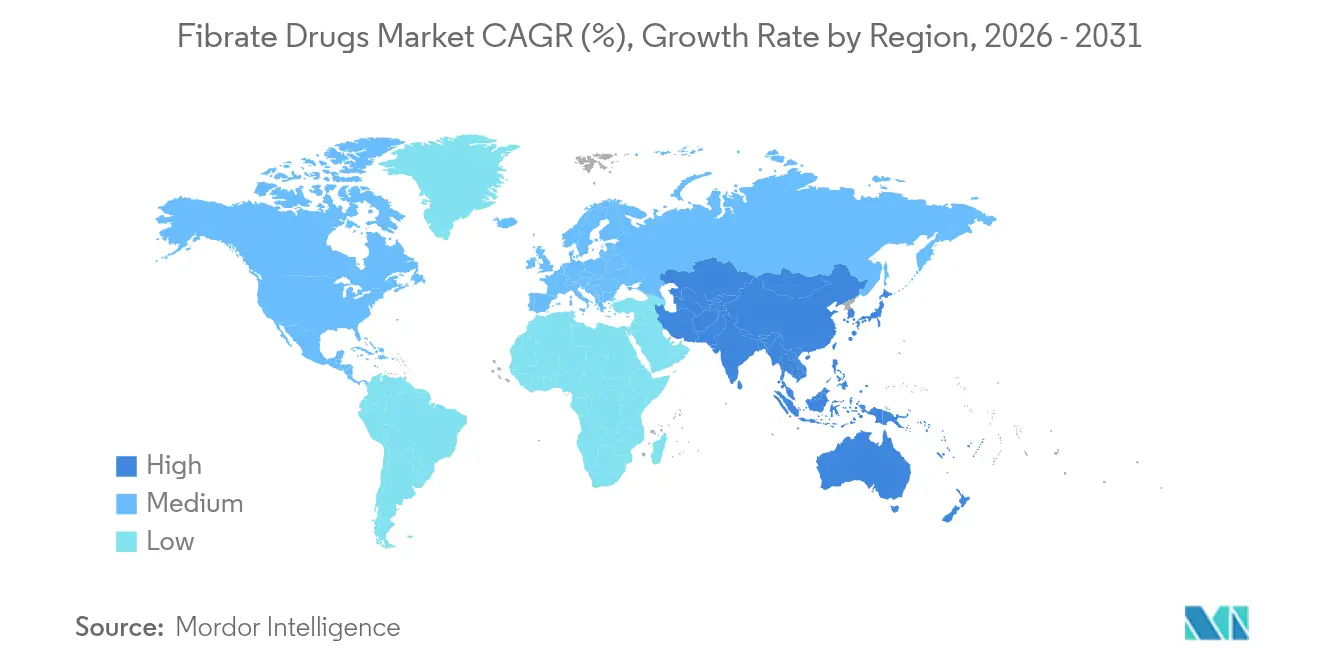
North America generated 38.20% of 2025 global revenue, anchored by comprehensive reimbursement and clinical guidelines that endorse fibrates for persistent hypertriglyceridemia. Wider access to combination pills further elevates prescribing. Yet, PCSK9 coverage denials affecting nearly one-third of claims expose gaps that fibrates cost-effectively fill. Environmental restrictions raise compliance costs for U.S. producers, but established quality systems mitigate severe disruption. Canada’s public-drug programs and Mexico’s growing private insurance segments both widen access, sustaining regional sales momentum.
Asia-Pacific records the fastest 8.76% CAGR, driven by sizable untreated populations, rising obesity rates, and state incentives for metabolic-drug makers. India’s Production Linked Incentive scheme aims at 2026 roll-out, brightening export prospects and enhancing fibrate drugs market size for regional producers. China’s Strategic National Drug negotiations push price ceilings downward, preserving high volume uptake. Japan and South Korea emphasise triglyceride-specific indices, promoting earlier specialist referral. Australia leverages parallel-import policy to keep formularies cost-competitive, widening patient access.
Europe maintains a balanced outlook with payer scrutiny capping unit pricing but real-world evidence rewarding drugs that show additive cardiovascular benefit. Central and Eastern member states adopt generics aggressively, while Western Europe leans on branded innovations backed by head-to-head data. In the Middle East and Africa, economic diversification plans are raising healthcare budgets, yet uptake remains modest relative to disease prevalence. South America’s macroeconomic fluctuations hobble consistent procurement, though Brazil’s cardiac risk-screening expansions support gradual growth. Collectively, these patterns distribute the fibrate drugs market across a broad economic spectrum, insulating revenue from single-region shocks.

Regulatory Landscape
Regulation for fibrate therapies centers on safety labeling, pharmacovigilance, and maintaining product approvals for mature, largely generic molecules. In the United States, FDA oversight includes determinations that affect generic entry and continuity of supply, and in April 2026 the FDA published a Federal Register determination stating that Fenoglide (fenofibrate) tablets (40 mg and 120 mg) were not withdrawn from sale for reasons of safety or effectiveness. This supports continued and future ANDA activity for that reference product. Parallel compliance requirements emphasize current prescribing information and standardized risk communication, and multiple fenofibrate labels were updated across 2025 to align with contemporary benefit-risk language.
In Europe, fibrates remain under the EMA and national competent authorities framework, with long-running safety positioning shaped by class-level reviews and ongoing post-authorization monitoring. The EMA Pharmacovigilance Risk Assessment Committee (PRAC) continued signal assessment activity in June 2026, reinforcing Marketing Authorisation Holder obligations to keep product information updated under the EU pharmacovigilance system. Taken together, labeling scrutiny and active signal detection reinforce a regulated environment where differentiation increasingly depends on quality systems, real-world safety management, and compliant lifecycle maintenance rather than novel approval pathways.
Value Chain Analysis
The fibrate drugs value chain starts with petrochemical-derived starting materials and specialty intermediates used for API synthesis, followed by formulation (often as tablets or capsules), packaging, and regulated distribution through hospital, retail, and online pharmacies. Upstream supply is concentrated in Asia, with India and China functioning as key hubs for API and finished-dosage manufacturing. This arrangement supports global generic availability and tender participation. Manufacturers and marketers operating across the chain include large multinational and regional players such as Sun Pharmaceutical Industries, Abbott, Cipla, and Lupin, and product stewardship is anchored in routinely updated prescribing information and pharmacovigilance obligations.
Midstream and downstream stages are shaped by cGMP compliance, stability-controlled warehousing, and country-specific serialization and labeling, particularly for shipments into tightly regulated markets such as the United States and the European Union. With high generic share in the category, procurement competitiveness depends on reliable API access, compliant batch release, and efficient logistics. Disruptions can also stem from quality events (recalls and discontinuations) and environmental compliance costs that affect solvent and intermediate handling. Channel dynamics increasingly incorporate e-prescriptions and home-delivery models, elevating last-mile fulfillment and inventory visibility alongside traditional wholesaler and pharmacy networks.
Competitive Landscape
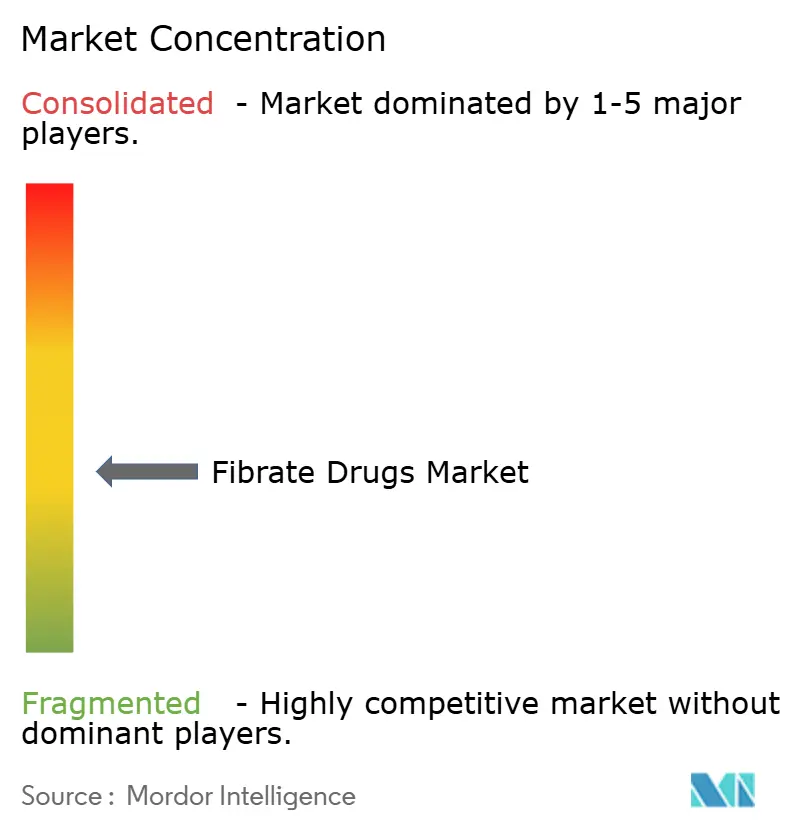
The fibrate drugs market features moderate fragmentation. A cadre of multinational generics houses controls a majority of supply, yet no single entity exceeds the 20% threshold, positioning the market at a competitive equilibrium. Strategic moves in 2024-25 illustrate rivalry on three fronts. First, asset diversification: several incumbents launched fixed-dose rosuvastatin-fenofibrate tablets to head off RNA-drug incursion. Second, geo-expansion: Indian firms acquired Latin American packaging lines to skirt tariff barriers and secure tender bids. Third, technology differentiation: speciality pharma players began bundling PPARA genotype testing kits with premium fenofibrate packs to justify higher reimbursement tiers.
Emergent therapies exert external pressure. Plozasiran and olezarsen, each posting >70% triglyceride reductions in mid-stage trials, may erode fibrate share in severe-hypertriglyceridemia cohorts upon launch. Nevertheless, fibrates retain cost and chronic-safety advantages, especially where payer gatekeeping curbs biologic adoption. Market participants that leverage digital-pharmacy alliances and demonstrate environmental-footprint transparency are best placed to sustain margins in the face of price audits and green-chemistry mandates.
Fibrate Drugs Industry Leaders
Sun Pharmaceutical Industries
Abbott Laboratories
Lupin Ltd
Cipla Ltd
AbbVie Inc
- *Disclaimer: Major Players sorted in no particular order

Market Opportunities and Future Outlook
One near-term opportunity is strengthening generic continuity for established fenofibrate presentations where regulatory status supports additional competition and supply resilience. The FDA determination published in April 2026 that Fenoglide (fenofibrate) 40 mg and 120 mg tablets were not withdrawn for safety or effectiveness keeps the pathway open for continued and new ANDA submissions, which can broaden sourcing options for payers and distributors and support more stable availability for chronic use. A second opportunity is clinical segmentation around severe hypertriglyceridemia, where guideline language and risk-reduction goals emphasize pancreatitis prevention rather than cardiovascular-outcome claims. In May 2026, the ACC/AHA dyslipidemia guideline explicitly describes fibrate use (after the first trimester) as a reasonable adjunct to lifestyle management in pregnant individuals with severe fasting hypertriglyceridemia (>=500 mg/dL), pointing to a specific, high-need cohort.
The category is also being reshaped by label-driven repositioning and lifecycle strategies. Across 2025, FDA-driven labeling updates for fenofibrate products removed or clarified cardiovascular benefit claims, pushing manufacturers toward differentiation through formulation technology, including extended-release approaches, fixed-dose combinations in appropriate patients, and evidence generation in non-traditional endpoints where defensible. Repurposing signals from clinical research, such as fenofibrate data in diabetic retinopathy from the LENS trial, broaden the addressable base for specialty prescribers and care pathways. At the same time, ongoing EMA pharmacovigilance expectations keep quality, safety monitoring, and timely label maintenance central to commercial execution.
Recent Industry Developments
- June 2026: Sun Pharmaceutical Industries was recorded in trade intelligence data as a major exporter of fenofibrate from India, with a reported 7.7% share of Indian fenofibrate exports as of June 2026. The visibility of sustained export throughput highlights scale advantages in a largely generic category where reliability and unit-cost control support tender competitiveness. It also points to the importance of India-linked supply in meeting demand across regulated and emerging markets.
- May 2026: Korea Biopharm and Abbott Laboratories were associated with recorded R&D activity in South Korea for a choline fenofibrate and rosuvastatin calcium combination on May 29, 2026. Tracking activity around fixed-dose combinations reflects ongoing interest in regimen simplification within dyslipidemia management, even as fibrates are positioned more narrowly in guidelines. Such programs raise competitive pressure on standalone generic fibrates by emphasizing adherence and convenience.
- June 2024: The LENS trial reported that fenofibrate reduced diabetic retinopathy progression by 27%, expanding clinical attention beyond triglyceride lowering. The result reinforced the repurposing narrative for a mature molecule and supported broader specialist engagement, particularly in diabetes-related complications. It also encouraged manufacturers to prioritize evidence generation and differentiated positioning in a market dominated by price-led generics.


Research Methodology Framework and Report Scope
Market Definition and Coverage
For this study, the fibrate drugs market covers prescription revenues generated from fibrate class lipid modifying therapies used in managing elevated triglycerides and mixed dyslipidemia, counted at manufacturer-level sales and tracked across major geographies.
Scope exclusions: We exclude non-fibrate lipid therapies (such as statins, PCSK9 inhibitors, omega-3 prescriptions, and other triglyceride lowering classes) and non-prescription supplements.
Segmentation Overview
- By Drug
- Clofibrate
- Gemfibrozil
- Fenofibrate
- Bezafibrate
- Ciprofibrate
- Other Drugs
- By Product Type
- Branded
- Generic
- By Distribution Channel
- Hospital & Retail Pharmacy
- Online Pharmacy
- Geography
- North America
- United States
- Canada
- Mexico
- Europe
- Germany
- United Kingdom
- France
- Italy
- Spain
- Rest of Europe
- Asia-Pacific
- China
- Japan
- India
- South Korea
- Australia
- Rest of Asia-Pacific
- Middle East and Africa
- GCC
- South Africa
- Rest of Middle East and Africa
- South America
- Brazil
- Argentina
- Rest of South America
- North America
Data Sources, Market Sizing, and Validation
Desk Research
Desk work started with mapping the treated dyslipidemia population and the role fibrates still play in guidelines and real-world care, then linking that to price and volume signals. For epidemiology and prescribing context, we relied on public sources such as the World Health Organization, the US CDC, the OECD health statistics, and national medicine agencies, including reimbursement rules that can shift usage patterns.
For trade and supply-side checks, we used sources such as UN Comtrade and other official customs statistics, alongside peer-reviewed journals indexed on PubMed for evidence on fibrate use, combination therapy, and switching patterns.
To convert the story into numbers, we also used company annual reports, investor presentations, press releases, and regulatory product labeling for dosing and pack details. In parallel, paid subscriptions for company financials and intelligence, news and financials, and patent databases were used selectively to avoid gaps around ownership changes, launches, and loss of exclusivity timing that can move revenues. These desk research sources are illustrative only, and many additional public and subscription sources were also used for data collection, cross-checks, and clarification.
Primary Interviews and Surveys
Primary discussions were used to pressure-test the desk assumptions on where fibrates are still initiated, how generics are priced in practice, and what share moves through hospital versus retail and online channels. We spoke with a mix of manufacturers, distributors, pharmacists, and clinicians, and regional feedback helped validate differences in reimbursement, patient adherence, and substitution to other lipid therapies across major markets.
Distribution of primary research fieldwork respondents
| Company type | Respondent position | Region |
|---|---|---|
| Top tier: 29% | CXOs: 20% | APAC: 45% |
| Mid tier: 49% | Functional/Unit leaders: 28% | EMEA: 29% |
| Smaller Players: 22% | Managers: 52% | Americas: 26% |
Market-Sizing & Forecasting
Market size was built using a top-down demand pool approach where dyslipidemia prevalence is filtered into a treated cohort, then split by the portion eligible for fibrates based on therapy position and regional prescribing norms. To translate demand into value, the model applies market-level price assumptions using typical daily dose, average treatment duration, and generic versus branded mix, then adjusts for channel margins and reimbursement effects.
We then corroborated totals with selective bottom-up checks, including sampled country roll-ups of volume proxies (packs or standard units) multiplied by realistic average selling prices, plus sanity checks against manufacturer revenue commentary where it is publicly visible. Inputs that mattered most included triglyceride management guideline adoption, generic price erosion patterns after loss of exclusivity, substitution toward other lipid therapies in high-risk patients, distribution channel mix shifts, and major country reimbursement changes. Forecasting relied on scenario analysis supported by primary feedback, where base, conservative, and faster-switch cases were run around therapy substitution, pricing, and uptake stability, then consolidated into one published forecast.
Data Validation & Update Cycle
Validation was handled through multiple checks, starting with internal consistency tests across countries so that volumes, prices, and channel splits did not conflict with known market realities. Results were compared against independent signals such as reported prescription trends discussed in clinical literature, major generic entry timing, and country policy changes that can quickly alter patient access.
Before sign-off, anomalies were reviewed by another analyst, and follow-up calls were triggered when a country result moved outside expected ranges versus its epidemiology and pricing context. The report is refreshed annually, and interim updates are made when material events occur, such as major label changes, significant reimbursement revisions, or a large supply disruption. Right before delivery, a final pass is completed so clients receive the most current set of assumptions and outputs.
Mordor Intelligence's Fibrate Drugs Market Sizing Compared With Other Published Estimates
Published market numbers for fibrate drugs can look different because groups do not always count the same drug classes, geographies, and pricing layers, and the year chosen as the anchor can shift the value. Differences also show up when one model relies mainly on broad cardiovascular drug totals, while another ties estimates to the actual treated population and typical dosing behavior.
The main gap comes from whether adjacent lipid therapies and combination regimens get bundled into the same pool. In Mordor Intelligence's model, revenues are counted only for fibrate-class products, then priced using country-level generic versus branded mix and realistic therapy duration assumptions.
Benchmark comparison
| Source | Market Size | Gaps in Research Methodology |
|---|---|---|
| Mordor Intelligence | USD 3.97 B (2026) | |
| Trade Journal A | USD 3.53 B (2024) | Uses an earlier anchor year and appears to lean on broader historic growth rates, with limited visibility on how generic price erosion and regional channel mix were applied in the value build. |
| Industry Bulletin B | USD 3.50 B (2024) | Reports a single-year value with a longer horizon forecast, but the scope and conversion of volume to value are not clearly tied to treated cohort, dosing norms, and branded versus generic split across countries. |
The table shows that year selection and scope handling explain most of the spread, and pricing logic adds a second layer of difference. By keeping inputs tied to treated patients, typical dosing, and realistic price mix, the final number stays traceable to clear variables that can be rechecked market by market.


Key Questions Answered in the Report
What is the current value of the fibrate drugs market?
The global fibrate drugs market size is USD 3.97 billion in 2026 and is projected to reach USD 5.11 billion by 2031.
Which drug holds the largest share of sales?
Fenofibrate leads with 61.90% of 2025 revenue, anchored by extensive clinical use and expanding ophthalmic indications.
Why is Asia-Pacific growing fastest?
High metabolic-disease prevalence, rising healthcare budgets, and capacity expansion in India and China drive an 8.76% CAGR for the region.
How are online pharmacies influencing market dynamics?
They are the fastest-advancing channel at an 11.03% CAGR, improving adherence through automated refills and home delivery.
What new therapies may compete with fibrates?
RNA-based agents such as plozasiran and olezarsen achieved superior triglyceride cuts in 2024 trials, potentially challenging fibrate use in severe cases.
How is precision medicine affecting fibrate adoption?
PPARA genotyping identifies responders, enabling targeted therapy and supporting premium pricing for differentiated formulations.
Page last updated on:


 Your data is secure and never sold or shared.


