Event Stream Processing Market Size and Share
Market Overview
| Study Period | 2020 - 2031 |
|---|---|
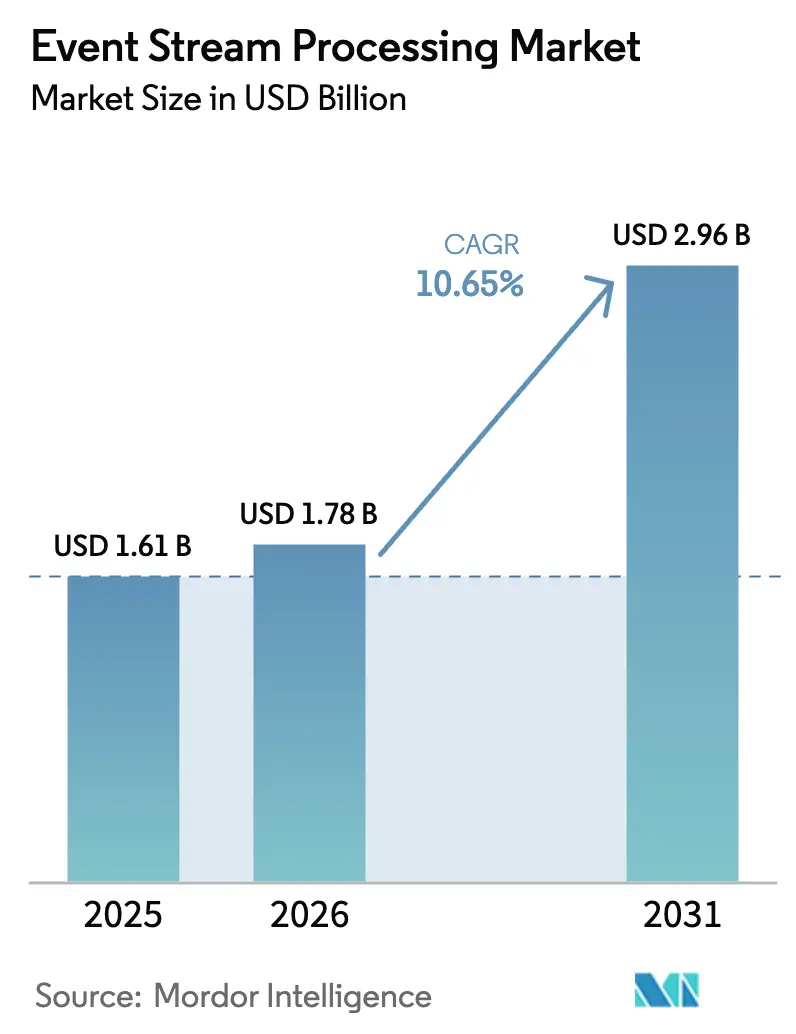
| Market Size (2026) | USD 1.78 Billion |
| Market Size (2031) | USD 2.96 Billion |
| Growth Rate (2026 - 2031) | 10.65% CAGR |
| Fastest Growing Market | Asia-Pacific |
| Largest Market | North America |
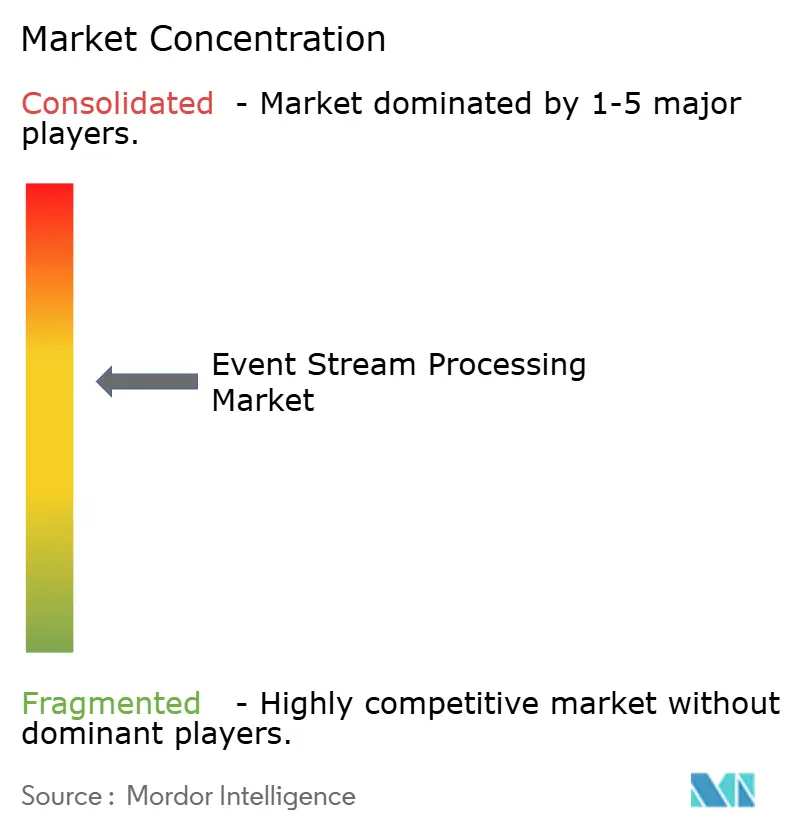
| Market Concentration | Medium |
Major Players *Disclaimer: Major Players sorted in no particular order Image © Mordor Intelligence. Reuse requires attribution under CC BY 4.0. | |
Event Stream Processing Market Analysis by Mordor Intelligence
The event stream processing market size is projected to be USD 1.61 billion in 2025, USD 1.78 billion in 2026, and reach USD 2.96 billion by 2031, growing at a CAGR of 10.65% from 2026 to 2031. Enterprises are shifting from batch analytics to sub-second decision systems that support algorithmic trading, fraud scoring, and autonomous production lines. Regulatory deadlines such as MiFID III in Europe, live since January 2025, require microsecond-accurate trade reporting and amplify demand for low-latency platforms. Telcos rolling out 5G standalone cores in Asia-Pacific stream terabytes of telemetry each hour, overwhelming legacy monitoring tools and accelerating cloud-native pipeline deployments. Meanwhile, container orchestration has matured enough to let firms autoscale Apache Flink or Kafka Streams workloads on Kubernetes, reducing idle infrastructure costs and democratizing adoption.
Key Report Takeaways
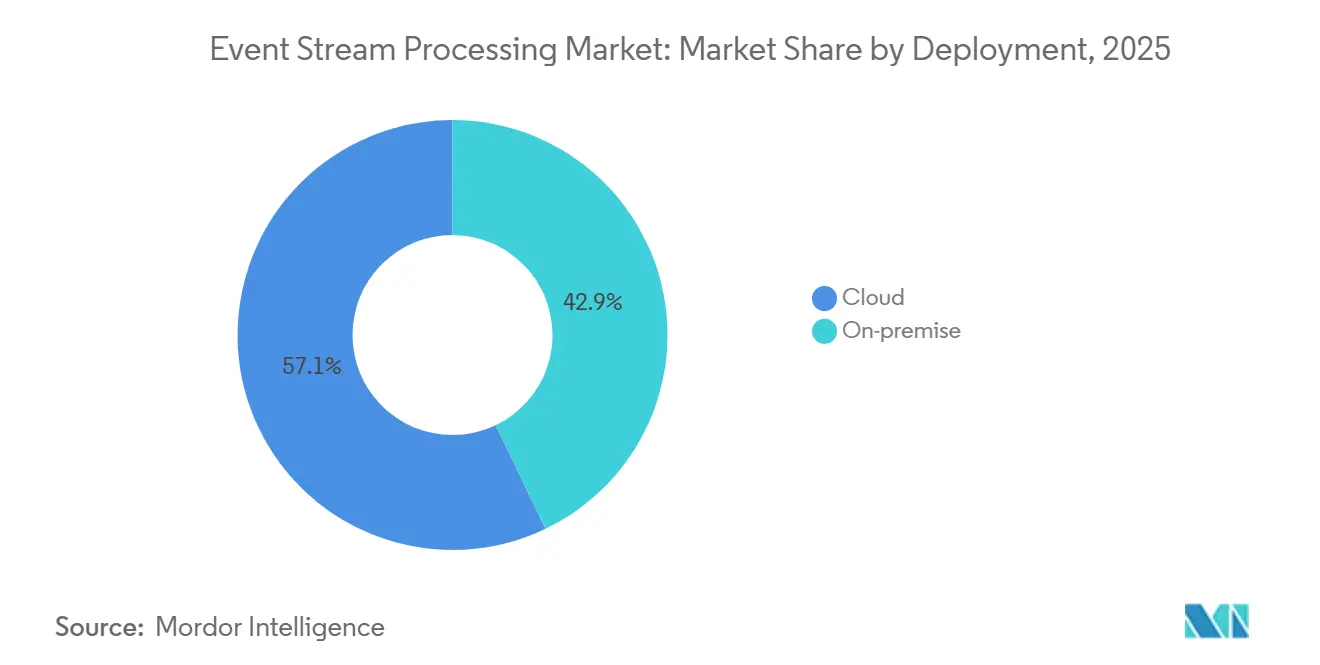
- By deployment type, cloud installations commanded 57.12% of revenue in 2025 while posting the fastest forecast growth at an 11.32% CAGR through 2031.
- By component, solutions captured 64.31% share in 2025, whereas services are set to expand at a 10.78% CAGR as enterprises outsource Apache Flink and Kafka Streams expertise.
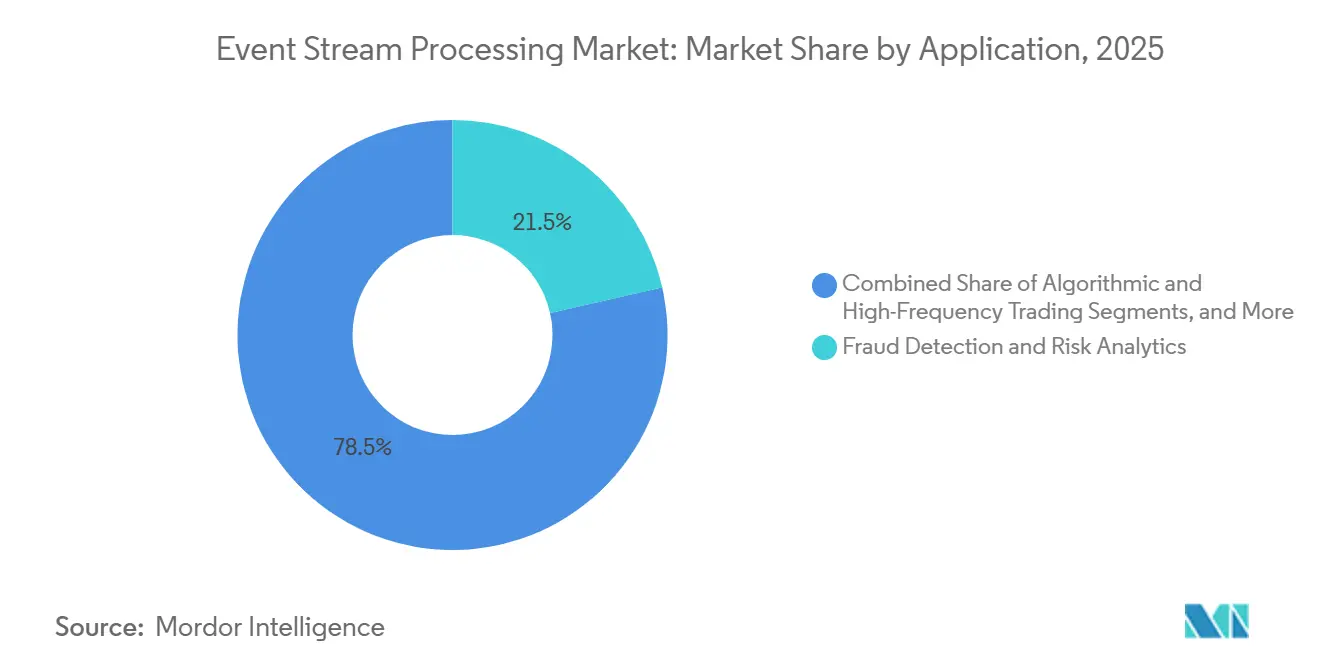
- By application, fraud detection held 21.46% of revenue in 2025, yet sales and marketing personalization is projected to grow at a 13.64% CAGR on the back of millisecond product-recommendation engines.
- By end-user vertical, banking, financial services, and insurance led with 26.83% revenue share in 2025, while retail and e-commerce are on track for the highest CAGR at 14.93% through 2031.
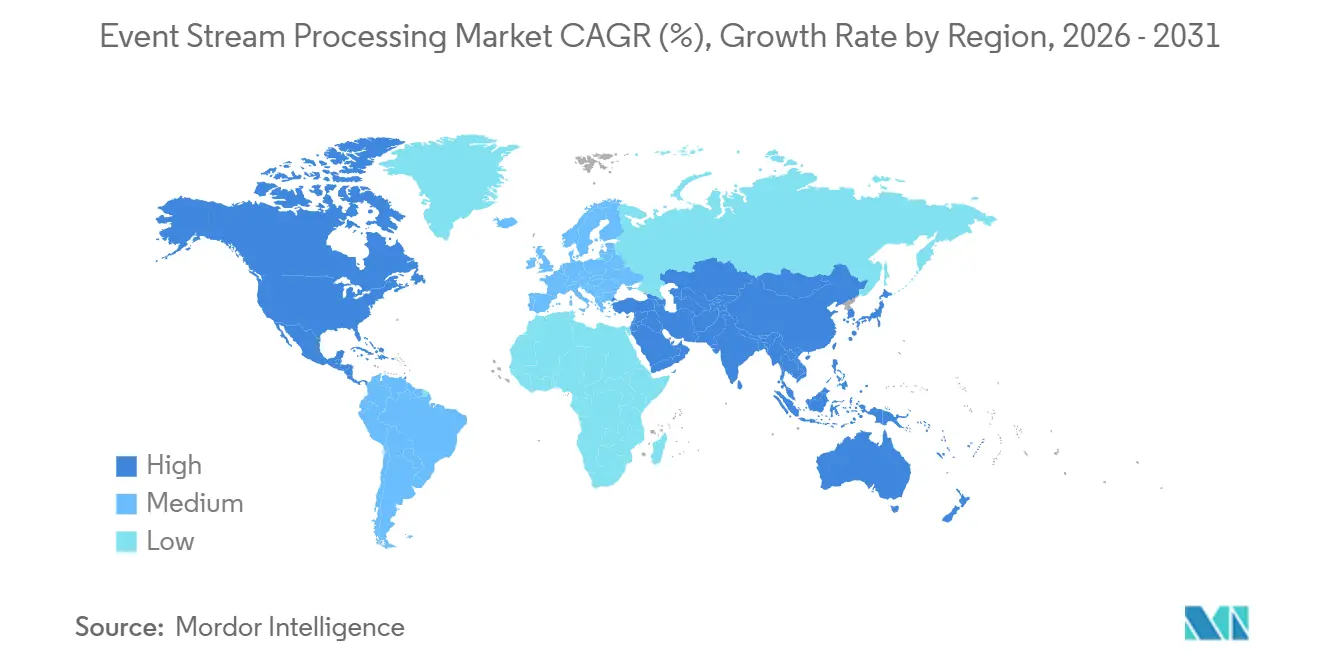
- By geography, North America accounted for 38.64% of revenue in 2025; Asia-Pacific is forecast to post the quickest regional expansion at a 13.60% CAGR to 2031.
Note: Market size and forecast figures in this report are generated using Mordor Intelligence’s proprietary estimation framework, updated with the latest available data and insights as of January 2026.
Global Event Stream Processing Market Trends and Insights
Drivers Impact Analysis*
| Driver | (~) % Impact on CAGR Forecast | Geographic Relevance | Impact Timeline |
|---|---|---|---|
| North-American Kubernetes-Native Data Pipelines Accelerate ESP Adoption | +1.8% | North America, with spillover to Europe and Asia-Pacific | Medium term (2-4 years) |
| MiFID III Real-Time Reporting Drives Low-Latency Trading Analytics in Europe | +1.5% | Europe, particularly UK, Germany, France | Short term (≤ 2 years) |
| 5G SA Network Telemetry Surges ESP Demand Across Asia-Pacific Telcos | +2.1% | Asia-Pacific core, with early adoption in China, Japan, South Korea | Medium term (2-4 years) |
| Industry-4.0 Predictive-Maintenance Sensors Expand ESP Use in German and Japanese Plants | +1.3% | Germany, Japan, with adoption spreading to US and China manufacturing hubs | Long term (≥ 4 years) |
| US Retail Self-Checkout Fraud Analytics Adoption | +1.0% | North America, expanding to Europe and Australia | Short term (≤ 2 years) |
| OTT Video CX Monitoring Growth in India and Southeast Asia | +1.4% | India, Southeast Asia (Indonesia, Thailand, Vietnam), with potential in Middle East | Medium term (2-4 years) |
| Source: Mordor Intelligence | |||
Kubernetes-Native Data Pipelines Accelerate ESP Adoption
Cloud Native Computing Foundation standardization of Kubernetes Event-Driven Autoscaling in 2024 lets teams scale Apache Flink or Pulsar pods based on topic lag, trimming idle compute costs by 30-40% compared with static virtual machines. Redpanda’s C++ architecture removes Java Virtual Machine overhead and delivers sub-10 ms p99 latency, a performance tier that financial institutions require for real-time fraud scoring. Airbyte disclosed that 62% of new connectors launched in 2024 target Kubernetes clusters, signaling that containers have become the default substrate for streaming workloads. As Helm charts and Operators mature, mid-sized retailers can deploy enterprise-grade pipelines without a dedicated site-reliability team, reallocating capital toward data-science talent.
MiFID III Real-Time Transaction Reporting
The Markets in Financial Instruments Directive III compels investment firms to report orders, amendments, and cancellations within one business day and with 1-microsecond timestamp accuracy.[1]European Securities and Markets Authority, “MiFID III Transaction Reporting,” esma.europa.eu McKinsey found that 73% of European banks budgeted at least 20% spending increases for low-latency analytics in 2025, predominantly for Apache Flink clusters co-located at exchange data centers. Systematic internalizers must now prove best execution, driving demand for millisecond-level order-book aggregation. Banks such as Deutsche Bank and BNP Paribas publicly confirmed moves to event stream processing platforms that flag compliance breaches before end-of-day reconciliation.
5G Stand-Alone Telemetry Growth
EXFO’s 2024 survey of 150 Asia-Pacific operators revealed that a mid-size 5G SA network emits more than 1 TB of telemetry per hour.[2]EXFO, “Network Automation Survey 2024,” exfo.com 3GPP Release 18 formalized the Network Data Analytics Function, exposing streaming metrics that carriers monetize as real-time location intelligence. China Mobile runs Apache Flink clusters in 31 provincial data centers and cut mean time to repair by 40%. Similar deployments at NTT Docomo and SK Telecom support predictive base-station maintenance, underlining telecom leadership in the Event stream processing market.
Industry 4.0 Predictive-Maintenance Sensors
The Fraunhofer Institute reported that 58% of German manufacturers streamed vibration and temperature data to cloud analytics in 2024. Siemens’ MindSphere ingests 50 billion sensor readings daily to anticipate bearing or motor failures 72 hours ahead. Japan’s Ministry of Economy, Trade and Industry is collaborating with Germany to standardize predictive-maintenance schemas, ensuring that the same Flink code runs in plants from Stuttgart to Nagoya. This interoperability lowers integration cost and widens the addressable Event stream processing industry base within manufacturing.
Restraints Impact Analysis*
| Restraint | (~) % Impact on CAGR Forecast | Geographic Relevance | Impact Timeline |
|---|---|---|---|
| Proliferation of Divergent Open-Source Engines Complicates Enterprise Standardization | -1.2% | Global, with an acute impact in enterprises operating multi-cloud environments | Medium term (2-4 years) |
| China and EU Data-Residency Mandates Elevate On-Prem CapEx | -1.5% | China, the EU (particularly Germany, France), with spillover to India and Brazil | Long term (≥ 4 years) |
| Scarcity of Apache Flink or Kafka-Streams Talent in Emerging Markets | -0.9% | Latin America, Africa, Southeast Asia, with a moderate impact in Eastern Europe | Medium term (2-4 years) |
| High Cost of Sub-50 ms Infrastructure for Capital-Market Workloads | -0.7% | Global financial centers (New York, London, Tokyo, Hong Kong, Singapore) | Short term (≤ 2 years) |
| Source: Mordor Intelligence | |||
Proliferation of Divergent Open-Source Engines Complicates Standardization
Linux Foundation research shows 47% of organizations run two or more streaming engines simultaneously, usually pairing Kafka Streams with Flink.[3]Linux Foundation, “2024 Stream Processing Survey,” linuxfoundation.org Each framework has distinct state-management semantics, monitoring stacks, and serialization formats, driving up total cost of ownership. The lack of a universal streaming SQL standard forces firms into vendor-specific dialects that create lock-in. While Ververica and StreamNative offer managed abstractions, uptake remains limited to early adopters ready to absorb platform risk.
China and EU Data-Residency Mandates Elevate On-Premise CapEx
China’s Personal Information Protection Law compels firms to store citizen data onshore, barring routine transfers to foreign cloud regions. The EU’s data-transfer rules impose parallel constraints after the 2024 invalidation of the EU-US framework. Deloitte estimates that on-premises Kafka or Flink clusters cost 40-60% more over their lifecycles than comparable managed services. As similar bills advance in India and Brazil, global enterprises must maintain multiple local clusters, fragmenting operations and slowing the expansion of the event stream processing market.
*Our forecasts treat driver/restraint impacts as directional, not additive. The impact forecasts reflect baseline growth, mix effects, and variable interactions.
Segment Analysis
By Deployment Type: Cloud Dominance Reflects Kubernetes Maturity
Cloud installations held 57.12% of the Event stream processing market share in 2025 and are forecast to compound at an 11.32% CAGR through 2031. This surge aligns with maturing autoscaling on Kubernetes, letting operators modulate compute to workload volatility without manual tuning. Financial firms that once shunned public clouds for latency or sovereignty concerns now run hybrid topologies, keeping order books on-premise but normalizing market data in the cloud to shorten development cycles.
The economic advantage of cloud narrows once workloads exceed 100 TB of daily throughput, after which dedicated hardware amortizes quickly. However, hyperscale vendors bundle machine-learning, data-lake, and BI services, creating switching costs that preserve cloud momentum. Data-residency rules in China or Germany force some clusters on-premise, but most global firms still view managed services as the default. As a result, the Event stream processing market continues its pivot toward consumption-based pricing, and multicloud is emerging as best practice for risk mitigation.


By Component: Services Growth Reflects Skills Scarcity
Solutions generated 64.31% of revenue in 2025, yet services are projected to grow at a 10.78% CAGR to 2031 as enterprises confront a shortage of engineers fluent in stateful stream processing. Professional-services practices inside Accenture, Capgemini, and Infosys now specialize in event-driven architectures, filling capability gaps for financial services and telecom clients. Confluent reported 35% year-over-year managed-service revenue growth in Q3 2024 on the back of migrations from self-hosted Kafka.
Streaming analytics add value on top of core engines, offering SQL interfaces and auto-ML hooks that let business users interrogate data without Java or Scala. Databricks’ Delta Live Tables simplified streaming ETL and saw 1,000 production deployments in its first six months. Demand for governance features such as lineage and quality checks is rising as regulators scrutinize real-time risk models, reinforcing services growth in the broader Event stream processing industry.
By Application: Personalization Engines Outpace Fraud Detection
Fraud detection held 21.46% of segment revenue in 2025, reflecting long-standing use in payments and banking. Yet sales and marketing personalization is on track for a 13.64% CAGR through 2031, the highest across applications, as e-commerce sites integrate millisecond recommender systems. Amazon processes over 10 million clickstream events per second at peak to tailor product rankings. That velocity underscores how real-time inference is becoming baseline customer experience.
Algorithmic trading remains niche but revenue-dense, relying on co-located servers and C++-based engines such as Redpanda for sub-10 ms p99 latency. Process monitoring in manufacturing and energy uses the Event stream processing market size to contextualize sensor readings, while location intelligence helps logistics providers reroute fleets around congestion. Privacy laws like GDPR temper personalization, requiring explicit user consent before cross-site behavior aggregation, which could marginally slow growth but will not outweigh retailers’ demand for conversion gains.

By End-User Vertical: Retail Surge Driven by Omnichannel Demands
The Event stream processing market size for banking, financial services, and insurance represented 26.83% of revenue in 2025, proving the sector’s historical leadership. Retail and e-commerce are forecast to expand at a 14.93% CAGR, driven by unified inventory systems that update stock positions within seconds of each sale. Walmart’s platform handles more than 50 million events per hour to avoid overselling and to enable same-day fulfillment.
Telecommunications ranks third as operators pivot from legacy probes to Event stream processing market architectures that analyze quality-of-service metrics in real time. Manufacturing, energy, and healthcare follow, each adopting predictive maintenance or patient-monitoring pipelines as regulatory guidance allows. Smaller verticals such as education and public sector trail due to budget and talent shortages, yet still provide a long-tail revenue floor.
Geography Analysis
North America led the Event stream processing market with 38.64% revenue share in 2025 thanks to early adoption by hyperscale cloud vendors and high-frequency trading firms. Chicago and New Jersey data-center ecosystems, located meters from exchange engines, continue to attract co-location spend that fuels ultra-low-latency innovation. U.S. retailers also pioneer self-checkout fraud analytics, adding incremental demand for real-time platforms.
Asia-Pacific is forecast to post a 13.60% CAGR, the fastest worldwide, buoyed by 5G SA telemetry loads in China, Japan, and South Korea. India’s over-the-top video services deliver content to 900 million viewers and rely on second-by-second buffering and latency telemetry to optimize CDNs. Data-localization rules in China and Indonesia force operators to deploy clusters inside national borders, raising costs yet guaranteeing steady local spend.
Europe’s trajectory hinges on MiFID III enforcement, which obliges financial firms to upgrade to microsecond-accurate pipelines and timestamp every order change. Germany leads Industry 4.0 deployments that stream vibration and acoustic data for predictive maintenance. The Middle East funds smart-city dashboards through Saudi Vision 2030, integrating traffic-light, water-meter, and air-quality sensors. South America and Africa remain smaller but growing, with Brazil’s e-commerce firms and South Africa’s banks acting as regional pioneers despite limited talent pools.

Competitive Landscape
The top five vendors, Confluent, IBM, Amazon Web Services, Microsoft, and Google, collectively control under 50% of the Event stream processing market, confirming moderate fragmentation. Confluent’s 2024 acquisition of Immerok unites Kafka’s event log with Flink’s stateful computation, giving it a differentiated end-to-end stack. Amazon and Microsoft counter by stitching managed Kafka or Flink into their broader AI and analytics suites, anchoring customers via integrated billing and identity controls.
Specialists such as Redpanda, Ververica, Hazelcast, and StreamNative compete on predictable latency and operational simplicity, traits valued in capital markets and gaming. Redpanda’s USD 100 million Series D round, led by GV, funds the build-out of a managed service aimed at enterprises frustrated by Kafka’s JVM overhead. At the edge, Imply and TIBCO target industrial gateway workloads that cannot afford round-trip latency to a central cloud.
Open-source governance under the Apache Foundation prevents a single vendor lock-in but also fractures the ecosystem, prompting enterprises to pay premiums for commercial distributions that guarantee support. System integrators fill gaps by shipping turnkey architectures, and hyperscalers bundle free-tier ingress or outbound data waivers to entice lift-and-shift migrations. Overall, innovation is pacing regulation rather than the other way around, ensuring a vibrant competitive field.
Event Stream Processing Industry Leaders
Confluent Inc.
IBM Corporation
Amazon Web Services Inc.
Microsoft Corporation
Google LLC
- *Disclaimer: Major Players sorted in no particular order

Recent Industry Developments
- January 2026: Microsoft activated cross-region replication for Fabric Real-Time Intelligence, allowing European customers to meet data-sovereignty rules without manual duplication.
- October 2024: Confluent completed its acquisition of Immerok, integrating Flink into the Confluent Cloud roadmap.
- September 2024: Redpanda Data raised more than USD 100 million in Series D funding to accelerate enterprise support and launch a managed cloud offering.
- August 2024: Microsoft launched Fabric Real-Time Intelligence, giving Power BI users drag-and-drop streaming dashboards.


Research Methodology Framework and Report Scope
Market Definitions and Key Coverage
Our study defines the event stream processing market as the revenue generated worldwide from purpose-built software platforms, engines, and companion services that ingest, enrich, and analyze continuous data flows in real or near-real time to trigger actionable insights.
Scope exclusion: revenue linked purely to batch analytics stacks, log-only management tools, or generic message brokers is excluded.
Segmentation Overview
- By Deployment Type
- Cloud
- On-Premise
- By Component
- Solutions
- Stream Processing Engines
- Streaming Analytics Software
- Event Visualization and Dashboarding
- Services
- Professional Services
- Managed Services
- Solutions
- By Application
- Fraud Detection and Risk Analytics
- Algorithmic and High-Frequency Trading
- Process and Operations Monitoring
- Location Intelligence and Geospatial Analytics
- Sales and Marketing Personalization
- Customer Experience and Sentiment Analysis
- Other Application
- By End-User Vertical
- IT and Telecommunications
- BFSI
- Manufacturing
- Retail and eCommerce
- Energy and Utilities
- Healthcare and Life Sciences
- Transportation and Logistics
- Others
- By Geography
- North America
- United States
- Canada
- Mexico
- South America
- Brazil
- Argentina
- Rest of South America
- Europe
- Germany
- United Kingdom
- France
- Italy
- Spain
- Rest of Europe
- Asia Pacific
- China
- Japan
- South Korea
- India
- Australia
- New Zealand
- Rest of Asia-Pacific
- Middle East and Africa
- Middle East
- United Arab Emirates
- Saudi Arabia
- Turkey
- Rest of Middle East
- Africa
- South Africa
- Nigeria
- Kenya
- Rest of Africa
- Middle East
- North America
Detailed Research Methodology and Data Validation
Primary Research
Mordor analysts hold structured calls with solution architects at cloud providers, chief data officers across BFSI, and OT leads in manufacturing hubs in North America, Europe, and Asia-Pacific. The conversations verify price bands, deployment penetration, and regional adoption triggers that secondary material cannot fully surface.
Desk Research
We start with publicly available tier-1 datasets that anchor volumes and spending patterns, such as US Bureau of Labor Statistics ICT spend, Eurostat Digital Economy indicators, and UN COMTRADE sensor export flows. Trade-body portals like the Linux Foundation's LF Edge and TM Forum add implementation counts, while peer-reviewed journals in IEEE Xplore surface latency benchmarks for stream engines. Subscription resources inside Mordor, including Dow Jones Factiva for deal alerts and D&B Hoovers for vendor financial splits, let us align technology roll-outs with real revenue flows. This list is illustrative; many other sources underpin our desk work.
Market-Sizing & Forecasting
A top-down demand-pool reconstruction converts enterprise IT spending on real-time analytics into a dedicated stream-processing outlay, drawing on indicators such as Kafka cluster counts, 5G standalone base-station rollouts, fraud-case volumes, average streaming-engine annual contract value, and sensor node shipments. Results are then checked through sampled supplier roll-ups and channel ASP × volume tests. Forecasts use multivariate regression that ties CAGR projections to growth in edge IoT nodes, cloud data-warehouse queries, and open-source commit velocity, with scenario ranges vetted by our primary contacts.
Data Validation & Update Cycle
Before sign-off, two senior reviewers stress-test anomalies against historical patterns and fresh newsfeeds. Models refresh every twelve months and are re-opened sooner when a material event, like a landmark acquisition or regulatory mandate, moves the baseline. Clients therefore receive the latest vetted view each time.
Why Our Event Stream Processing Baseline Commands Reliability
Published estimates frequently diverge because firms pick different component mixes, conversion rates, and refresh cadences.
We acknowledge these variables upfront and show below how they shift the headline number.
Benchmark comparison
| Market Size | Anonymized source | Primary gap driver |
|---|---|---|
| USD 1.21 B (2024) | Mordor Intelligence | - |
| USD 2.12 B (2024) | Regional Consultancy A | Bundles data-integration platforms and advisory revenue |
| USD 0.77 B (2024) | Trade Journal B | Focuses on SMB software licenses and omits managed cloud services |
| USD 0.93 B (2023) | Industry Association C | Uses earlier base year and excludes support subscriptions |
The comparison shows that when scope widens to adjacent integration tools, values inflate, while narrow license-only counting pulls totals down. Mordor's disciplined variable selection, annual refresh, and dual-path validation give decision-makers a balanced point they can trace back to clear assumptions and replicated steps.


Key Questions Answered in the Report
What is the current value of the Event stream processing market?
The Event stream processing market is valued at USD 1.78 billion in 2026 and is forecast to reach USD 2.96 billion by 2031.
How fast is demand for cloud deployment growing?
Cloud holds 57.12% share today and is expanding at an 11.32% CAGR, the fastest among deployment models.
Which application area is expected to grow quickest?
Sales and marketing personalization is projected to rise at a 13.64% CAGR as retailers embed millisecond recommendation engines.
Why is Asia-Pacific the fastest-growing region?
5G standalone cores and OTT video platforms generate terabytes of telemetry that require real-time analytics, driving a 13.60% regional CAGR.
Page last updated on:


