Market Overview
| Study Period | 2020 - 2031 |
|---|---|
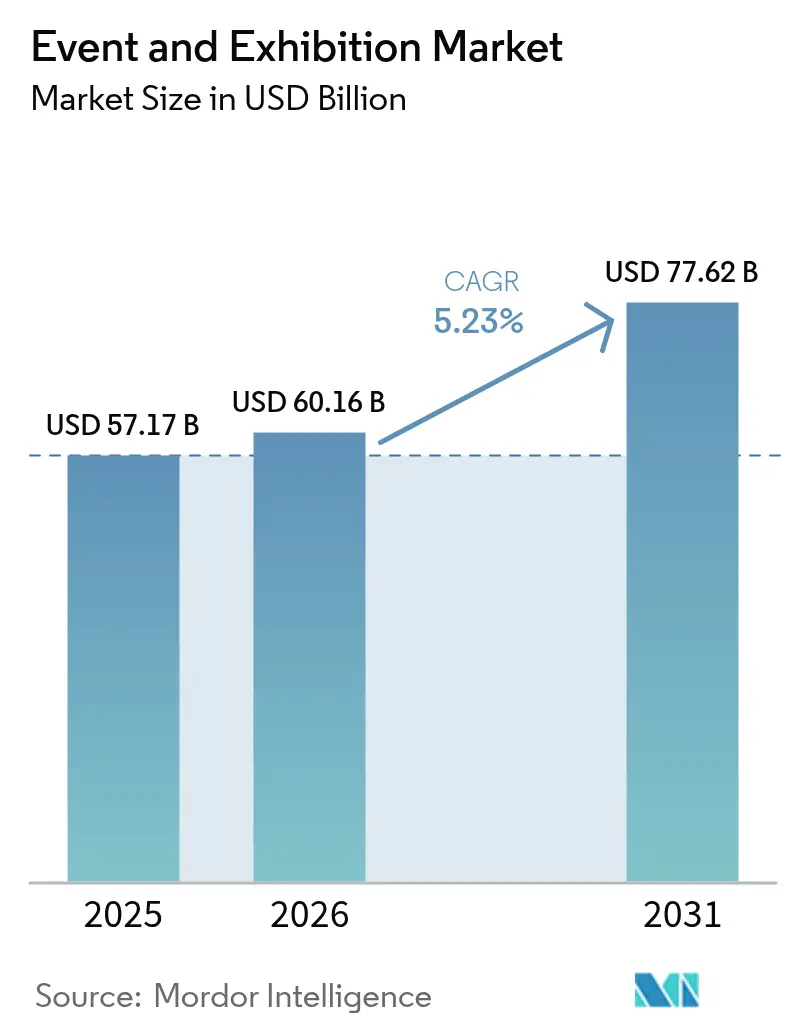
| Market Size (2026) | USD 60.16 Billion |
| Market Size (2031) | USD 77.62 Billion |
| Growth Rate (2026 - 2031) | 5.23% CAGR |
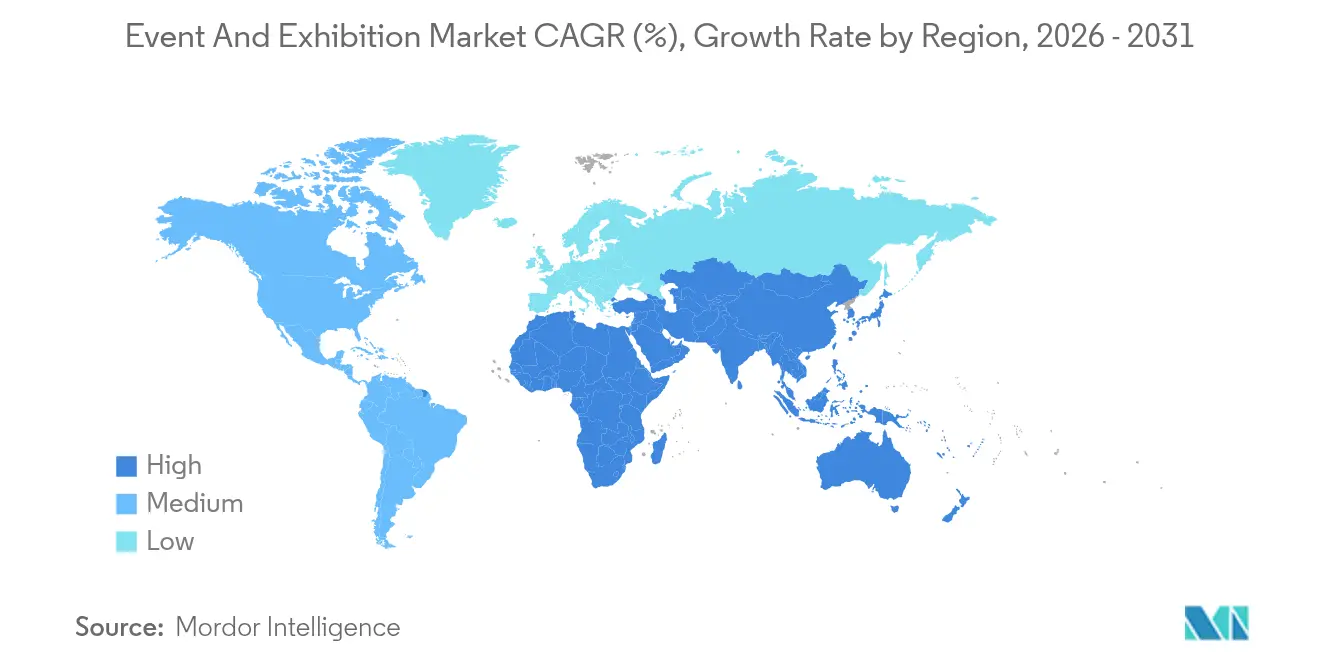
| Fastest Growing Market | Asia Pacific |
| Largest Market | Europe |
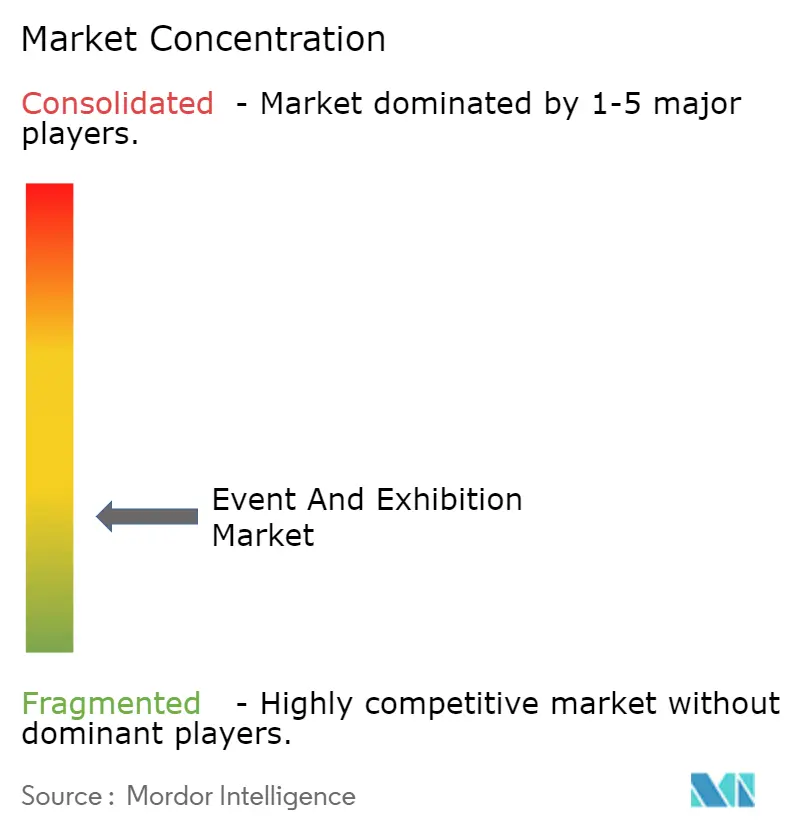
| Market Concentration | Low |
Major Players *Disclaimer: Major Players sorted in no particular order Image © Mordor Intelligence. Reuse requires attribution under CC BY 4.0. | |
Event And Exhibition Market Analysis by Mordor Intelligence
The Event And Exhibition Market size was valued at USD 57.17 billion in 2025 and estimated to grow from USD 60.16 billion in 2026 to reach USD 77.62 billion by 2031, at a CAGR of 5.23% during the forecast period (2026-2031).
Corporate budgets, hybrid-format adoption, and sustainability mandates jointly sustain demand while reshaping business-event design. Live attendance rebounded in 2024 and early-2025, supported by rising travel spend and venue investments. Technology platforms, especially those embedding AI, now underpin nearly every stage of event planning. Infrastructural build-outs in the Gulf and ASEAN nations increase venue supply, pressuring established Western destinations to innovate. Consolidation among organizers and venue operators accelerates, signaling a shift toward scale-driven efficiencies and tighter supplier ecosystems.
Key Report Takeaways
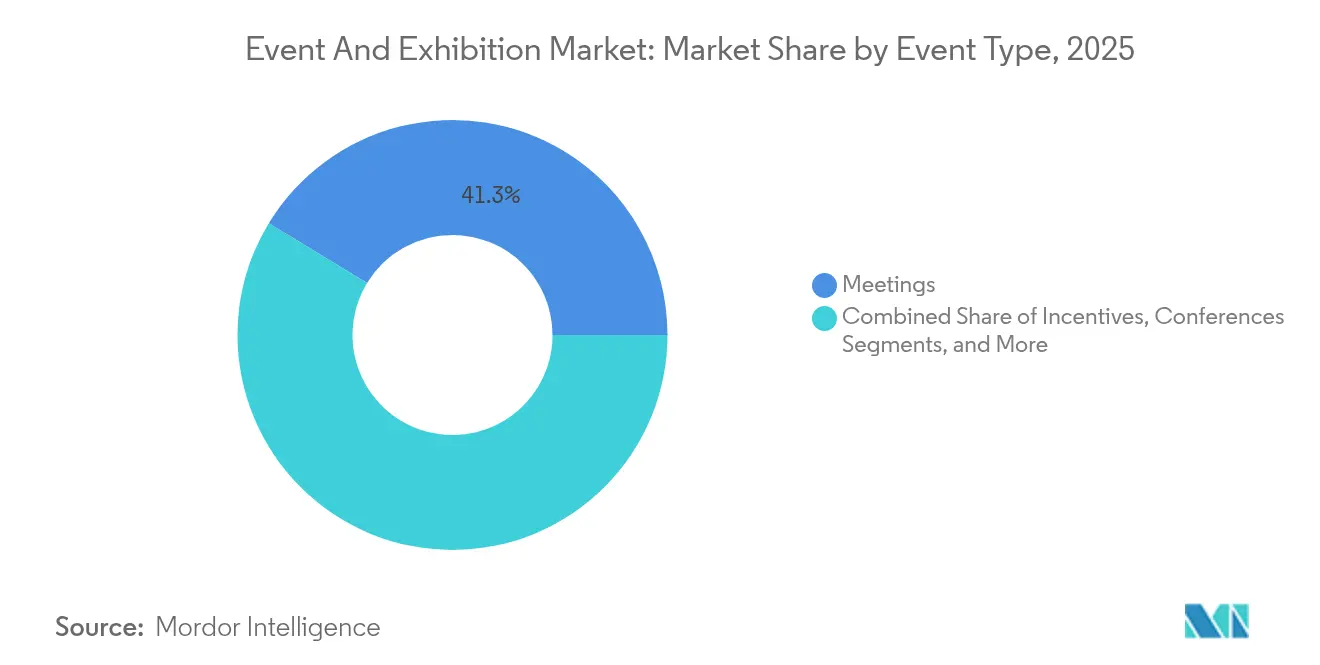
- By event type, Meetings led with a 41.30% MICE market share in 2025; Hybrid/Virtual Events are advancing at a 6.55% CAGR through 2031.
- By service type, Event Planning and Management accounted for 25.55% of the MICE market size in 2025, while Audio-Visual and Technology Services are forecast to grow at 6.78% CAGR to 2031.
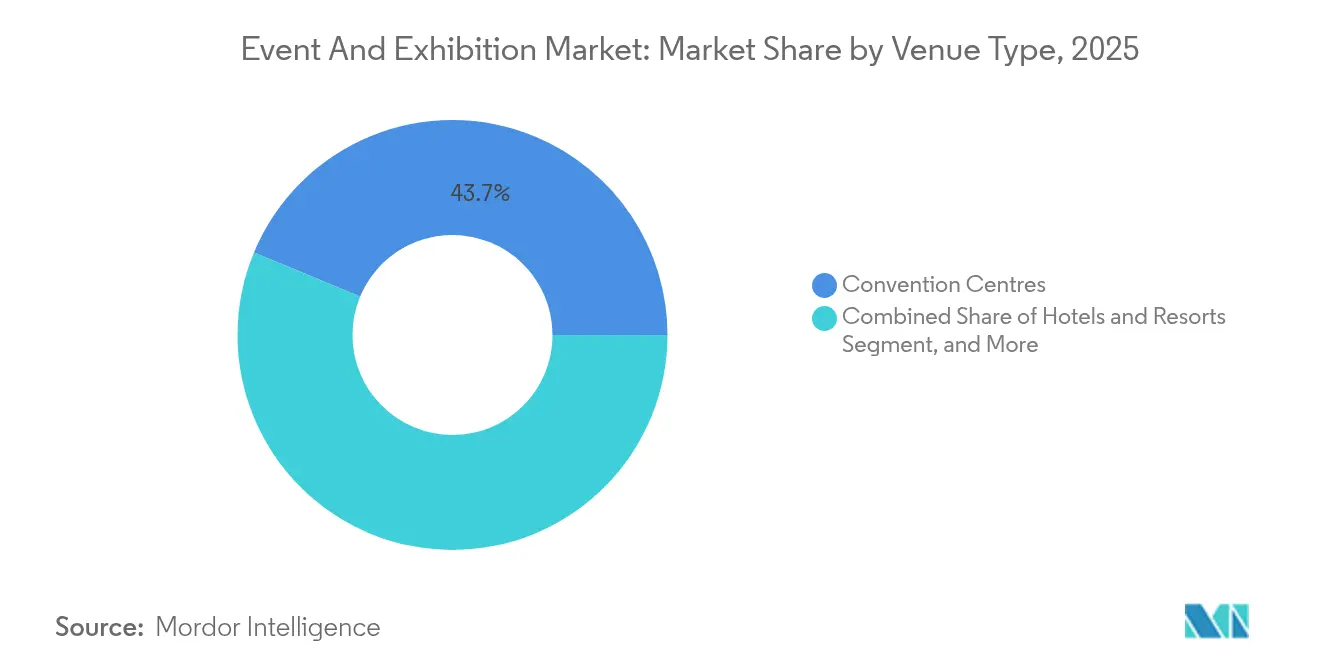
- By venue type, Convention Centers held 43.73% of the MICE market size in 2025; Outdoor/Unconventional Venues are projected to expand at a 6.95% CAGR to 2031.
- By industry vertical, IT and Telecom captured 17.44% of MICE market share in 2025 and is projected to post a 6.22% CAGR to 2031.
- By Geography, North America held 37.60% of global revenue in 2025, whereas the Middle East and Africa region is expected to record a 6.42% CAGR through 2031.
Note: Market size and forecast figures in this report are generated using Mordor Intelligence’s proprietary estimation framework, updated with the latest available data and insights as of 2026.
Global Event And Exhibition Market Trends and Insights
Drivers Impact Analysis*
| Driver | (~) % Impact on CAGR Forecast | Geographic Relevance | Impact Timeline |
|---|---|---|---|
| Rapid rebound of in-person business travel budgets | +1.2% | North America and Europe | Short term (≤ 2 years) |
| Corporate sustainability mandates toward carbon-neutral events | +0.8% | Europe and North America | Medium term (2-4 years) |
| Technology-enabled hybrid formats expanding attendee reach | +1.1% | Global | Short term (≤ 2 years) |
| Destination marketing incentives in emerging economies | +0.7% | Middle East and Africa, ASEAN | Medium term (2-4 years) |
| Experiential design demand from Gen-Z/Millennial workforces | +0.6% | Global urban centers | Long term (≥ 4 years) |
| Large-scale infrastructure build-outs in Gulf and ASEAN markets | +0.9% | Middle East and Africa, Asia Pacific | Long term (≥ 4 years) |
| Source: Mordor Intelligence | |||


Rapid Rebound of In-Person Business Travel Budgets
Corporate travel outlays rose sharply during 2024, and 42% of companies budgeted higher spending for 2025 compared with 2024. Conference attendance intentions also improved; 60% of business travelers planned at least one trade-show visit in 2024, reflecting renewed emphasis on face-to-face networking. Longer booking lead times-averaging 53 days for international trips-show planners locking in rates early to manage cost uncertainty. The revived spend broadened demand beyond primary hubs, lifting secondary cities where venue costs remain lower. Resulting volume uplift has already flowed into premium meeting spaces, AV services, and specialized logistics suppliers.
Technology-Enabled Hybrid Formats Expanding Attendee Reach
Organizers have shifted from emergency virtual solutions to implementing mature hybrid strategies. Virtual platforms are increasingly being adopted, driven by advancements in AI-powered matchmaking and content personalization, which significantly enhance attendee satisfaction. Features like real-time translation and AR/VR integrations are breaking down geographic and linguistic barriers, enabling broader audience engagement without substantial cost increases. Sponsors are showing greater interest in premium virtual booths due to their ability to generate valuable, data-driven leads. Hybrid event structures are proving effective in generating additional revenue while aligning with ESG goals and addressing travel budget constraints.
Corporate Sustainability Mandates Shifting Toward Carbon-Neutral Events
ESG compliance evolved from voluntary marketing to formal board-level metric between 2024 and mid-2025. The European Corporate Sustainability Reporting Directive requires Scope 3 emission disclosure, compelling companies to quantify event footprints. ISO 20121 adoption accelerated as planners sought proven frameworks for waste, energy, and community impact management. Venues with on-site renewable energy and zero-waste certifications gained preference, and carbon-offset packages became standard feature sets.[1]MeetGreen, “Carbon Offsets In Event Planning,” meetgreen.com This shift differentiates suppliers that can furnish audit-ready data, turning sustainability into a competitive filter rather than a peripheral add-on.
Large-Scale Infrastructure Build-Outs in Gulf and ASEAN Markets
Dubai committed USD 2.7 billion to enlarge Expo City’s exhibition complex, scheduled for phased completion by 2031.[2]Northstar Meetings Group, “Dubai Exhibition Centre Expo City Expansion,” northstarmeetingsgroup.com Marina Bay Sands’ expansion, entering final design in 2024, will add a 15,000-seat arena and high-end events and exhibition or Meetings, Incentives, Conferences and Exhibitions (MICE) facilities by July 2029. Parallel projects in Beijing and Riyadh multiply available gross floor area, reducing per-square-foot rental costs and inviting global organizers to rotate events away from congested Western centers. Government incentives, such as visa-on-arrival schemes and tax holidays, layer additional attraction for corporate planners.
Restraints Impact Analysis*
| Restraint | (~) % Impact on CAGR Forecast | Geographic Relevance | Impact Timeline |
|---|---|---|---|
| Volatile air-travel and accommodation pricing | -0.9% | Global long-haul corridors | Short term (≤ 2 years) |
| Geopolitical uncertainty and visa restrictions | -0.7% | Europe-Asia routes, United States-China flows | Medium term (2-4 years) |
| Data-privacy and cybersecurity compliance costs | -0.4% | Europe, North America, global roll-out | Medium term (2-4 years) |
| Rising ESG scrutiny on carbon footprints | -0.3% | Europe, North America, Asia Pacific | Long term (≥ 4 years) |
| Source: Mordor Intelligence | |||
Volatile Air-Travel and Accommodation Pricing
Hotel room rates increased 4.5% per attendee for 2025, while trans-Atlantic business-class airfares rose 4% over 2024 levels.[3]Prevue Meetings, “Per-Attendee Costs to Rise 4.5% in 2025,” prevuemeetings.com Regional disparities complicate planning: Indian metros posted 8.5-9% room-rate growth, whereas some Nordic cities rose 5.6%. Mega-events like Expo Osaka inflate local inventory costs by double-digit percentages, forcing planners to book earlier or compress program durations. These swings prompt higher contingency budgets and encourage hybrid participation models to offset travel spending unpredictability.
Geopolitical Uncertainty and Visa Restrictions
The 2025 launch of Europe’s ETIAS authorization adds time and compliance steps for 30 million annual visa-exempt travelers. Strained United States-China relations sustain trade-policy volatility, discouraging large delegations and complicating sponsorship flows. Rising nationalist rhetoric in several markets heightens last-minute visa rejections, eroding confidence in international attendance. Organizers respond by routing events to politically neutral destinations, or layering virtual tracks to secure participation continuity.
*Our forecasts treat driver/restraint impacts as directional, not additive. The impact forecasts reflect baseline growth, mix effects, and variable interactions.
Segment Analysis
By Event Type: Meetings Dominance Challenged by Hybrid Innovation
Meetings delivered 41.30% of 2025 revenue within the MICE market, affirming their central role in decision-making and relationship building. This segment’s stability supports baseline venue occupancy and predictable service demand. Hybrid/Virtual Events, however, are forecast at a 6.55% CAGR through 2031, the fastest among formats. The incremental reach offered by hybrid structures attracts sponsors seeking global impressions without proportional travel costs. Organizers incorporate AI-assisted matchmaking and digital exhibit halls, blending physical engagement with robust data capture. Conferences continue to appeal for content-focused gatherings, while Incentives regain traction as employers emphasize retention. Exhibitions, once volume drivers for large venues, now integrate immersive tech and data-rich lead-gen to remain relevant. The MICE market size for meetings is poised to grow steadily even as hybrid models broaden the ecosystem.
Corporate buyers deploy outcome-based metrics that weigh engagement depth, sustainability performance, and ROI. Hybrid platforms mitigate carbon footprints and budget variability, positioning them as essential complements rather than substitutes. Suppliers that master synchronous physical and digital delivery stand to capture a larger probability-weighted share of upcoming program spend.


By Service Type: Technology Services Accelerate Amid Planning Consolidation
Event Planning and Management providers held 25.55% of 2025 MICE market size, reflecting planners’ need for integrated expertise across venue logistics, compliance, and attendee engagement. Audio-Visual and Technology Services exhibit a 6.78% CAGR outlook to 2031, fueled by demand for high-fidelity streaming, XR experiences, and on-site bandwidth. Venue Rental remains indispensable but faces margin compression as new capacity comes online in emerging regions. Transportation and Logistics suppliers navigate rate volatility, requiring dynamic pricing tools.
Accommodation partners reposition through loyalty integrations and extended-stay packages that dovetail with “bleisure” trends. Food and Catering operators shift menus toward locally sourced and plant-forward offerings to satisfy ESG metrics. Technology overlays, including AI venue-sourcing and predictive analytics, now differentiate full-service agencies. Consequently, service portfolios evolve from siloed line items toward bundled, data-driven platforms optimized for end-to-end event life cycles.
By Venue Type: Convention Centers Lead While Unconventional Spaces Surge
Convention Centers accounted for 43.73% of 2025 MICE market size, reflecting their scale economies and embedded service ecosystems. However, Outdoor/Unconventional Venues are projected to rise 6.95% CAGR through 2031, mirroring corporate appetite for experiential, social-media-friendly settings. Hotels and Resorts leverage embedded lodging to secure multi-day programs, while Corporate Owned Facilities gain renewed investment as cost-control instruments. The MICE market share enjoyed by convention centers could dilute over time as younger audiences favor authenticity and unique aesthetics. Venues therefore upgrade 5G connectivity, modular designs, and backstage infrastructure to compete on flexibility. Environmental credentials have become a key selection filter; rooftops, repurposed warehouses, and nature-integrated properties stand out when they demonstrate renewable energy sourcing and smart-waste systems.
Technological readiness is no longer optional. Organizers demand symmetrical 1 Gbps connectivity and native integration with virtual-event software. Properties that cannot deliver tech parity cede demand to adaptable spaces. Consequently, capital expenditure priorities in 2025 focus on fiber backbones, interactive LED installations, and AI-driven crowd-flow analytics.
By Industry Vertical: IT and Telecom’s Dual Leadership Drives Innovation
IT and Telecom secured 17.44% MICE market share in 2025 and is on a 6.22% CAGR track through 2031. Continuous product-cycle launches, developer conferences, and partner ecosystems underpin volume. Healthcare and Pharmaceuticals follow closely, buoyed by continuing-education mandates and R&D showcases. BFSI sponsors programs around fintech and regulatory compliance, though macro-economic uncertainty tempers short-term growth. Automotive and Manufacturing shift content toward electrification and supply-chain resilience. Government and Public Sector gatherings, including the COP 30 Summit, prioritize climate-action deliberations. Cross-industry events emerge around sustainability and digital transformation, highlighting convergence themes. The MICE market size linked to IT and Telecom is primed for further expansion as 5G, AI, and cybersecurity remain headline drivers of enterprise agendas.
Technology firms also act as early adopters of carbon accounting and hybrid architecture. Their requirements cascade through supplier contracts, accelerating the broader market’s adoption of emission-tracking tools and immersive tech layers. Providers that deliver verifiable green practices and robust digital infrastructure stand out when courting tech-sector budgets.
Geography Analysis
North America commanded 37.60% of global MICE market revenue in 2025, supported by mature infrastructure, headquarters concentration, and advanced hybrid adoption. U.S. business-travel spending reached USD 265.5 billion in 2024, or 87% of 2019 volume. Canada’s hotel-construction pipeline expanded 54% year-over-year in 2024, enlarging event capacity. Mexico leveraged proximity and competitive cost structures to draw corporate meetings aimed at Latin-American audiences. Though growth rates are modest, the region retains scale and innovation leadership, offering high-bandwidth venues and seasoned service ecosystems.
Europe remained a pivotal destination derived from historical convention assets and rigorous regulatory frameworks. Sustainability criteria influenced 50% of 2024 planner venue decisions, and Germany topped European meeting-destination rankings. The pending ETIAS requirement adds complexity for non-EU attendees yet promises more secure movement flows. “Bleisure” behavior accelerated, with 60% of visitors extending trips for leisure. The MICE market will likely see stabilized demand across Tier 1 cities, with incremental programs shifting toward carbon-efficient secondary hubs.
The Middle East and Africa region showcased the fastest CAGR outlook at 6.42% to 2031. Dubai’s USD 2.7 billion Expo City expansion and Saudi Arabia’s Vision 2030 venue pipeline expand supply and stimulate competitive pricing. Regional hotel pipelines counted 607 projects and 147,088 rooms as of mid-2025. Incentives and meetings dominated 2024 program mix, yet Retail and Online-Retailer segments posted 145% growth, revealing diversification. Government-backed visa facilitation and destination-marketing funds further propel inbound program volume.
Asia-Pacific’s ASEAN bloc demonstrated robust FDI inflows of USD 230 billion in 2024, reinforcing demand for cross-border corporate events. Marina Bay Sands’ arena expansion promises new large-format capacity by 2029, reaffirming Singapore’s status as a regional hub. China continued to build mega-centers such as Beijing’s International Exhibition Centre Phase 2, yet geopolitical headwinds tempered outbound delegate flows. Overall, the region’s long-term trajectory remains positive, driven by demographic growth and supply-chain diversification.

Competitive Landscape
Competitive Landscape
The event and exhibition or the MICE market displayed moderate fragmentation in 2024, yet consolidation advanced briskly. Legends finalized its acquisition of ASM Global in August 2024, creating a venue-management portfolio exceeding 350 venues across five continents. Informa purchased Ascential for USD 1.5 billion, assimilating marquee events such as Money 20/20 and Cannes Lions. Technology providers pursued capability adjacency: Cvent added Prismm’s spatial-design software in April 2025 and QuickMobile’s mobile-app suite in July 2025. Private-equity interest rose, evidenced by Clarion Capital Partners’ August 2025 takeover of Marketplace Events, North America’s largest B2C show organizer.
Competition now tilts toward platform depth and global footprint. Suppliers wielding integrated venue networks, AI planning tools, and audited sustainability credentials secure preferred-partner status among corporate buyers. Regional firms leverage local language fluency, regulatory familiarity, and governmental ties to protect share in emerging markets. White-space opportunities persist in carbon-consulting services and turnkey hybrid-production studios. The interplay between consolidation and tech adoption is likely to reshape bargaining power, nudging the MICE market toward an ecosystem where fewer, larger entities orchestrate increasingly complex event portfolios.
Event And Exhibition Industry Leaders
Informa PLC
ASM Global Holdings Inc.
Messe Frankfurt GmbH
GL Events SA
Reed Exhibitions (RX Global)
- *Disclaimer: Major Players sorted in no particular order

Recent Industry Developments
- August 2025: Clarion Capital Partners acquired Marketplace Events, expanding its portfolio to 120 consumer shows.
- July 2025: Cvent acquired QuickMobile, lifting cumulative mobile-app downloads to 16.7 million.
- June 2025: Cvent signed a multi-year technology-services agreement with AIM Group International.
- April 2025: Cvent purchased spatial-design firm Prismm to streamline 3D event-layout workflows.


Global Event And Exhibition Market Report Scope
- Events and exhibitions serve as potent marketing instruments. They offer an opportunity to showcase and advertise a product or service to an audience that may possess limited or no awareness of the offerings. The events and exhibition market is segmented by type, revenue stream, end user, and geography. By type, the market is divided into B2B, B2C, and mixed/hybrid. By revenue stream, the market is segmented into exhibitor fees, sponsorship fees, entrance fees, and services. By end user, the market is divided into the consumer goods and retail sector, automotive and transportation sector, industrial, entertainment, real estate and property, hospitality sector, and other end-users like healthcare and pharmaceutical. By geography, the market is divided into North America [United States, Canada], Europe [Germany, United Kingdom, France, and Rest of Europe], and Asia-Pacific [China, Japan, India, South Korea, and Rest of Asia-Pacific], Latin America, and Middle East and Africa). For each segment, the market sizing and forecasts were made on the basis of value (in USD).
By Event Type
| Meetings |
| Incentives |
| Conferences |
| Exhibitions |
| Hybrid/Virtual Events |
By Service Type
| Event Planning and Management |
| Venue Rental |
| Transportation and Logistics |
| Accommodation |
| Food and Catering |
| Audio-Visual and Technology Services |
| Other Service Types |
By Venue Type
| Convention Centers |
| Hotels and Resorts |
| Outdoor / Unconventional Venues |
| Corporate Owned Facilities |
By Industry Vertical
| IT and Telecom |
| Healthcare and Pharmaceuticals |
| Banking, Financial Services and Insurance (BFSI) |
| Automotive and Manufacturing |
| Hospitality and Tourism |
| Government and Public Sector |
| Other Industry Verticals |
By Geography
| North America | United States | |
| Canada | ||
| Mexico | ||
| South America | Brazil | |
| Argentina | ||
| Rest of South America | ||
| Europe | Germany | |
| United Kingdom | ||
| France | ||
| Italy | ||
| Spain | ||
| Russia | ||
| Rest of Europe | ||
| Asia Pacific | China | |
| Japan | ||
| India | ||
| South Korea | ||
| Australia | ||
| Rest of Asia Pacific | ||
| Middle East and Africa | Middle East | United Arab Emirates |
| Saudi Arabia | ||
| Turkey | ||
| Rest of Middle East | ||
| Africa | South Africa | |
| Nigeria | ||
| Kenya | ||
| Rest of Africa | ||
| By Event Type | Meetings | ||
| Incentives | |||
| Conferences | |||
| Exhibitions | |||
| Hybrid/Virtual Events | |||
| By Service Type | Event Planning and Management | ||
| Venue Rental | |||
| Transportation and Logistics | |||
| Accommodation | |||
| Food and Catering | |||
| Audio-Visual and Technology Services | |||
| Other Service Types | |||
| By Venue Type | Convention Centers | ||
| Hotels and Resorts | |||
| Outdoor / Unconventional Venues | |||
| Corporate Owned Facilities | |||
| By Industry Vertical | IT and Telecom | ||
| Healthcare and Pharmaceuticals | |||
| Banking, Financial Services and Insurance (BFSI) | |||
| Automotive and Manufacturing | |||
| Hospitality and Tourism | |||
| Government and Public Sector | |||
| Other Industry Verticals | |||
| By Geography | North America | United States | |
| Canada | |||
| Mexico | |||
| South America | Brazil | ||
| Argentina | |||
| Rest of South America | |||
| Europe | Germany | ||
| United Kingdom | |||
| France | |||
| Italy | |||
| Spain | |||
| Russia | |||
| Rest of Europe | |||
| Asia Pacific | China | ||
| Japan | |||
| India | |||
| South Korea | |||
| Australia | |||
| Rest of Asia Pacific | |||
| Middle East and Africa | Middle East | United Arab Emirates | |
| Saudi Arabia | |||
| Turkey | |||
| Rest of Middle East | |||
| Africa | South Africa | ||
| Nigeria | |||
| Kenya | |||
| Rest of Africa | |||


Key Questions Answered in the Report
How large is the event and exhibition market in 2026?
The sector equals USD 60.16 billion in 2026 and is forecast to reach USD 77.62 billion by 2031.
Which region is growing fastest for business events?
The Middle East and Africa is projected to post a 6.42% CAGR through 2031, buoyed by heavy venue investment and destination marketing incentives.
Which event format is expanding quickest?
Hybrid/Virtual Events are set for a 6.55% CAGR, reflecting sustained demand for technology-enabled global reach.
What service category is seeing the highest growth?
Audio-Visual and Technology Services lead at a 6.78% CAGR as immersive and AI-driven experiences become standard.
Which industry vertical spends the most on events?
IT and Telecom holds the largest and fastest-growing share, accounting for 17.44% of 2025 revenue and a 6.22% CAGR outlook.
What key risk should planners watch in 2026?
Persistently volatile air-travel and lodging prices remain the most immediate budgeting challenge, with a projected negative 0.9% drag on global CAGR.
Page last updated on:


