
China EV Charging Infrastructure Market Size and Share
Market Overview
| Study Period | 2020 - 2031 |
|---|---|
| Forecast Data Period | 2026 - 2031 |
| Base Year Market Size (2025) | USD 25.60 Billion |
| Market Size (2026) | USD 37.61 Billion |
| Market Size (2031) | USD 257.10 Billion |
| Growth Rate (2026 - 2031) | 46.90 % |
| Market Concentration | High |
Major Players
*Disclaimer: Major Players sorted in no particular order Image © Mordor Intelligence. Reuse requires attribution under CC BY 4.0. |
|
China EV Charging Infrastructure Market Analysis by Mordor Intelligence
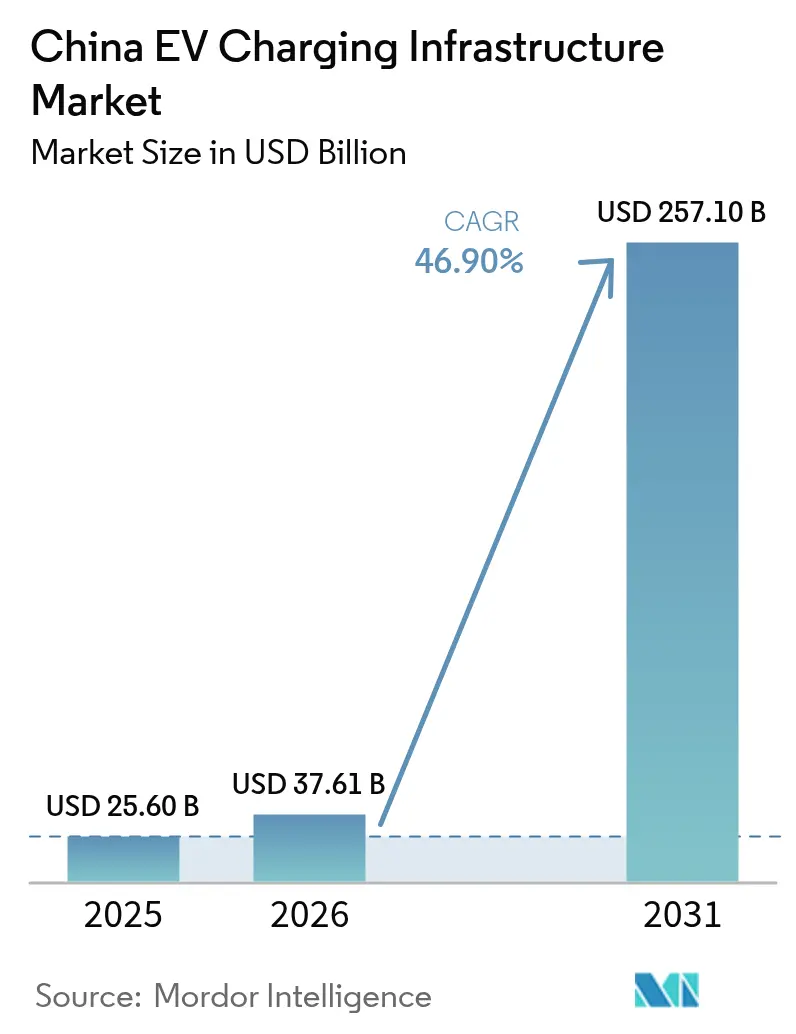
The China's EV Charging Infrastructure Market size market is expected to grow from USD 25.60 billion in 2025 to USD 37.61 billion in 2026 and is forecast to reach USD 257.1 billion by 2031 at 46.9% CAGR over 2026-2031. This exceptional growth trajectory builds upon the historical CAGR of 49.50% observed between 2020-2024, reflecting the market's transition from rapid expansion to quality-focused optimization. By end-November 2025, China’s EV charging piles exceeded 19.32 million units, including 4.63 million public charging facilities and over 14.7 million private installations.[1]"Strengthen the construction of service support capabilities for the charging network and accelerate the development of a new type of power system," National Development and Reform Commission, ndrc.gov.cn.
Key Report Takeaways
- By charging station type, AC units led with 57.21% of China EV charging infrastructure market share in 2025; DC fast chargers above 150 kW are projected to grow at 26.41% CAGR through 2031.
- By power output, Level 2 (7.1 to 22 kW) held 43.67% of the China EV charging infrastructure market size in 2025, whereas the more than 350 kW segment is on track for 37.21% CAGR to 2031.
- By installation site, public urban locations accounted for 47.42% revenue in 2025; fleet depot hubs will expand at 31.54% CAGR.
- By user application, public infrastructure dominated with a 71.93% share of the China EV charging infrastructure market size in 2025, while fleet/commercial operations will rise at a 24.09% CAGR.
- By connector standard, GB/T DC accounted for 66.25% revenue in 2025; CCS2 will expand at 34.03% CAGR.
- By vehicle type, passenger vehicles accounted for 80.74% revenue in 2025; heavy-duty truck and bus will expand at 33.74% CAGR
- By geography, East China commanded 31.12% of the China EV charging infrastructure market share in 2025; Southwest China is the fastest-growing region at 18.63% CAGR to 2031.
Note: Market size and forecast figures in this report are generated using Mordor Intelligence’s proprietary estimation framework, updated with the latest available data and insights as of 2026.
China EV Charging Infrastructure Market Trends and Insights
Drivers Impact Analysis*
| Driver | (~) % Impact on CAGR Forecast | Geographic Relevance | Impact Timeline |
|---|---|---|---|
| Aggressive NEV Mandate Accelerating Charger Demand | +7.2% | National, with strongest impact in Tier-1 and Tier-2 cities | Medium term (2–4 years) |
| Central Stimulus for Ultra-Fast Charging Hubs | +6.5% | National, concentrated in East China and South-Central regions | Short term (≤ 2 years) |
| EV-Fleet Boom Driving Depot Fast-Charging | +5.8% | Urban centers, particularly Beijing, Shanghai, Shenzhen | Medium term (2–4 years) |
| Battery-Swap EVs Enabling Hybrid Stations | +5.4% | National, with concentration in East China | Medium term (2–4 years) |
| Grid-Edge V2G Pilots Promoting Smart Chargers | +5.3% | Pilot cities including Beijing, Shanghai, Guangzhou | Long term (≥ 4 years) |
| Green Corridors Prioritizing Highway Fast Chargers | +4.9% | Intercity expressways across Yangtze River Delta and Greater Bay Area | Medium term (2–4 years) |
| Source: Mordor Intelligence | |||
Aggressive NEV Dual-Credit Mandate Accelerating Charger Demand
China's NEV dual-credit policy, which combines fuel consumption credits with NEV production quotas, has become a powerful driver for charging infrastructure expansion. The policy requires automakers to achieve specific NEV production targets or purchase credits from other manufacturers, creating a structural incentive for EV adoption. As of 2024, the policy mandates that NEVs represent at least 28% of an automaker's production, with this percentage set to increase to 40% by 2030 HEV TCP. This regulatory framework has catalyzed demand for charging infrastructure, particularly in urban centers where EV adoption is highest. The mandate's impact extends beyond passenger vehicles to commercial fleets, with requirements for public transportation and logistics companies to achieve electrification targets. This comprehensive approach has created a robust ecosystem for charging infrastructure development, with the government aiming to establish a vehicle-to-charging station ratio of 2:1 by 2025 and 1:1 by 2030.[2] "ANNUAL REPORT 2024 - The Electric Drive Powers On," HEV TCP, evtcp.org.
Central "New Infrastructure" Stimulus and Subsidies for Ultra-Fast Hubs
The Chinese government's designation of EV charging infrastructure as part of the "New Infrastructure" initiative has unlocked significant funding and policy support. This strategic categorization, alongside 5G networks and data centers, has elevated charging infrastructure to a national priority, attracting both public and private investments. In 2024, China added 4.222 million EV charging points, a 25% increase from 2023, with 830,000 public and 3.368 million private point. The focus has shifted toward ultra-fast charging hubs, with subsidies specifically targeting high-power installations above 150 kW. These hubs are strategically positioned along highways and in urban centers to address range anxiety and improve charging convenience. The government's financial support includes direct subsidies, tax incentives, and preferential land allocation, creating a favorable environment for infrastructure expansion. This approach has been particularly effective in accelerating the deployment of charging infrastructure in less developed regions, helping to address the urban-rural disparity in charging access.
Ride-Hailing and Logistics EV-Fleet Boom Requiring Depot Fast-Charging
Electrification of ride-hailing fleets and last-mile logistics intensifies demand for depot-based fast charging that can minimize vehicle downtime. DiDi and other operators are adding dedicated charging yards, and Shenzhen’s near-fully electric taxi fleet validates the business case for high-utilization chargers paired with preferential electricity tariffs. Municipal subsidies for fleet depots, together with simplified permitting, are directing the China EV charging infrastructure market toward purpose-built commercial nodes rather than exclusively public curbside units.
Grid-Edge Digitalization and V2G Pilots Promoting Smart Charger Roll-outs
In April 2025, the National Development and Reform Commission (NDRC) approved 30 V2G pilots across nine cities, positioning chargers as distributed energy assets. IoT-enabled stations now optimize power flows using time-of-use tariffs and AI-driven load management. The government’s New Power System Action Plan (2024-2027) prioritizes software-defined infrastructure that can deliver peak-shaving, demand response, and ancillary-service revenues, a critical evolution for profitability in the China EV charging infrastructure market.
Restraints Impact Analysis*
| Restraint | (~) % Impact on CAGR Forecast | Geographic Relevance | Impact Timeline |
|---|---|---|---|
| Grid Constraints Delaying Urban Charger Permits | -3.2% | Tier-1 and Tier-2 cities, particularly in East China | Short term (≤ 2 years) |
| Low Charger Utilization Squeezing Operator Margins | -2.8% | National, with higher impact in less developed regions | Medium term (2–4 years) |
| Fire-Safety and Land Rules Raising CapEx | -2.5% | Urban centers, particularly in densely populated areas | Medium term (2–4 years) |
| Fragmented E-Roaming Despite National Platform | -2.3% | National, with higher impact in rural areas | Short term (≤ 2 years) |
| Source: Mordor Intelligence | |||
Urban Distribution-Grid Transformer Constraints Delaying Permits
High-power hubs in mature city cores are hitting the ceiling of local transformer capacity, extending permitting cycles and inflating grid-connection costs. Utilities are upgrading hardware, yet construction timelines lag charger demand, especially in legacy downtown grids. Operators are countering with on-site battery storage to shave peaks, but such hybrid systems raise capital intensity and challenge near-term returns, temporarily tempering expansion of the China EV charging infrastructure market.
Low Public-Charger Utilization Squeezing Operator Margins
Average utilization at many public sites remains below 10%, far from the 30% threshold viewed as break-even. Off-peak demand gaps weigh on cash flow, particularly in less-traveled corridors. Operators respond through dynamic pricing, retail partnerships, and data-driven scheduling to lift throughput. Until balanced load profiles match network densification, under-utilization will continue to cap near-term margin improvement across the China EV charging infrastructure market.
*Our forecasts treat driver/restraint impacts as directional, not additive. The impact forecasts reflect baseline growth, mix effects, and variable interactions.
Segment Analysis
By Charging Station Type: DC Fast Charging Accelerates Beyond AC Dominance
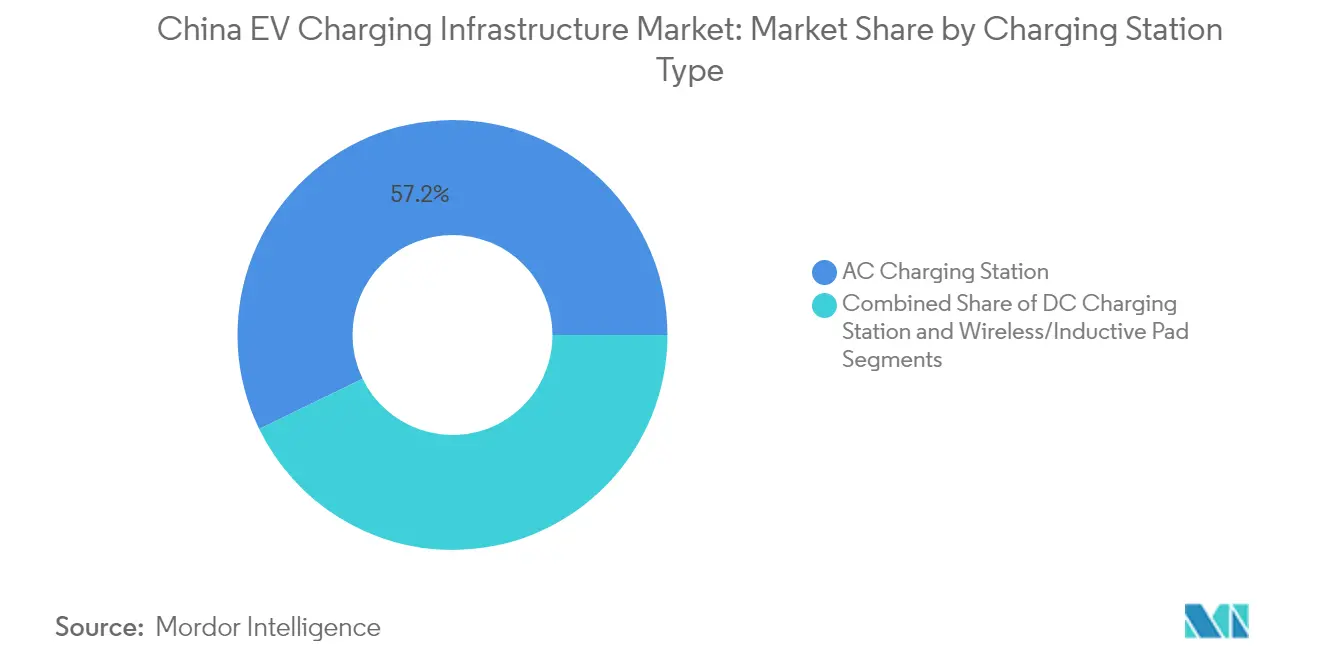
AC chargers retained a 57.21% share of the China EV charging infrastructure market in 2025, reflecting cost-efficient deployment in residential and workplace garages. However, high-power DC stations above 150 kW posted a 26.41% CAGR and now anchor state-backed highway corridors and urban hubs. Government subsidies for ultra-fast terminals and BYD’s introduction of 1,000 kW systems underscore the momentum toward refueling-like charge times. Wireless curbside pads remain niche yet are viable for taxi queues and bus layovers where zero-touch convenience offsets capex. Competitive intensity is rising as automakers integrate proprietary DC networks, challenging utilities and independent operators to upgrade existing AC footprints.
DC momentum is also reshaping revenue mixes. Higher tariffs and value-added services, such as vehicle preconditioning, battery health checks, and onsite retail, enable operators to lift yield per session. Grid-interactive inverters in next-generation DC gear support V2G pilots, creating ancillary income and boosting project bankability. As demand consolidates around high-power formats, AC installations will shift toward slow-charge settings, while DC stations define the public face of the China EV charging infrastructure market.



By Power Output: Megawatt Platforms Enter Heavy-Duty Transport
Level 2 units (7.1 to 22 kW) represented 43.67% of the China EV charging infrastructure market size in 2025, providing overnight home charging and workplace top-ups. Growth pivots to the more than 350 kW class, expanding at 37.21% CAGR as electric trucks and intercity coaches require swift turnaround. Thermal-management breakthroughs allow liquid-cooled cables and power electronics to safely deliver megawatt levels, while buffer batteries offset grid peaks. The 151-350 kW tier is scaling inside urban fast-charge plazas, balancing cost and speed for passenger EVs.
Megawatt charging co-locates with solar canopies and onsite storage, turning logistics depots into integrated energy hubs. State Grid’s expressway sites have tested 700 kW connectors for long-haul freight, confirming grid-side feasibility. Heavy-duty transport could redefine capacity planning as standards mature and create another capex cycle, cementing high-output formats as a core growth axis for the China EV charging infrastructure market.
By Installation Site: Depot Hubs Propel Commercial Electrification
Public urban parking lots held 47.42% revenue in 2025, offering visibility and diversified foot traffic. Yet fleet depots are the breakout story, advancing at 31.54% CAGR on the strength of ride-hailing, taxi, and last-mile delivery fleets. Stakeholders such as city transit agencies and parcel firms co-finance dedicated yards that guarantee overnight charging windows and predictable energy costs. Workplace lots add incremental volume as corporations incorporate chargers into ESG programs.
Corridor stations along national highways receive direct fiscal support, enabling blanket coverage that eases range anxiety for long-distance motorists. In contrast, high-rise residential blocks struggle with retrofits due to shared parking and power limits, slowing private installations. The shift toward depot-centric models indicates that operational uptime, not merely geography, will steer investment patterns within the China EV charging infrastructure market.
By User Application: Commercial Fleets Upend Traditional Mix
Public Infrastructure dominated 71.93% of revenue in 2025, underpinned by government ownership and utility partnerships. Commercial-fleet demand is climbing at 24.09% CAGR as logistics, municipal buses, and corporate cars migrate to electric drivetrains. Operators court fleets with managed-service contracts that package hardware, software, and energy at predictable fees, transforming capex into opex and accelerating adoption.
Private residential spots grow steadily but face hurdles in apartment complexes where individual metering and parking deed constraints complicate installs. Hybrid business models such as charging-as-a-service and power-bundled subscriptions are emerging to monetize under-utilized public assets during off-peak hours, signaling a more balanced utilization curve ahead for the China EV charging infrastructure market.
By Connector Standard: GB/T Retains Scale While CCS2 Gains Premium Ground
The GB/T DC interface claimed 66.25% market share in 2025, benefiting from mandatory national standardization that guarantees cross-network operability. Premium imports and joint-venture brands push CCS2 adoption, which is rising at 34.03% CAGR as buyers seek cross-border compatibility and higher power ceilings. Tesla’s NACS, accessed via adapters, and legacy CHAdeMO occupy niche volumes.
Regulators continue to refine GB/T specifications, lifting maximum current and enabling liquid cooling to stay competitive. Meanwhile, multiprotocol dispensers allow operators to future-proof sites without over-committing to one standard. Harmonization will be critical to avoid stranded assets and safeguard investment flows into the Chinese EV charging infrastructure market.

By Vehicle Type: Heavy-Duty Electrification Unlocks High-Value Segments
Passenger cars absorbed 80.74% of 2025 charging revenue, leveraging dense urban networks and residential plugs. Yet heavy-duty trucks and buses clocked a 33.74% CAGR and are central to carbon-neutral transport goals. Municipal bus depots in Beijing, Shanghai, and Guangzhou add megawatt chargers and pilot battery swaps to keep fleets on schedule. Light commercial vans, a staple of e-commerce delivery, bolster daytime fast-charge demand in urban cores.
Two- and three-wheelers remain numerically dominant but contribute marginally to revenue due to smaller battery packs and home charging habits. The widening mix requires flexible site layouts and modular power electronics, ensuring that the China EV charging infrastructure market can align capex with the distinct duty cycles of each vehicle class.
Geography Analysis
East China led the China EV charging infrastructure market with 31.12% revenue in 2025, buoyed by dense urban centers, robust manufacturing, and early policy adoption. Provinces such as Guangdong, Zhejiang, and Jiangsu hold more than two-thirds of public chargers, and Shanghai’s subsidy for battery-swap stations further reinforces regional leadership. South-Central China ranks second, driven by megacity programs in Shenzhen and Guangzhou where nearly the entire taxi fleet is electric, necessitating high-throughput hubs to keep vehicles in service.
Southwest China, anchored by Chongqing and Chengdu, is the fastest-growing region at 18.63% CAGR as infrastructure grants steer capital toward historically underserved areas. The tourism economy spurs charger roll-outs along scenic highways, while provincial targets incentivize operators to deploy mixed-use hubs that pair retail and fast charging. Hainan’s ambition to electrify nearly all vehicles by 2030 exemplifies frontier demand; its plan calls for 750,000 chargers to support 1.55 million EVs, underscoring the shift from pilot projects to full-scale networks in less-industrialized locales.
North China benefits from policy impetus in Beijing, yet aging urban grids complicate high-power expansions. Northeast China faces climatic challenges that shorten battery range in winter and require chargers equipped with pre-heating functionality. National agencies are addressing geographic disparities by funding rural pilot corridors and mandating uniform minimum coverage, thereby pushing the China EV charging infrastructure market toward a more balanced national footprint across the 2025-2030 horizon.
Regulatory Landscape
China's EV charging infrastructure is shaped primarily by the National Development and Reform Commission (NDRC) and the National Energy Administration (NEA) for planning, deployment, and grid integration, while the Ministry of Industry and Information Technology (MIIT) sets technical and safety requirements for EVs and charging-related interfaces. Policy emphasis during 2025-2027 centers on improving network buildout quality, including coverage, reliability, and interoperability, with central guidance supporting high-power charging corridors and coordinated charging to reduce peak-load stress in dense urban grids.
Standardization and compliance requirements have also tightened as scaling accelerates. MIIT has progressed mandatory safety and technical standards relevant to charging compatibility and vehicle safety, including GB 18384-2025 (Electric Vehicle Safety Requirements), which has been in effect as of early 2026. On the planning side, NDRC/NEA issued a three-year action plan in October 2025 covering national buildout targets, with priorities that include highway fast-charging availability, rural coverage improvement, and readiness for smart charging and V2G pilots approved by NDRC in April 2025.
Value Chain Analysis
The China EV charging infrastructure value chain runs from upstream power and electrical equipment inputs, including grid connection equipment, transformers, switchgear, charging modules, power electronics, liquid-cooled cables, and metering, through midstream charger OEMs and system integrators that deliver AC and DC equipment, energy storage add-ons, and site-level electrical works. A parallel software and services layer supports station management systems, payment and e-roaming integration, load management, and grid-interactive functions aligned with V2G and time-of-use tariff optimization.
State-owned utilities such as State Grid and China Southern Power Grid anchor corridor and public-network buildouts through grid access and permitting capability, while private CPOs like TELD, StarCharge, and YKC expand multi-city networks with O&M and platform capabilities. Automakers increasingly take on downstream roles as network builders and ecosystem orchestrators, combining proprietary fast-charging and battery swapping with partnerships to secure locations and improve utilization, as reflected in 2026 agreements linking BYD flash-charging rollout to Sinopec's site footprint and NIO Power's battery-swap expansion with Zhongan Energy. Distribution-grid capacity and urban retrofit constraints remain key bottlenecks, which pushes more projects toward buffer storage, coordinated charging, and depot-centric deployments where utilization tends to be more predictable.
Competitive Landscape
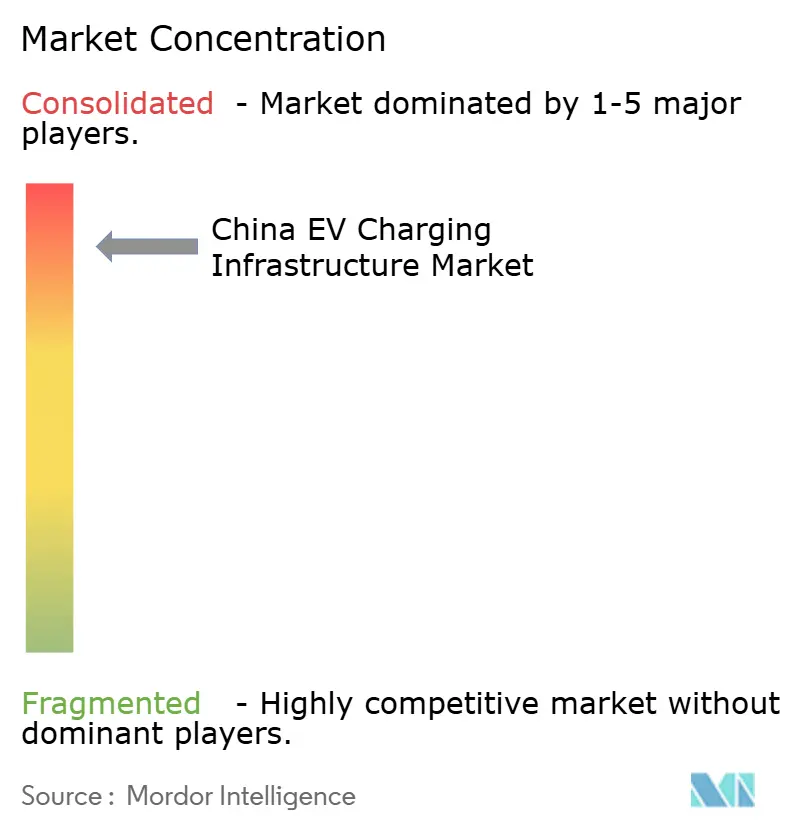
The five largest operators, State Grid EV Service, TELD, StarCharge, Potevio New Energy, and China Southern Power Grid EV Service, hold a significant share of the installed capacity, conferring moderate concentration. State Grid leverages national transmission assets to anchor corridor sites, while TELD’s alliances with over 70 automakers ensure embedded access within vehicle infotainment systems. StarCharge differentiates through cloud-based energy-management software that optimizes tariff windows and renewable integration.
Automakers are vertically integrating: NIO is scaling its battery-swap network in partnership with provincial power companies; BYD co-develops urban hubs with Shell, including a 258-dispenser flagship in Shenzhen. International oil majors form joint ventures to combine retail fuel real estate with EV charging, yet domestic incumbents still outpace them in absolute volume. Strategic competition now centers on software, data analytics, and bundled services rather than raw dispenser count, signaling a maturation cycle in the China EV charging infrastructure market.
Operators also pursue on-site generation, solar rooftops, battery buffers, and inverters that provide ancillary grid services to diversify margins beyond session fees. Mobile apps integrate routing, reservation, and loyalty features, making the user experience a key battleground. Consolidation is anticipated as underutilized assets change hands, with larger entities harnessing scale to raise average network throughput and stabilize returns.
China EV Charging Infrastructure Industry Leaders
-
TELD
-
YKC
-
State Grid Corporation of China
-
TGood
-
StarCharge (Wanbang Digital Energy Co. Ltd.)
- *Disclaimer: Major Players sorted in no particular order

Market Opportunities and Future Outlook
One key opportunity is the upgrade cycle from basic AC coverage toward high-power public charging that can deliver corridor reliability, aligned with central goals under the 2025-2027 action plan. This plan targets 28 million charging facilities and more than 300 million kW of public charging capacity by end-2027, including a goal of over 100,000 high-power charging facilities over the same timeframe. As highway service-area modernization also introduces minimum-power expectations for fast chargers, demand grows for suppliers of liquid-cooled high-power systems, modular power cabinets, and grid-connection solutions that can shorten construction timelines in constrained urban nodes.
Interoperability and system integration are also creating a separate investment lane. As regulators and standards bodies push coordinated charging and interface harmonization, new and updated standards, including GB/T 47503-2026 (effective 2026-11-01) for coordinated charging system construction and other 2026 technical specifications for connector/terminal interfaces and public-sector configuration guidance, support increased demand for compliant equipment and software that can manage multi-protocol sites and participate in load management programs. Sub-national buildout programs expand the addressable market beyond coastal hubs, with municipal plans such as Chongqing's 2026-2028 action plan for 750,000 charging facilities and 2,500 ultra-fast stations creating opportunities for regional EPCs, site hosts, and operators that can deliver grid-ready projects at scale.
Recent Industry Developments
- July 2026: StarCharge released a set of industry white papers focused on scaling charging infrastructure into networked systems and microgrid-oriented deployments. The publications reinforce the shift by leading operators from dispenser rollouts toward platform, energy-management, and system-integration capabilities that help improve utilization and grid coordination.
- June 2026: BYD and Sinopec signed a cooperation framework to deploy BYD flash-charging stations across Sinopec's service network. The tie-up expands access to prime roadside and urban locations, accelerating high-power charging rollout through an established national retail footprint.
- January 2024: CATL and DiDi announced plans to form a joint venture focused on battery swapping for ride-hailing and logistics fleets in China. The initiative supports hybrid swap-charge station models for high-utilization commercial vehicles and adds competitive pressure on public fast-charging networks to serve fleet duty cycles.


Research Methodology Framework and Report Scope
Market Definition and Coverage
This market covers the value generated in China from building, installing, and operating electric vehicle charging infrastructure, including charging stations and related equipment across home, workplace, and public locations.
Scope exclusions: We exclude electric vehicles themselves, grid generation assets, and unrelated power hardware that is not directly used for EV charging deployment and operations.
Segmentation Overview
-
By Charging Station Type
- AC Charging Station
- DC Charging Station
- Wireless/Inductive Pad
-
By Power Output
- Less Than 7 kW (Slow AC)
- 7.1 to 22 kW (Level 2)
- 23 to 50 kW (Rapid DC)
- 51 to 150 kW (Fast)
- 151 to 350 kW (Ultra-fast)
- More than 350 kW (Megawatt/Heavy-Duty)
-
By Installation Site
- Residential (Home)
- Workplace
- Public Urban (Retail and Parking)
- Highway/Inter-city Corridor
- Fleet Depot and Logistics Hub
- Bus and Truck Terminal
-
By User Application
- Private Infrastructure
- Public Infrastructure
- Fleet/Commercial
-
By Connector Standard
- GB/T AC
- GB/T DC
- CCS2 (Imports)
- CHAdeMO
- Tesla NACS (Adapter)
-
By Vehicle Type
- Passenger Vehicles
- Commercial Light-duty (LCVs)
- Heavy-duty Truck and Bus
- Electric Two- and Three-wheelers
-
By Geography (China)
- North China
- East China
- South-Central China
- Northeast China
- Southwest China
- Northwest China
- Hong Kong and Macau
Data Sources, Market Sizing, and Validation
Desk Research
Desk research was used to pin down the real demand signals behind charging rollouts and to keep assumptions tied to measurable data. We reviewed public statistics and policy documents that shape deployment timing, such as releases from the National Energy Administration, Ministry of Transport, and National Bureau of Statistics, along with standards and guidance from bodies like the Standardization Administration of China.
To ground the build-out rate, we also referenced non-paywalled sources such as the China Electricity Council, customs and trade releases for key equipment flows, and peer-reviewed papers tracking charger utilization and power demand patterns. Company filings, investor presentations, and reputable press were used to cross-check expansion announcements and pricing direction. Where needed, paid subscriptions for company financials and intelligence, patent databases, and shipment-level import export views helped validate market structure and fill gaps. This list is not exhaustive, and we also relied on other public and curated sources for data collection, validation, and clarification.
Primary Interviews and Surveys
Primary work focused on interviews and short surveys with charging network operators, equipment suppliers, EPC and installation participants, and fleet and site hosts. We covered major demand pockets across China and used the discussions to confirm utilization ranges, the typical charger mix (AC versus DC), and how pricing and subsidies translate into realized project revenues.
Distribution of primary research fieldwork respondents
| Company type | Respondent position |
|---|---|
| Top tier: 28% | CXOs: 16% |
| Mid tier: 56% | Functional/Unit leaders: 27% |
| Smaller Players: 16% | Managers: 57% |
Market-Sizing & Forecasting
Sizing starts with a top-down build where deployment and usage are reconstructed from China charging stock additions, the public versus private mix, charger power split, and average utilization, then translated into value using observed price and revenue ranges. Because the market can appear larger or smaller depending on whether you count installed hardware value, service revenue, or both, we kept the model aligned to what is actually billed and recognized within charging infrastructure activity.
The model uses practical inputs that can be checked year to year, such as annual EV parc growth, public charging points added, the DC fast charging share, typical kW ratings by site type, utilization and kWh dispensed trends, and changes in charger ASPs as domestic supply scales. When data is patchy in some provinces or for newer formats, we handle gaps by applying validated ranges from comparable provinces and then scaling by urbanization and highway traffic intensity indicators. Results are corroborated through selective bottom-up checks such as sampled charger ASP times estimated unit additions, channel discussions on installation costs, and operator-level revenue sanity checks, and then used to adjust final totals.
For forecasting, we mainly used scenario analysis supported by input-level expectations from industry experts, since policy pacing, grid constraints, and tariff structures can shift deployment quickly. Growth paths were built by varying charger mix, utilization ramp timing, and ASP decline curves, and then stress-tested against EV sales momentum and announced corridor build-out plans.
Data Validation & Update Cycle
Validation is done through several rounds of checks so outputs stay consistent with real market signals. We compare totals against independent indicators such as charging point additions, utilization trends, and investment announcements, and then review any spikes that do not match policy timing or equipment supply conditions.
Before sign-off, assumptions are rechecked by a second analyst. Outliers trigger follow-ups with respondents to confirm what changed and why. Reports are refreshed annually, and interim updates are made when material events occur, such as major subsidy changes, pricing resets, or reporting revisions. Right before delivery, the latest public releases are re-scanned so clients receive an updated view rather than an older snapshot.
Mordor Intelligence's China Electric Vehicle Charging Infrastructure Market Size Compared With Other Published Estimates
Published market values for China electric vehicle charging infrastructure can vary a lot because firms do not always count the same revenue streams, time their currency conversions the same way, or refresh charger price and utilization assumptions at the same frequency. Differences can also show up when one estimate is anchored on installed base value, while another leans more toward annual charging revenue.
In this study, the refresh cadence and currency timing are treated as core controls, with charger ASP curves and utilization checks revalidated against recent deployment signals, a practical approach used across the workstream at Mordor Intelligence. When another publisher uses an older price deck, assumes a faster nationwide utilization ramp, or counts adjacent electrical equipment beyond charging, their current-year value can drift even if the long-term story is similar.
Benchmark comparison
| Source | Market Size | Gaps in Research Methodology |
|---|---|---|
| Mordor Intelligence | USD 25.60 B (2025) | |
| Industry Publisher A | USD 4.54 B (2024) | Uses a narrower charging-station framing and a different base year, and the page shows multiple internal figures, which makes it hard to reconcile what is included and how pricing and utilization were normalized. |
| Global Consultancy B | USD 15.17 B (2023) | Anchors the series to a 2023 base year and focuses on chargers and stations by slow versus fast revenue, which can undercount broader infrastructure value items captured when deployment activity is measured across site types and applications. |
The spread is mainly explained by scope boundaries and timing choices, including which year is treated as the anchor and how charger pricing is carried forward. By keeping the model tied to observed additions, charger mix, and checked ASP and utilization ranges, we can outline the totals in clear steps and make it easier to reproduce during updates.


Key Questions Answered in the Report
What is the current size of the China EV charging infrastructure market?
The market generated USD 37.61 billion in revenue during 2026 and is projected to reach USD 257.1 billion by 2031.
Which region leads charger deployment in China?
East China accounts for 31.12% of nationwide installations, with Guangdong, Zhejiang, and Jiangsu hosting the densest networks.
How fast is DC ultra-fast charging growing?
Stations above 150 kW are increasing at 26.41% CAGR as government subsidies and consumer preference shift toward rapid charging.
What standards dominate connector usage?
The GB/T DC standard holds 66.25% share, though CCS2 is expanding quickly within premium and joint-venture vehicle segments.
Page last updated on:


 Your data is secure and never sold or shared.


