EV Solid-state Battery Market Size and Share
Market Overview
| Study Period | 2020 - 2031 |
|---|---|
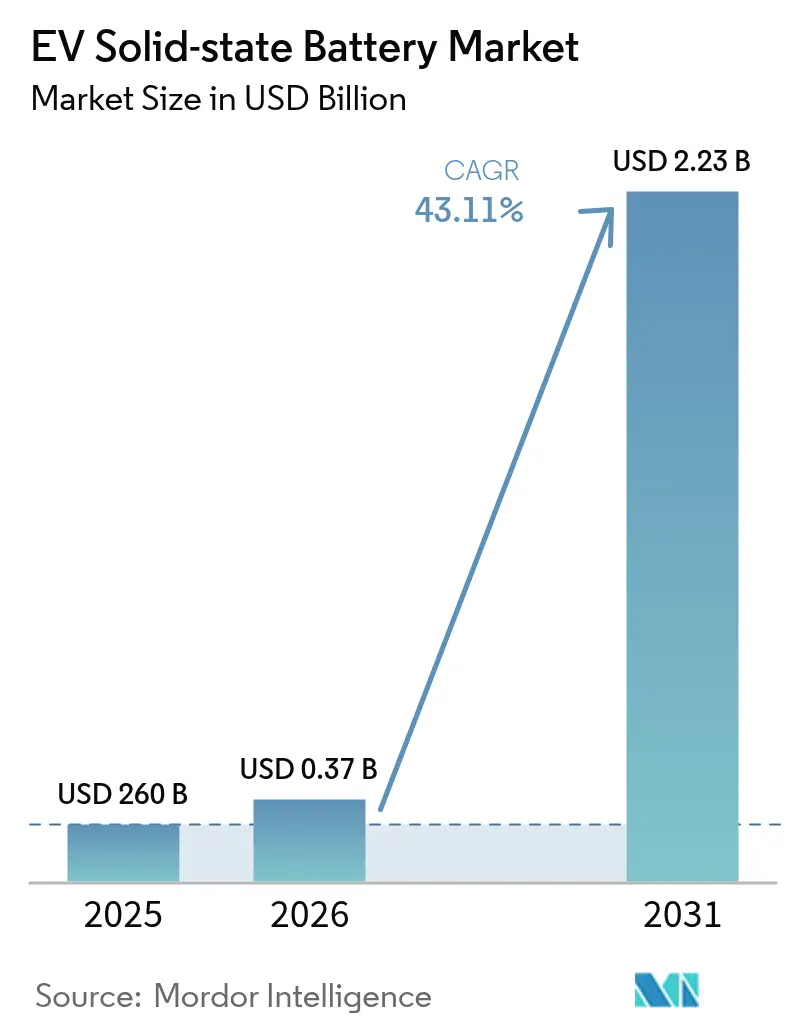
| Market Size (2026) | USD 0.37 Billion |
| Market Size (2031) | USD 2.23 Billion |
| Growth Rate (2026 - 2031) | 43.11% CAGR |
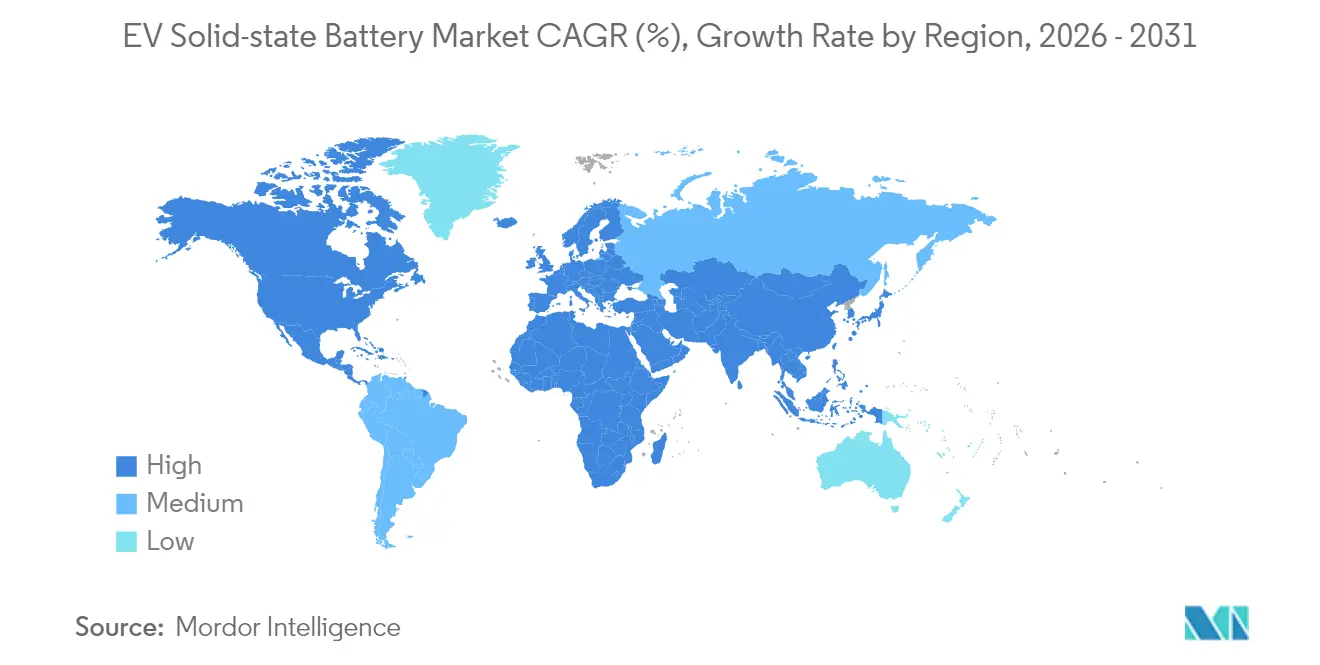
| Fastest Growing Market | Middle East and Africa |
| Largest Market | Asia Pacific |
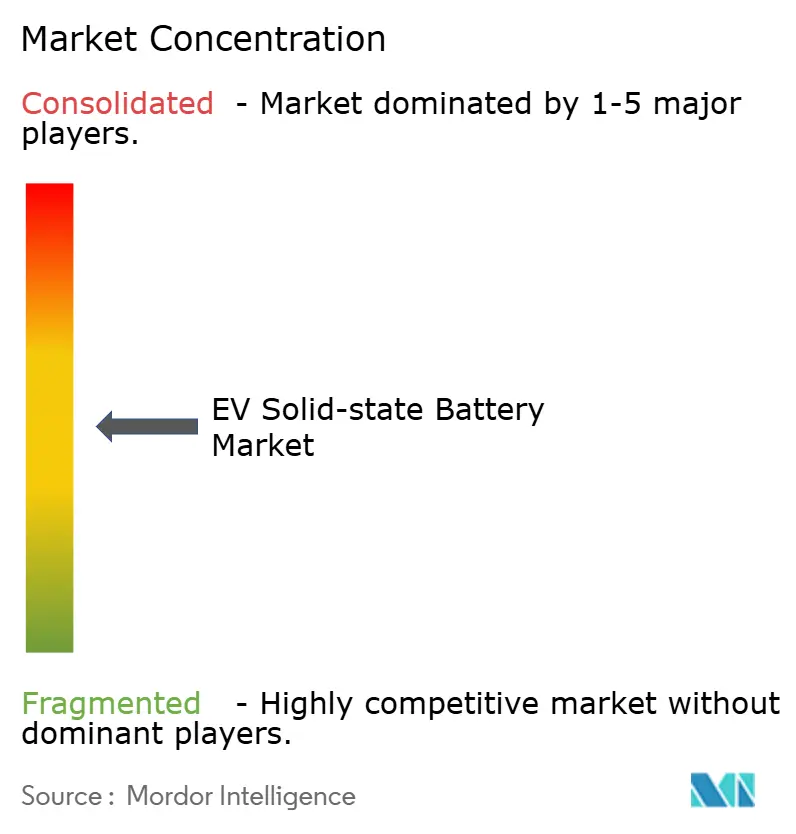
| Market Concentration | Medium |
Major Players *Disclaimer: Major Players sorted in no particular order Image © Mordor Intelligence. Reuse requires attribution under CC BY 4.0. | |
EV Solid-state Battery Market Analysis by Mordor Intelligence
EV solid-state battery market size in 2026 is estimated at USD 372.09 million, growing from 2025 value of USD 260 million with 2031 projections showing USD 2.23 billion, growing at 43.11% CAGR over 2026-2031. Intensifying zero-emission vehicle mandates, rapid advances in sulfide electrolyte processing, and automakers’ pilot-line investments are converging to accelerate adoption. Passenger cars remain the launchpad for commercial deployment, while commercial fleets register stronger incremental growth as operators recognise the technology’s lifetime cost advantages. Asia-Pacific leads global shipments, buoyed by integrated supply chains in Japan, South Korea, and China. Meanwhile, capacity additions in North America and Europe point to a broader geographic spread once manufacturing yields improve. Strategic risks concentrate around lithium-metal foil availability and roll-to-roll yield losses, but recent breakthroughs in anode-free cell formation and improved moisture-tolerant electrolytes are narrowing these gaps.
Key Report Takeaways
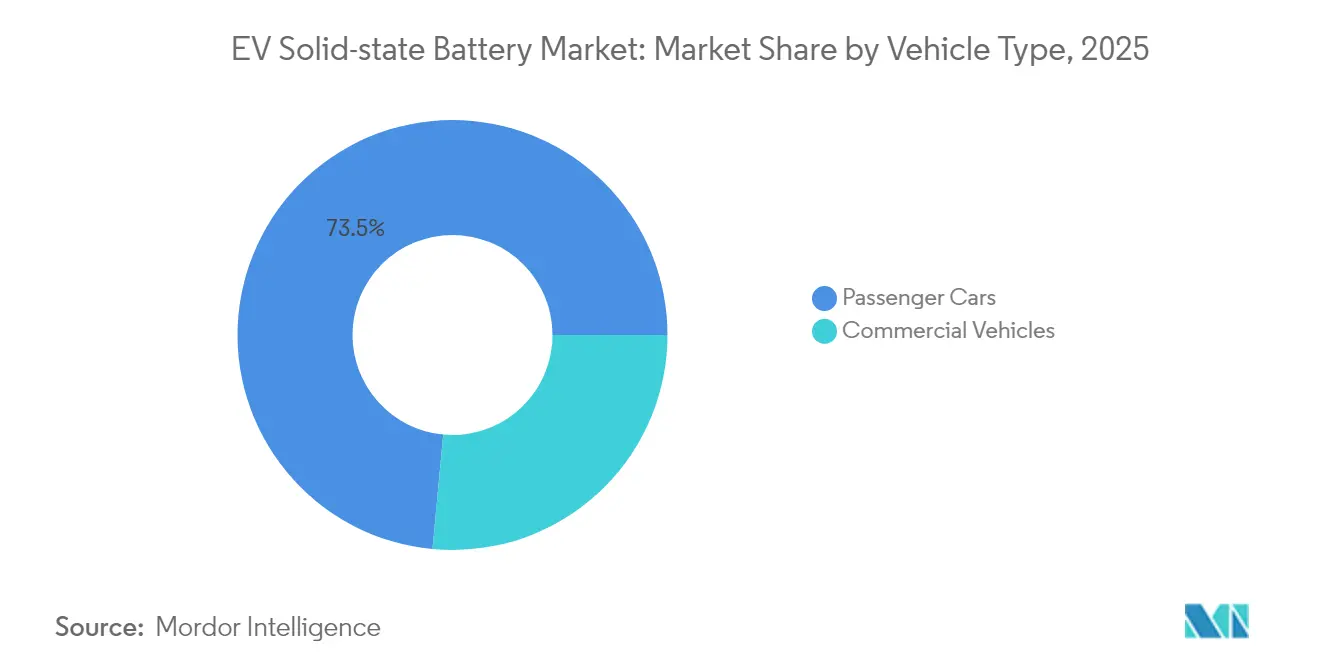
- By vehicle type, passenger cars led with 73.52% of the solid-state battery market share in 2025; commercial vehicles are projected to post the fastest 38.95% CAGR to 2031.
- By propulsion, battery electric vehicles (BEVs) accounted for 69.45% of the solid-state battery market size in 2025, and the segment is expected to rise at a 38.60% CAGR through 2031.
- By solid electrolyte type, sulfide chemistries commanded 46.92% market share in 2025, while oxide systems are forecast to expand at 30.25% CAGR to 2031.
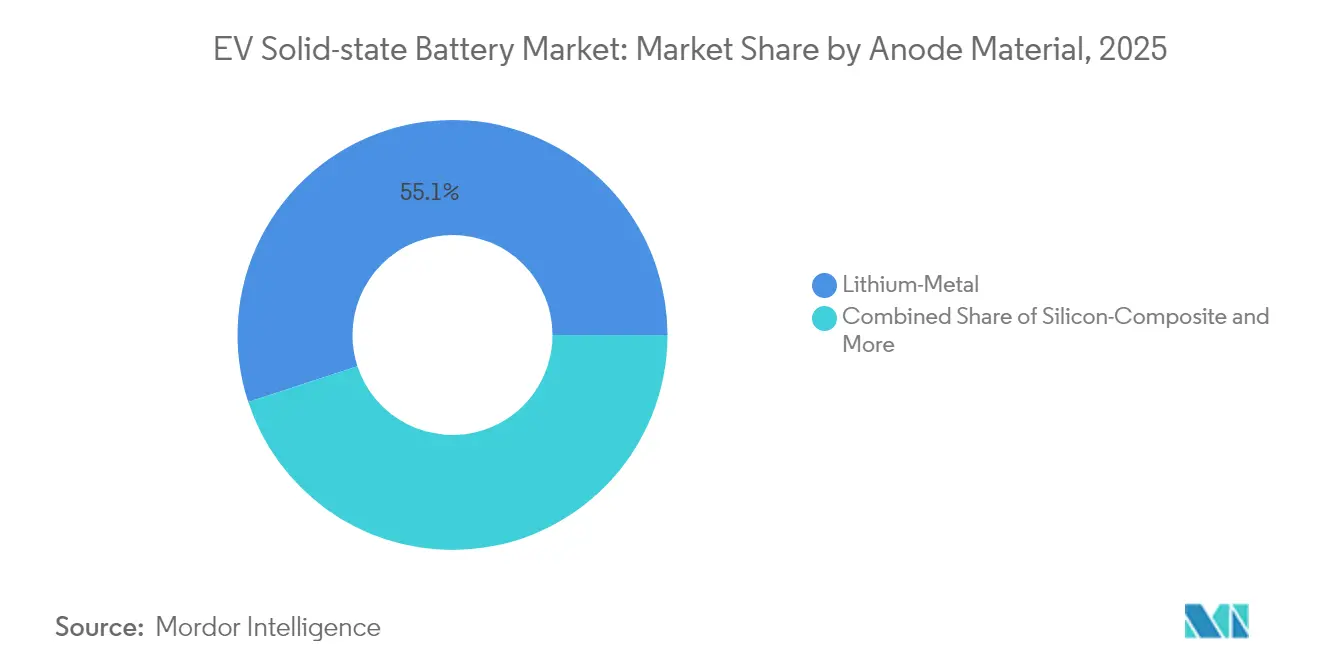
- By anode material, lithium-metal captured 55.05% share of the solid-state battery market size in 2025 and is advancing at a 44.10% CAGR between 2026 and 2031.
- By battery capacity, 20–100 Ah cells held 47.95% revenue share in 2025; cells above 100 Ah are projected to register the strongest 41.90% CAGR through 2031.
- By geography, Asia-Pacific dominated with 40.85% market share in 2025, whereas the Middle East and Africa are forecast to expand at a 35.40% CAGR to 2031.
Note: Market size and forecast figures in this report are generated using Mordor Intelligence’s proprietary estimation framework, updated with the latest available data and insights as of 2026.
Global EV Solid-state Battery Market Trends and Insights
Drivers Impact Analysis*
| Driver | (~) % Impact on CAGR Forecast | Geographic Relevance | Impact Timeline |
|---|---|---|---|
| Rapid EV Sales Expansion | +13.6% | Global, with concentration in China, Europe, North America | Medium term (2-4 years) |
| Energy Density and Safety Edge | +9.1% | Global, early adoption in premium segments | Long term (≥ 4 years) |
| ZEV Mandates and Incentives | +8.2% | North America, Europe, China | Short term (≤ 2 years) |
| Automaker Vertical Integration | +6.4% | Asia-Pacific, Europe, North America | Medium term (2-4 years) |
| Sulfide Roll-To-Roll Breakthroughs | +5.4% | Asia-Pacific core, spill-over to global manufacturing | Medium term (2-4 years) |
| Insurance Fire-Liability Pressure | +3.6% | North America & EU, regulatory-driven markets | Long term (≥ 4 years) |
| Source: Mordor Intelligence | |||
Rapid growth in global EV sales volumes
Global electric-vehicle sales are expected to top 20 million units in 2025, roughly triple 2021 levels, intensifying automakers’ search for batteries that charge faster and go farther[1]International Energy Agency, “Global EV Outlook 2025,” iea.org. China’s production dominance gives Asian cell makers early-scale advantages, while commercial-fleet electrification widens demand beyond consumer segments. Larger pack orders allow suppliers to push pilot lines toward higher equipment utilisation, in turn lowering per-kilowatt-hour costs. These dynamics collectively lift the solid-state battery market by expanding both the addressable vehicle pool and the willingness of buyers to pay technology premiums. Regional variations persist, but the overall trajectory remains upward as safety and range anxieties decline.
Energy-density and safety edge over Li-ion packs
Solid-state prototypes routinely exceed 500 Wh/kg, far above the 250–300 Wh/kg range of conventional lithium-ion packs, and recent laboratory work reports ionic conductivities of 5.7 mS/cm for sulfide electrolytes while retaining structural integrity under mechanical stress. Removing flammable liquid electrolytes lowers thermal-runaway risk, an increasingly important criterion for regulators and insurers. Automakers can therefore shrink pack footprints, recapture cabin space, and trim vehicle mass. These benefits translate into longer driving ranges or smaller batteries for the same range, both of which unlock design flexibility and cost-of-ownership gains. The technology’s tolerance for pure lithium-metal anodes further widens the performance gap, creating a compelling pull for high-end and fleet platforms.
Government ZEV mandates and battery incentives
California’s Advanced Clean Cars II rule requires every new light-duty vehicle sold in the state to be zero-emission by 2035, with steep interim targets beginning in 2026[2]California Air Resources Board, “Advanced Clean Cars II Regulations,” arb.ca.gov. The policy aligns with federal tax credits that tie battery sourcing and assembly to domestic manufacturing, prompting automakers to localise next-generation cell lines. Europe’s Green Deal Industrial Plan adds parallel funding for battery gigafactories and raw-material processing. These synchronised policies shorten payback periods for solid-state capital investments and provide early demand certainty.
Automaker in-house pilot lines (Toyota, VW, BMW)
Toyota’s 3 GWh lithium-sulfide joint venture, Volkswagen’s 40 GWh partnership with QuantumScape, and BMW’s prototype programs highlight an emerging pattern: major automakers are vertically integrating cell development to secure differentiation. These projects improve knowledge spill-over across the supply chain, allowing rapid iteration on yield bottlenecks and quality control. Early production volumes will flow to premium models where margins are wider, but lessons learnt pave the way for higher-volume segments by 2028.
Restraints Impact Analysis*
| Restraint | (~) % Impact on CAGR Forecast | Geographic Relevance | Impact Timeline |
|---|---|---|---|
| High Production Cost and Yield Loss | -9.1% | Global, acute in early-stage manufacturing | Short term (≤ 2 years) |
| Limited Gigascale Capacity | -7.3% | Global, supply-demand imbalance | Medium term (2-4 years) |
| Lithium-Metal Foil Bottleneck | -5.4% | Global, concentrated in specialized suppliers | Medium term (2-4 years) |
| Recycling Pathway Uncertainty | -3.6% | Developed markets with strict recycling mandates | Long term (≥ 4 years) |
| Source: Mordor Intelligence | |||
High production cost and low manufacturing yield
Present solid-state cells cost USD 400–500 per kWh, roughly four times the average cost of today’s lithium-ion packs, due to strict moisture controls and tight tolerances at solid–solid interfaces. Yield losses reach double-digit percentages on many pilot lines, amplifying unit costs during early runs. Process innovations, such as vapour-deposited lithium foils and anode-free stacking, show promise in halving defect rates, yet industrial validation is still underway. Until these improvements move from lab to line, price premiums will restrain widespread rollout.
Limited gigascale capacity before 2028
Most existing facilities are sized in the tens of megawatt-hours, insufficient for mainstream automotive demand. Despite multiple announcements, only a handful of confirmed projects will cross the gigawatt-hour threshold before 2028. The capital intensity of moisture-free roll-to-roll systems and the limited roster of specialised equipment makers slow build-outs. This mismatch between demand forecasts and physical output will limit near-term availability, thereby moderating adoption curves outside premium and fleet niches.
*Our forecasts treat driver/restraint impacts as directional, not additive. The impact forecasts reflect baseline growth, mix effects, and variable interactions.
Segment Analysis
By Vehicle Type: Passenger cars drive early adoption
The passenger-car segment generated 73.52% of 2025 revenue, reflecting early deployments in high-value models where performance and safety command price premiums. Commercial fleets trail in share yet post a 38.95% CAGR to 2031 as operators weigh total-cost-of-ownership savings from longer-lasting packs and reduced downtime. Toyota plans to launch solid-state packs first in luxury coupes, then cascade the chemistry to broader line-ups once costs fall. Fleet managers, by contrast, prioritise rapid charging and durability, making them receptive to higher upfront battery prices that cut maintenance.
The segment pattern indicates a two-wave adoption curve: personal-luxury vehicles establish brand credibility and engineering reliability, followed by light-duty vans and trucks that prize utilisation rates. As warranty data accumulate and unit costs slide, mainstream passenger segments will account for the bulk of unit volumes post-2028. This shift mirrors the historical rollout of high-nickel lithium-ion packs and creates a stepping-stone to mass-market penetration.


By Propulsion: BEVs lead solid-state integration
BEVs absorbed 69.45% of shipments in 2025 and are forecast to grow at 38.60% CAGR over the outlook period. Pure-electric platforms exploit the chemistry’s high energy density to extend range without enlarging packs, an advantage less critical to hybrids. PHEVs nonetheless gain from faster charge acceptance, which raises electric-only driving fractions and improves fleet emissions compliance.
Most automakers align their solid-state roadmaps with flagship electric architectures because premium margins can cover early cell premiums. As costs decline, PHEV and series-hybrid platforms will adopt thinner, lighter solid-state modules that free up packaging space or allow battery downsizing. In parallel, regulatory pressure for zero tailpipe emissions cements BEVs as the dominant propulsion fit for the technology.
By Solid Electrolyte Type: Sulfides dominate manufacturing
Sulfide electrolytes captured 46.92% share in 2025, and is projected to expand at a 35.80% CAGR thgrough 2031, owing to superior ionic conductivity and compatibility with existing roll-to-roll coating lines. Controlled-atmosphere requirements raise capex, yet early movers argue that the conductivity benefits outweigh handling complexity. Oxide systems provide enhanced moisture tolerance at the cost of thickness-induced resistance, while polymer variants serve specialist applications where flexibility matters more than absolute performance.
Recent research data show sulfide thin films achieving 900 Wh/L pack-level densities, supporting the case for high-volume electrified powertrains. Ongoing work on high-entropy argyrodite blends aims to raise conductivity above 6 mS/cm, equal to liquid electrolytes. Oxides will likely carve out niches in stationary storage and safety-critical mobility, whereas polymers remain focused on wearables and micro-mobility.
By Anode Material: Lithium-metal leads performance
Lithium-metal anodes claimed 55.05% market share in 2025, underlining the technology’s core benefit: maximum usable capacity. Solid-state separators suppress dendrites even under aggressive cycling, unlocking theoretical gravimetric capacities near 3,860 mAh/g. Silicon-composite and graphite-composite anodes offer intermediate steps for manufacturers wary of pure lithium scaling challenges.
Lithium-metal cells are projected to scale at 44.10% CAGR to 2031, partly driven by anode-free stack designs that plate lithium during first charge, reducing foil consumption. Silicon-dominant blends provide a hedge, exploiting existing supply chains and cell formats while preserving room for future upgrades. Consequently, the anode race will likely resolve in a hybrid landscape where different chemistries target distinct vehicle price bands.
By Battery Capacity: Mid-range dominates applications
Cells rated 20–100 Ah formed 47.95% of total shipments in 2025 as they map neatly to 50–100 kWh automotive packs. Above-100 Ah formats are growing fastest at 41.90% CAGR, reflecting efforts to cut module count and wiring complexity. Sub-20 Ah cells remain relevant for aerospace, medical, and niche consumer devices that value intrinsic safety more than lowest cost.
Ongoing scaling programmes aim to standardise large-format prismatic and 46-series cylindrical designs, each delivering six-fold energy increases over today’s 21700 cells. Rising capacities align with automakers’ push for simplified pack architecture, which in turn feeds back into lower assembly costs and easier recycling.
Geography Analysis
Asia-Pacific led the solid-state battery market with 40.85% share in 2025, anchored by Japan’s lithium-sulfide value chain and South Korea’s pilot-line expertise. Government funding underpins cell R&D and early vehicle integration projects, while established lithium-ion export corridors shorten scale-up learning curves.
North America, supported by Inflation Reduction Act credits and a target of more than 1,200 GWh annual cell capacity by 2030, emerges as the next major growth pole. Volkswagen’s planned St. Thomas gigafactory and multiple start-up pilot lines point to an ecosystem forming around domestic supply mandates. Companies leverage proximity to cobalt, lithium, and nickel deposits in Canada and the United States to secure raw-material resilience.
The Middle East and Africa register the highest CAGR at 35.40%, albeit from a small base, driven by green-hydrogen hubs and utility-scale storage pilots that leapfrog to solid-state chemistries for safety and durability reasons. Europe maintains steady progress with Germany’s FestBatt initiative and multi-partner consortia targeting commercial output by decade’s end. European automakers’ integration efforts ensure eventual demand pull, while public-private funding pools accelerate material science breakthroughs.

Competitive Landscape
The solid-state battery market remains moderately fragmented. Competitive differentiation revolves around patent portfolios, electrolyte formulations, and roll-to-roll yields.
Toyota concentrates on sulfide chemistry and in-house pack integration. Samsung SDI pursues an anode-free design that improves volumetric density, while QuantumScape commercialises a ceramic separator licensed to multiple automakers. Start-ups such as ProLogium focus on flexible oxide stacks for premium consumer electronics and e-motorcycles, indicating wider horizontal applications beyond cars.
Strategic alliances between automakers and cell developers intensify as companies race to lock in capacity. Evidence of consolidation potential is visible in recent joint ventures and equity stakes, particularly where automakers exchange capital for guaranteed cell off-take. Nonetheless, the sector’s capital intensity and stringent quality thresholds limit viable entrants, suggesting a medium-term shift toward an oligopolistic structure once pilot lines mature.
EV Solid-state Battery Industry Leaders
Toyota Motor Corporation
Samsung SDI Co., Ltd
Solid Power Inc.
LG Energy Solution Ltd
QuantumScape Corporation
- *Disclaimer: Major Players sorted in no particular order

Recent Industry Developments
- June 2025: QuantumScape integrated its Cobra separator process into pilot production, boosting throughput and triggering a 37% share-price jump.
- February 2025: Idemitsu broke ground on a 3 GWh lithium-sulfide facility to supply Toyota’s next-generation packs.
- October 2024: QuantumScape shipped QSE-5 B-sample cells with 800 Wh/L energy density and sub-15-minute 10–80% charging for automotive validation.
- July 2024: Volkswagen’s PowerCo unit and QuantumScape agreed to industrialise solid-state cells at an initial 40 GWh annual capacity, expandable to 80 GWh.


Research Methodology Framework and Report Scope
Market Definitions and Key Coverage
Our study defines the electric-vehicle solid-state battery market as revenue from factory-built rechargeable packs that employ a fully solid electrolyte and are delivered to automakers or tier-1 integrators for battery-electric and range-extender cars. According to Mordor Intelligence, 2025 is the base year and every value is expressed in USD at first commercial shipment.
Scope Exclusions: Prototype cells below technology-readiness level six, aftermarket replacements, consumer electronics, and stationary storage systems fall outside scope.
Segmentation Overview
- By Vehicle Type
- Passenger Cars
- Commercial Vehicles
- By Propulsion
- Battery Electric Vehicle (BEV)
- Plug-in Hybrid Electric Vehicle (PHEV)
- Hybrid Electric Vehicle (HEV)
- By Solid Electrolyte Type
- Sulfide-based
- Oxide-based
- Polymer-based
- By Anode Material
- Lithium-Metal
- Silicon-Composite
- Graphite-Composite
- By Battery Capacity
- Below 20 Ah
- 20 to 100 Ah
- Above 100 Ah
- By Geography
- North America
- United States
- Canada
- Rest of North America
- South America
- Europe
- Germany
- United Kingdom
- France
- Spain
- Russia
- Rest of Europe
- Asia-Pacific
- China
- Japan
- South Korea
- India
- Australia
- Rest of Asia-Pacific
- Middle East and Africa
- Saudi Arabia
- UAE
- South Africa
- Egypt
- Nigeria
- Rest of Middle East and Africa
- North America
Detailed Research Methodology and Data Validation
Primary Research
Mordor analysts spoke with cell engineers, procurement heads at three automakers, Japanese material suppliers, and European safety regulators; their insights on yield, pack pricing, and certification hurdles helped us stress-test every secondary assumption.
Desk Research
We begin by mapping supply and demand with open datasets such as the International Energy Agency Global EV Outlook, UN Comtrade HS-850760 trade flows, national ministry disclosures, and the U.S. DOE battery price tracker, which anchor early volume and price curves. Patent families retrieved through Questel signal chemistry momentum, while D&B Hoovers filings and Dow Jones Factiva news uncover pilot capacities and joint ventures. Investor decks and trade association white papers add policy-timing clues. Many other public records also feed our desk work, and a second pass reconciles currency, units, and inflation before findings move forward.
Market-Sizing & Forecasting
Our core model starts with regional EV output forecasts, applies solid-state adoption curves, average pack capacities, and cell ASPs, then cross-checks totals through a focused bottom-up roll-up of announced gigafactory ramps and sample purchase orders. Key variables like gigafactory utilization, sulfide electrolyte yield, lithium-metal costs, warranty-cycle expectations, and ZEV mandates feed a multivariate regression whose results are smoothed exponentially before the baseline is locked.
Data Validation & Update Cycle
Mordor Intelligence runs variance checks against independent price indices and battery export dashboards; results that drift beyond two standard deviations trigger senior review. Reports refresh each year, with interim updates after material commercialization milestones, and a final sweep precedes delivery.
Why Mordor's EV Solid-state Battery Baseline Earns Trust
Published estimates differ because firms vary in prototype inclusion, end-use coverage, and currency treatment.
The comparison shows that our disciplined scope, transparent variables, and yearly refresh give decision-makers a balanced, repeatable baseline they can trust.
Benchmark comparison
| Market Size | Anonymized source | Primary gap driver |
|---|---|---|
| USD 0.26 B (2025) | Mordor Intelligence | - |
| USD 0.37 B (2025) | Global Consultancy A | Counts stationary storage and government grants as revenue |
| USD 1.18 B (2024) | Industry Association B | Converts announced capacity to sales and mixes consumer electronics |
| USD 0.16 B (2024) | Trade Journal C | Omits cells under 20 Ah and pilot lots below 10 MWh |
The comparison shows that our disciplined scope, transparent variables, and yearly refresh give decision-makers a balanced, repeatable baseline they can trust.


Key Questions Answered in the Report
What is the current size of the solid-state battery market?
The solid-state battery market size stands at USD 372.09 million in 2026 and is forecast to reach USD 2.23 billion by 2031.
How fast is the solid-state battery market growing?
The market is projected to register a 43.11% compound annual growth rate between 2026 and 2031.
Which region leads the solid-state battery market?
Asia-Pacific holds the largest share at 40.85% in 2025 owing to integrated supply chains and aggressive pilot-line investment.
Why are solid-state batteries considered safer than lithium-ion?
They eliminate flammable liquid electrolytes, reducing thermal-runaway risk and enabling safer deployment in high-energy applications.
When will large-scale solid-state battery production begin?
Commercial output is expected to ramp from 2027 onward as pilot lines transition to multi-gigawatt-hour capacities.
Which vehicle segment will adopt solid-state batteries first?
Premium passenger cars are set to pioneer adoption, followed by commercial fleets that prioritise reduced charging downtime.
Page last updated on:


