Market Overview
| Study Period | 2021 - 2031 |
|---|---|
| Base Year For Estimation | 2025 |
| Forecast Data Period | 2026 - 2031 |
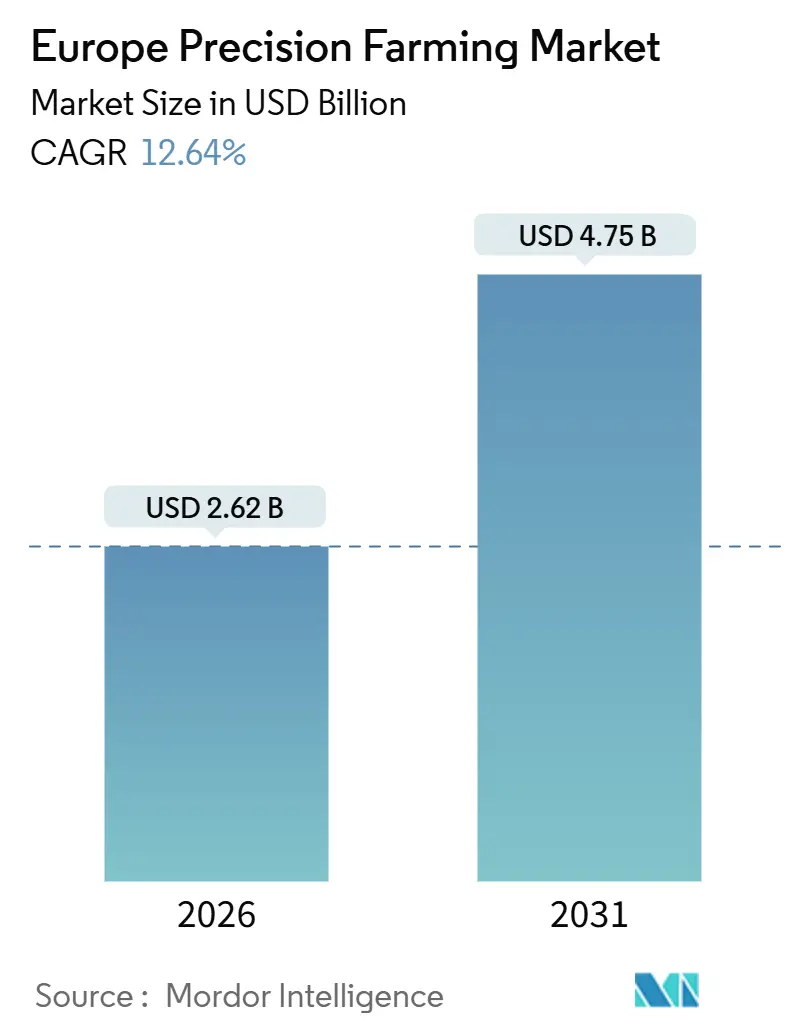
| Market Size (2026) | USD 2.62 Billion |
| Market Size (2031) | USD 4.75 Billion |
| Growth Rate (2026 - 2031) | 12.64% CAGR |
| Market Concentration | Medium |
Major Players
*Disclaimer: Major Players sorted in no particular order Image © Mordor Intelligence. Reuse requires attribution under CC BY 4.0. |
|
Europe Precision Farming Market Analysis by Mordor Intelligence
The Europe precision farming market size is estimated to be USD 2.62 billion in 2026 and is forecast to climb to USD 4.75 billion by 2031, delivering a 12.64% CAGR. Adoption is advancing from reactive input control toward integrated, data-driven systems that maximize yield and satisfy strict sustainability rules. Large growers continue to refresh guidance equipment and variable rate spreaders, while mid-sized operators increasingly rely on subscription software that merges satellite imagery, soil telemetry, and localized weather. Regulatory pressure under the Common Agricultural Policy reform, labor shortages, and expanding 5G connectivity are converging to shorten payback periods for sensor networks and autonomous machinery. Competition is intensifying as start-ups and drone specialists bypass traditional dealers with lower-cost, direct-to-farmer models, prompting incumbents to focus on machine learning-enabled services. Venture backing and insurance discounts provide additional momentum, signaling that the European precision farming market will keep compounding even if grain prices fluctuate.
Key Report Takeaways
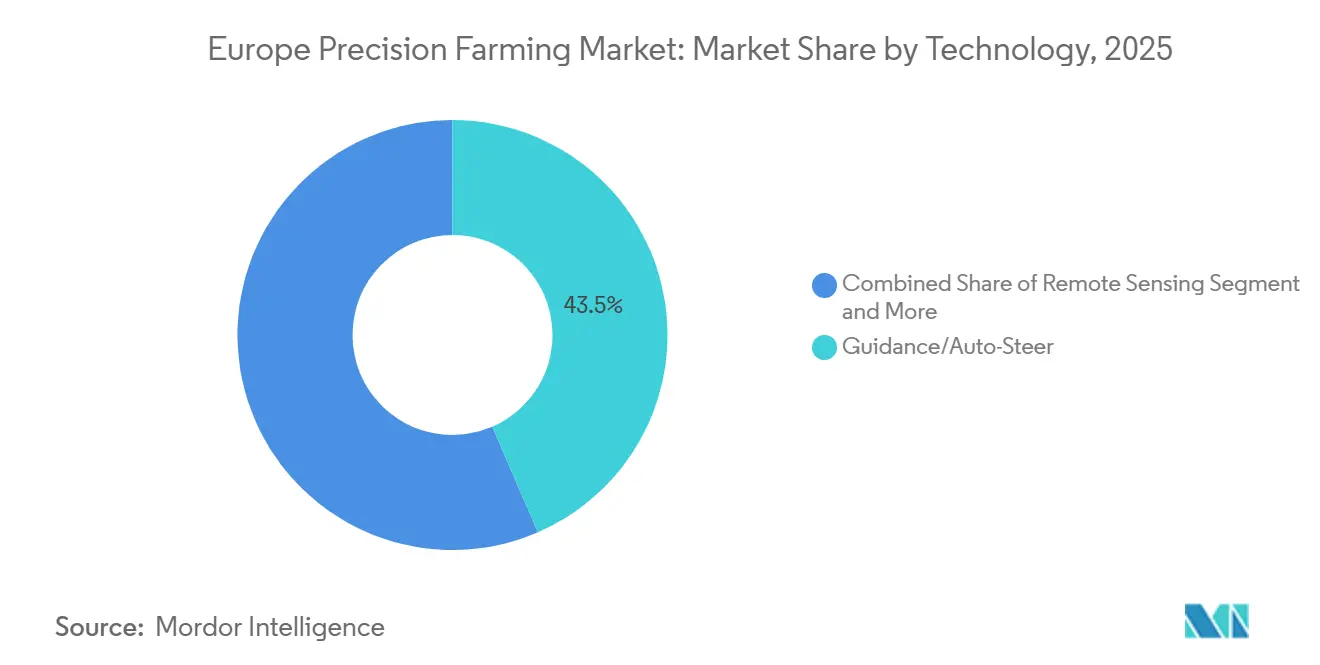
- By technology, guidance systems led with 43.5% of the Europe precision farming market share in 2025, while drones and unmanned aerial vehicles are projected to grow at an 11.1% CAGR through 2031.
- By component, hardware captured 48.2% of the Europe precision farming market size in 2025, while software is projected to advance at a 11.2% CAGR through 2031.
- By application, yield monitoring accounted for a 31.5% share of the European precision farming market size in 2025, and crop scouting and pest detection are projected to accelerate at a 11.4% CAGR through 2031.
- By farm size, large operations held 43.7% of the Europe precision farming market share in 2025, whereas medium farms posted the highest projected CAGR at 10.8% to 2031.
- By crop type, cereals and grains accounted for 37.8% of the revenue in 2025, while fruits and vegetables are projected to expand at a 9.7% CAGR during the forecast period.
- By geography, Germany contributed 37.8% of regional revenue in 2025 and Poland records the fastest 7.8% CAGR through 2031.
Note: Market size and forecast figures in this report are generated using Mordor Intelligence’s proprietary estimation framework, updated with the latest available data and insights as of January 2026.
Europe Precision Farming Market Trends and Insights
Drivers Impact Analysis
| Driver | (~) % Impact on CAGR Forecast | Geographic Relevance | Impact Timeline |
|---|---|---|---|
| Government subsidies accelerating digital adoption | +2.1% | Pan European, strongest in Poland, Romania, and Baltic states | Medium term (2 to 4 years) |
| Rapid AI, IoT, and 5G enabled on farm analytics | +2.8% | Germany, Netherlands, France, with pilot deployments in Spain and Italy | Long term (4 years and beyond) |
| Shift toward low input sustainable food systems | +1.9% | Northern Europe and Alpine regions, driven by organic certification growth | Long term (4 years and beyond) |
| Labor scarcity spurring fully autonomous machinery | +2.3% | Western Europe, particularly Germany, France, and United Kingdom | Short term (2 years or less) |
| Growing venture funding for ag robotics startups | +1.6% | Concentrated in Netherlands, Germany, and France innovation hubs | Medium term (2 to 4 years) |
| Climate risk insurance discounts for precision farms | +1.2% | Mediterranean belt (Spain, Italy, Greece) and drought prone regions | Medium term (2 to 4 years) |
| Source: Mordor Intelligence | |||
Understand The Key Trends Shaping This Market
Download PDF
Government Subsidies Accelerating Digital Adoption
European Union member states have earmarked billions from the Common Agricultural Policy budget to support precision farming, reimbursing a significant share of the hardware costs for smallholdings[1]Source: European Commission, “Common Agricultural Policy at a Glance,” ec.europa.eu. France offers tax credits on software fees, which encourage more farmers to enroll in digital platforms[2]Source: French Ministry of Agriculture, “Digital Tax Credit Uptake,” agriculture.gouv.fr. In 2024, it collected €756 million (USD 830 million) from these tax credits, up from €277 million (USD 305 million) at its introduction five years earlier. Germany launched a major grant program for autonomous machinery, prioritizing producer cooperatives to accelerate adoption. Subsidies are particularly influential in Eastern Europe, where operators leapfrog directly to advanced sensor networks, compressing adoption cycles. This financial support reduces risk perceptions, unlocks bank lending, and lifts baseline demand across the precision farming market.
Rapid AI, IoT, and 5G Enabled Analytics
Rural 5G coverage now extends across much of European farmland, enabling real-time video streams from tractors to cloud-based models. IoT soil sensors linked with weather data have demonstrated significant water savings without yield loss, showing the immediate benefits of connected systems. Farmers using advanced spraying technologies have reported sharp reductions in herbicide use, confirming cost savings and environmental gains. Edge computing implements trims latency to milliseconds, allowing autonomous systems to adjust seeding row by row. Together, AI and connectivity elevate precision farming from descriptive mapping to prescriptive action, widening the gap between digitized and analog farms.
Shift Toward Low Input Sustainable Food Systems
European retailers have tightened pesticide residue limits and now demand digital spray logs from suppliers, pushing farms toward precision sprayers that modulate doses in real time. Studies show these systems can reduce glyphosate use substantially, aligning with sustainability goals. Organic certifiers increasingly accept sensor-based nutrient plans, integrating technology into a segment once considered low-tech. The Farm to Fork strategy allocates significant funding for biological control research, harnessing sensor networks to improve outcomes. Variable rate nitrogen services illustrate how compliance can be profitable, reducing input use while maintaining productivity.
Labor Scarcity Spurring Autonomous Machinery
The agricultural workforce has declined steadily, raising wages and magnifying peak-season bottlenecks. Autonomous tractors are now operating thousands of driverless hours in countries where labor costs are high, easing pressure on farm operations. New systems allow one operator to supervise multiple machines simultaneously, tripling efficiency in the field. Robotic harvesters are being adopted in fruit and vegetable operations as wage bills continue to climb. Regulatory approvals for autonomous vehicles are paving the way for wider rollouts, signaling that automation will play a central role in addressing labor shortages.
Restraints Impact Analysis
| Restraint | (~) % Impact on CAGR Forecast | Geographic Relevance | Impact Timeline |
|---|---|---|---|
| High upfront retrofit hardware costs | -1.8% | Most acute in Southern and Eastern Europe where farm incomes lag Western averages | Short term (2 years or less) |
| Fragmented data privacy and interoperability rules | -1.3% | Pan European, with divergent national interpretations of General Data Protection Regulation | Medium term (2 to 4 years) |
| Digital skills gap among aging farmers | -1.1% | Rural areas across all countries, particularly pronounced in Poland, Romania, and Greece | Long term (4 years and beyond) |
| Limited financing options for mid size growers | -0.9% | Southern Europe and smaller member states with less developed agricultural credit markets | Medium term (2 to 4 years) |
| Source: Mordor Intelligence | |||
High Upfront Retrofit Hardware Costs
The high upfront costs of retrofit hardware slow precision farming adoption[3]Source: European Agricultural Machinery Association, “Technology Adoption Survey,” cema-agri.org. Guidance kits can represent more than a year of profit for smaller farms, making investment decisions difficult. Compatibility challenges add further expense when older tractors require adapters, raising the barrier to entry. Multispectral drones, while valuable, remain costly and require trained pilots, adding to operational overhead. Shared machinery programs have limited penetration due to coordination and liability concerns, leaving capital-intensive technologies slower to spread across the market.
Fragmented Data Privacy and Interoperability Rules
Data privacy regulations classify yield maps as personal data when tied to individual farms, requiring explicit consent for sharing. Divergent national interpretations create uncertainty, leading some platforms to restrict operations within single borders. Interoperability remains a challenge, with multi-brand fleets often experiencing data format clashes that block seamless uploads to management platforms. The lack of a common exchange standard limits cross-border benchmarking and erodes potential network effects. These issues dampen growth by complicating collaboration and slowing the scaling of precision farming solutions.
Segment Analysis
By Technology: GPS Dominance Faces VRT Disruption
Guidance systems remain the backbone of the Europe precision farming market share, with the largest share in 2025 at 43.5%. Their dominance stems from widespread adoption across cereal farms, where auto-steer combines deliver immediate fuel and labor savings. Minimal digital literacy requirements make them accessible, ensuring strong replacement demand. Yet growth is moderating as the installed base matures, shifting focus toward incremental upgrades rather than new installations. Guidance systems continue to anchor legacy revenue streams, reinforcing their role as the most established technology.
Drones, by contrast, represent the fastest-growing technology, advancing at an 11.1% CAGR through 2031. Their appeal lies in innovation spending, as progressive growers integrate drone imagery with satellite maps to refine variable rate prescriptions. Enterprise software converts raw imagery into actionable zones, driving adoption beyond early enthusiasts. Emerging tools such as remote sensing, edge sensors, and digital twins are gaining traction, supported by low-cost processors and expanding 5G connectivity. Drones illustrate how innovation spending is reshaping the technology mix in precision farming.
Note: Segment shares of all individual segments available upon report purchase
Get Detailed Market Forecasts at the Most Granular Levels
Download PDF
By Component: Software Accelerate and Hardware Dominate
Hardware continues to dominate spending, capturing the largest share in the 2025 Europe precision farming market size at 48.2%. Durable equipment such as GPS receivers, cameras, and controllers remains essential for field operations. Even as unit prices decline, aggregate demand is resilient because farms require tangible tools to sustain productivity. Hardware’s entrenched role ensures its continued importance, though its growth trajectory is slower compared to digital solutions. The segment reflects the enduring need for physical infrastructure in precision farming, anchoring the market’s foundation.
Software, however, is the fastest-growing component, expanding at an 11.2% CAGR through 2031. Vendors are migrating to subscription-based cloud models, which enable continuous upgrades and reduce upfront costs. This architecture attracts medium-scale operators who previously faced capital hurdles. Service revenue also rises in parallel, as farms require calibration, data cleaning, and agronomic interpretation. Predictive maintenance and analytics subscriptions are becoming mainstream, positioning software as the clear growth engine. The accelerating shift highlights how digital platforms are reshaping the component landscape.
By Application: Yield Monitoring Leadership Threatened by Pest Detection Innovation
Yield monitoring remains the leading application, accounting for the largest share in 2025 at 31.5%. Two decades of sensor refinement have embedded yield mapping into harvest routines, producing spatial data that guides fertilizer planning. Farms are increasingly integrating these maps with soil grids, reinforcing a virtuous cycle of data-driven decision-making. Growth is supported by aftermarket retrofits and analytics subscriptions, which enhance the value of existing datasets. Yield monitoring’s maturity ensures its continued dominance, anchoring application revenue in precision farming.
Crop scouting and pest detection are the fastest-growing applications, advancing at an 11.4% CAGR through 2031. Drone and rover imagery processed by advanced algorithms detects disease earlier than human scouts, reducing fungicide use and improving efficiency. Variable rate application tools benefit from accurate scouting data, enabling precise interventions. Compliance modules also gain traction as digital record-keeping becomes compulsory under sustainability directives. Crop scouting illustrates how innovation and regulation converge to accelerate the adoption of precision farming, reshaping the application mix.
By Crop Type: Precision Viticulture Emerges as Premium Growth Driver
Cereals and grains dominate crop type adoption, accounting for the largest share in 2025 at 37.8%. Mature ecosystems, providing guidance and yield mapping, are deeply embedded in arable regions. Variable-rate nitrogen remains a critical lever in wheat and barley rotations, reinforcing the leadership of these cereals. Oilseeds and pulses employ similar strategies but require adjustments to equipment for smaller seed sizes. Cereals’ entrenched role ensures their continued dominance, anchoring crop-type revenue in precision farming.
Fruits and vegetables are the fastest-growing crop type, expanding at a 9.7% CAGR through 2031. Higher revenue per hectare and stricter residue requirements are driving the adoption of precision irrigation, robotic harvesting, and targeted spraying. Specialty crops attract venture capital, accelerating tool development despite smaller acreage. Vineyards and horticultural operations prioritize micro-climate control, reinforcing innovation spending. Fruits and vegetables exemplify how high-value segments drive growth, reshaping the adoption of crop types in precision farming.

Note: Segment shares of all individual segments available upon report purchase
Get Detailed Market Forecasts at the Most Granular Levels
Download PDF
By Farm Size: Small Farm Digitization Accelerates Despite Large Farm Dominance
Large-scale farms dominate installations, holding the largest share in 2025 at 43.7%. Their size allows them to deploy full technology stacks, including guidance, telematics, and enterprise software. Many are piloting autonomous tractors to address labor shortages and fuel costs. Large farms’ ability to absorb upfront investments ensures their leadership in digital adoption. Their scale positions them as early adopters of advanced technologies, reinforcing their role as the anchor of precision farming adoption.
Medium-scale farms are the fastest-growing, with a 10.8% CAGR through 2031. Leasing consortia and cloud dashboards lower capital barriers, enabling broader participation. These farms increasingly adopt subscription models that simplify use and reduce upfront costs. Smartphone-based platforms and rural broadband further support adoption, narrowing the digital gap between farm sizes. Over time, medium-scale farms are projected to accelerate digital intensity, reshaping the balance of adoption across Europe. Their agility positions them as the growth engine of farm-size segments.
Geography Analysis
Germany leads the Europe precision farming market, contributing the largest 2025 share at 37.8%. Its dominance is supported by large average farm sizes and a strong domestic machinery manufacturing base. German growers have embraced guidance systems, autonomous machinery, and integrated software platforms, reinforcing the country’s leadership in digital adoption. National grant programs and cooperative models further accelerate uptake, ensuring Germany remains the anchor of precision farming in Europe.
Poland is the fastest-growing geography, advancing at a 7.8% CAGR through 2031. Cohesion funds covering sensor and software purchases have lowered barriers for adoption, while younger farm operators demonstrate higher digital readiness compared to Western Europe. Medium-scale farms are particularly active, leveraging subsidies and cloud-based dashboards to modernize operations. Poland’s rapid climb highlights how supportive policy frameworks and generational shifts can transform adoption rates, positioning the country as Europe’s growth engine in precision farming.
Other European regions show varied adoption patterns. France combines large arable estates with high-value vineyards, driving demand for both guidance systems and precision spraying. The Netherlands punches above its acreage weight due to intensive horticulture and strong research ecosystems, while Spain and Italy accelerate adoption in olives, grapes, and produce through insurance rebates and sustainability incentives. The United Kingdom leans on environmental payments tied to input reduction, while Romania and Bulgaria benefit from loan guarantees that spur equipment financing. Together, these regions illustrate Europe’s diverse precision farming landscape.
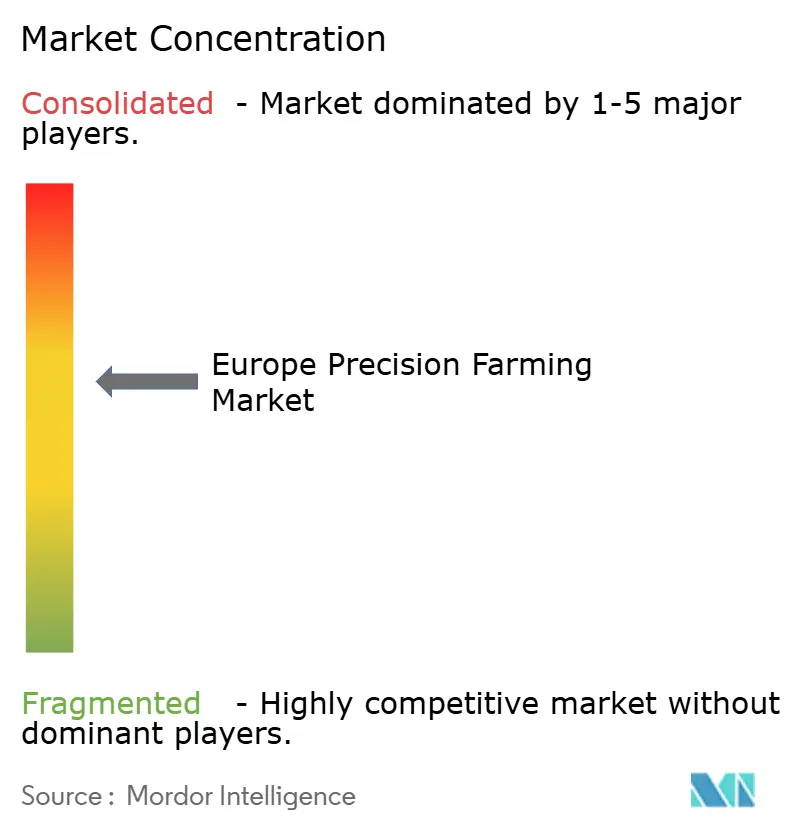
Competitive Landscape
The Europe precision farming market exhibits moderate concentration. The top five suppliers capture a dominant share of the aggregate revenue, yet no single brand holds more than a one-fifth share, preserving room for challengers. Deere & Company is one of the leading players, offering a diverse range of products across Europe. AGCO’s PTx Trimble follows, leveraging combined guidance-software stacks, while CNH Industrial rounds out the top three.
Topcon and CLAAS round out the leaders but face margin pressure from lower-cost entrants. Incumbents pursue software acquisitions to lock customers into proprietary ecosystems, while chemical companies expand into agronomy analytics. Start-ups target niche pain points, offering robotic weeders and specialized solutions at competitive prices. Patent filings for agricultural robotics continue to rise, underscoring the importance of intellectual property as a barrier to entry. Innovation and competition converge to reshape the market’s dynamics.
Moderate consolidation is anticipated as compliance costs rise under antimicrobial rules, volatile grain markets, and sustainability audits. Larger firms are positioned to absorb these pressures, while smaller players innovate in functional additives and digital solutions. Regional specialists defend share through tailored formulations and certifications, particularly in organic and non-GMO segments. The balance between global scale and regional specialization will define the competitive trajectory, blending consolidation with innovation across the sector.
Europe Precision Farming Industry Leaders
-
Deere & Company
-
CLAAS KGaA mbH
-
CNH Industrial N.V.
-
AGCO Corporation
-
Topcon Corporation
- *Disclaimer: Major Players sorted in no particular order
Need More Details on Market Players and Competitors?
Download PDF
Recent Industry Developments
- May 2025: Syngenta Group and Planet have recently renewed their partnership to deliver high-resolution satellite imagery for European crop monitoring. The expanded imagery pipeline boosts remote-sensing applications, drives software subscriptions, and enriches AI training data. Enhanced field-level insights reduce scouting time, improve ROI, and encourage adoption among growers.
- March 2025: Agmatix and BASF SE have introduced AI tools for early detection of soybean cyst nematodes, combining machine-learning algorithms with in-field datasets. This early-warning capability reduces treatment costs and yield losses, thereby enhancing the case for sensor networks. Initial success in soybeans opens doors for cross-crop adoption, expanding the software market.
- January 2025: Deere & Company unveiled autonomous machines at CES 2025 and partnered with Wiedenmann to expand its European reach. The technology offers significant labor savings, driving demand for retrofit kits among labor-constrained farms. The agreement aims to accelerate market penetration and boost sales in secondary markets.
Research Methodology Framework and Report Scope
Market Definitions and Key Coverage
Our study defines the Europe precision farming market as the sale and subscription value of digital-enabled agronomic hardware, software, and field services that help growers observe, measure, and act on within-field variability to optimize inputs and boost yields across open-field crops.
Scope exclusion: solutions dedicated solely to indoor/vertical farms, animal husbandry, or post-harvest processing are not included.
Segmentation Overview
-
By Technology
-
Guidance System
- GPS / GNSS
- GIS Decision-Support Platforms
- Remote Sensing (Satellite and Proximal)
-
Variable-Rate Technology
- Variable-Rate Fertilizer
- Variable-Rate Seeding
- Variable-Rate Pesticide
- Drones / UAV
- On-farm Edge Sensors and IoT Networks
- Other / Emerging Tech (Robotic Weeders, Digital Twins)
-
Guidance System
-
By Component
- Hardware
- Software
- Services
-
By Application
- Yield Monitoring
- Variable-Rate Application
- Field Mapping (GIS)
- Soil and Crop-Health Monitoring
- Crop Scouting and Pest Detection
- Farm Business and Compliance Management
-
By Farm Size
- Small-scale
- Medium-scale
- Large-scale
-
By Crop Type
- Cereals and Grains
- Oilseeds and Pulses
- Fruits and Vegetables
- Vineyards and Specialty Crops
- Others
-
By Geography
- Germany
- France
- United Kingdom
- Italy
- Spain
- Netherlands
- Poland
- Rest of Europe
Detailed Research Methodology and Data Validation
Primary Research
Conversations with agronomists, equipment distributors, farm cooperatives, and ag-tech start-ups across Germany, France, Italy, Spain, the UK, and Poland let us stress-test secondary findings. Executives confirmed realistic price bands, adoption hurdles for <100 ha farms, and plausible upgrade cycles, which our team used to fine-tune model assumptions.
Desk Research
Mordor analysts first map Europe's cropland, equipment density, and subsidy flows using tier-1 statistical portals such as Eurostat, FAOSTAT, and OECD Agri-environment indicators. They then cross-check machinery imports through UN Comtrade customs codes. We enrich the picture with regulatory texts from the European Commission (CAP strategic plans, Farm-to-Fork targets), peer-reviewed journals on sensor efficacy, and association data from CEMA and Copa-Cogeca that outline adoption curves for GPS, VRT, drones, and edge-IoT. Paid databases, such as Dow Jones Factiva for deal flow and D&B Hoovers for supplier revenues, help anchor company baselines. This sample list is illustrative; many additional open and paid sources were reviewed for validation.
A second pass screens press releases, investor decks, and patent filings to flag emerging technologies (e.g., autonomous weeders, digital twins) likely to shift spending over the forecast window.
Market-Sizing & Forecasting
The 2025 baseline starts with a top-down reconstruction: cultivated hectares × penetration of guidance/VRT/digital scouting × average spend per hectare, calibrated with Eurostat crop structure data. Select bottom-up checks, such as supplier revenue roll-ups and channel ASP × unit samples, verify and adjust totals before lock-in. Key variables tracked yearly include subsidy allocation under CAP Pillar II, sensor price erosion, broadband coverage in rural NUTS-3 regions, drone flight-hour costs, and fertilizer price indices. A multivariate regression fed into an ARIMA overlay produces the 2025-2030 trajectory, while scenario analysis captures weather and policy shocks. Data gaps in smaller economies are bridged by weighted proxies using comparable farm structures.
Data Validation & Update Cycle
Outputs pass a three-layer review: automated variance flags, peer analyst cross-checks, and a senior sign-off. Results are benchmarked against satellite-derived acreage trends and company earnings. Reports refresh annually, with mid-cycle updates if material policy or pricing swings occur.
Why Mordor's Europe Precision Farming Baseline Earns Decision-Maker Trust
Published values often diverge because studies adopt different crop mixes, include or exclude service revenues, and apply varied euro-to-dollar conversions.
Key gap drivers we observe are: some publishers fold livestock tech and smart greenhouses into their totals, others assume uniform per-hectare spend across farm sizes, while a few apply a single-digit CAGR from global figures without country-level penetration tests. Our disciplined scope, country granularity, and yearly refresh cadence minimize such skews.
Benchmark comparison
| Market Size | Anonymized source | Primary gap driver |
|---|---|---|
| USD 4.20 B (2025) | Mordor Intelligence | - |
| USD 4.80 B (2024) | Regional Consultancy A | Splits precision farming and services incompletely, limited country splits |
| USD 7.10 B (2025) | Industry Association B | Bundles smart livestock, greenhouse, and irrigation equipment into definition |
In sum, our transparent variable build-up, dual validation loops, and Europe-focused scope give stakeholders a balanced, reproducible baseline they can rely on when sizing opportunities or allocating resources.
Need A Different Region or Segment?
Customize Now
Key Questions Answered in the Report
What was the Europe precision farming market size in 2026?
It valued at USD 2.62 billion in 2026 with guidance systems and hardware dominating value.
How fast is the Europe precision farming market expected to grow by 2031?
The forecast calls for a 12.64% CAGR lifting value to USD 4.75 billion by 2031.
Which technology segment is expanding the quickest
Drones and unmanned aerial vehicles are advancing at a compound annual growth rate (CAGR) of 11.3%, aligned with harmonized European Union Aviation Safety Agency regulations.
Why is Poland the fastest growing geography?
European Union cohesion funds cover up to 70% of digital equipment costs and a younger operator base is more digitally inclined.
How do subsidies influence adoption?
Grants, tax credits, and insurance rebates can reimburse up to 70% of hardware outlay or deliver double-digit premium discounts, sharply improving payback.


