Market Overview
| Study Period | 2017 - 2030 |
|---|---|
| Forecast Data Period | 2025 - 2030 |
| Historical Data Period | 2017 - 2023 |
| Market Size (2025) | USD 3.92 Billion |
| Market Size (2030) | USD 4.94 Billion |
| Growth Rate (2025 - 2030) | 4.72% CAGR |
| Market Concentration | Low |
Major Players*Disclaimer: Major Players sorted in no particular order Image © Mordor Intelligence. Reuse requires attribution under CC BY 4.0. | |

Europe Plant Protein Ingredients Market Analysis by Mordor Intelligence
The Europe Plant Protein Ingredients Market size is estimated at 3.92 billion USD in 2025, and is expected to reach 4.94 billion USD by 2030, growing at a CAGR of 4.72% during the forecast period (2025-2030).
The European plant protein ingredients market is experiencing a significant transformation driven by changing consumer preferences and lifestyle choices. The industry has witnessed substantial investments in plant protein production capabilities, with companies like Lantmännen investing USD 91 million in a new large-scale pea protein production facility in Sweden in 2022. This shift is particularly evident among younger demographics, with approximately 60% of European millennials and Gen Z consumers actively seeking curated food experiences that combine nutrition and indulgence in 2022. The market's evolution is further supported by strategic initiatives like Donau Soja's Protein Strategy for Europe in 2023, which aims to improve the availability and sustainability of plant-based protein ingredients across the region.
The market is witnessing a notable surge in product innovation and diversification across various applications. Manufacturers are increasingly focusing on developing clean-label products with improved taste profiles and functionality to meet consumer demands. This trend is particularly strong in the snacking segment, where approximately 64% of UK consumers under the age of 20 years regularly snack between meals, compared to 58.7% in Germany and 53% in France. The industry is also seeing significant advancements in protein ingredients extraction technologies and processing methods, leading to improved product quality and wider applications.
Consumer awareness and adoption of plant-based diets continue to drive market growth, with Germany leading the vegetarian movement in Europe. The country reported approximately 1.5 million vegans in 2022, representing one of the highest rates of vegetarianism compared to its European neighbors. This trend is spreading across other European nations, with Turkey, for instance, recording around 100,000 new vegan consumers in 2022. The market is responding to this shift with increased product launches and innovations in alternative protein and dairy alternatives.
The industry is experiencing a notable shift towards sustainable and locally sourced ingredients, with companies investing in regional production capabilities to reduce dependency on imports. This transformation is accompanied by technological advancements in protein extraction and processing methods, leading to improved product quality and functionality. Companies are also focusing on developing specialized ingredients for specific applications, particularly in the sports nutrition and functional food segments, where the demand for alternative protein continues to grow. The market is seeing increased collaboration between ingredient manufacturers and food companies to develop innovative applications and improve product formulations.
Europe Plant Protein Ingredients Market Trends and Insights
The growth in plant protein consumption provides opportunities for key players in the market
- The graph given depicts the per capita consumption of plant protein in all the countries of Europe. The consumer shift toward vegan diets majorly drives the market. The functional efficiency and cost competitiveness offered by reliable plant protein products are increasing their utilization in a wide variety of processed foods. Plant protein from soy is considered healthy for all age groups and helps keep the body fit. Plant-based protein alternatives are being widely used in the food and beverage industry.
- The region has untapped potential among consumers willing to switch their diets to plant-based protein sources. For instance, within four years, the number of vegans doubled from 1.3 million in 2016 to 2.6 million in 2020. However, the market faces challenges, such as a lack of innovation and restrictions on public policy. There are still a few aspects holding back Italian consumers from making the shift, such as the possible presence of GMOs, doubts over the origin of raw materials used in the product's composition, and the possible use of herbicides on crops.
- Plant protein enhances food items' nutritional and functional values and provides good taste. The market observed an increase of around 45-50% in the consumption of plant-based food across the region. For instance, Bolthouse Farms expanded its beverage range with the "1915 Organic" brand line, which includes cold-pressed juices and vegan protein shakes. Also, protein manufacturers are trying to initiate strategic programs that will impact the improvement of consumption of plant protein sources such as soy protein in the region. For instance, Donau Soja developed a Protein Strategy for Europe in 2023, impacting the availability of soybeans in the region.


Europe is focusing on increasing the production of soy, wheat, and pea
- The graph given depicts the production of dry peas, rice, soybeans, and wheat, raw materials considered for the market. Total grain production in countries like Germany reached 45.7 million ton during 2019-2020, up from 37.9 million ton during 2018-2019. Wheat production for 2019-2020 reached 24.2 million ton, up from 20.3 million ton. However, the United Kingdom is the key producer of wheat and dry peas. In 2019, the country's wheat production amounted to 16.2 million tons, rising by 19.70%, i.e., 2.7 million tons by volume, over the previous year, owing to regular rainfall and a temperate climate.
- Italy is a key producer of distinct plant protein commodities, mainly wheat, followed by rice, soybean, and peas. Italy is the EU's biggest producer of soy and the biggest producer of rice. The country mainly produces Japonica rice. In 2019, Japonica production reached nearly 1.1 million ton, while less than 400,000 ton of Indica varieties were produced. This implied a total milled rice volume of approximately 900,000 ton. Carnaroli, Arborio, Roma, S.Andrea, Baldo, Vialone Nano, and Balilla are among the main varieties.
- Wheat exports amounted to 5.2 million ton, with imports at 3.7 million ton. Plant protein commodities grown in France include wheat, peas, rice, and soybeans. France produced 40,604,960 ton of wheat in 2019. Volume fluctuations in wheat production are caused by bad weather and pest infestation. In contrast, in 2020, France's wheat production was hampered by heavy rains in the fall of 2019, which delayed planting, a mild winter that resulted in an aphid infestation, and a dry spring that caused moisture stress.

OTHER KEY INDUSTRY TRENDS COVERED IN THE REPORT
- Market maturation and declining birth rates are accountable for the slow growth rate
- Healthy trends in beverages impacting market growth
- Consumers' preferences shift to premium condiments and sauces, away from packaged soups
- Dairy alternatives to witness significant growth rate
- Innovations in product formulations have a greater scope in the market
- Healthier snacking is likely to boost the market
- Increased meat production is expected to push the market's growth
- Stronghold of the retail sector is supporting market growth
- Sustainable and innovative packaging trends to influence the breakfast cereals market
- Innovation in chocolates is driving sales
- The growing demand for nutrition-specific diets may drive market demand
- Single-head households to drive the RTE/RTC market
- The expanding consumer base may benefit the sports supplements segment
- Natural and organic products are taking over the market
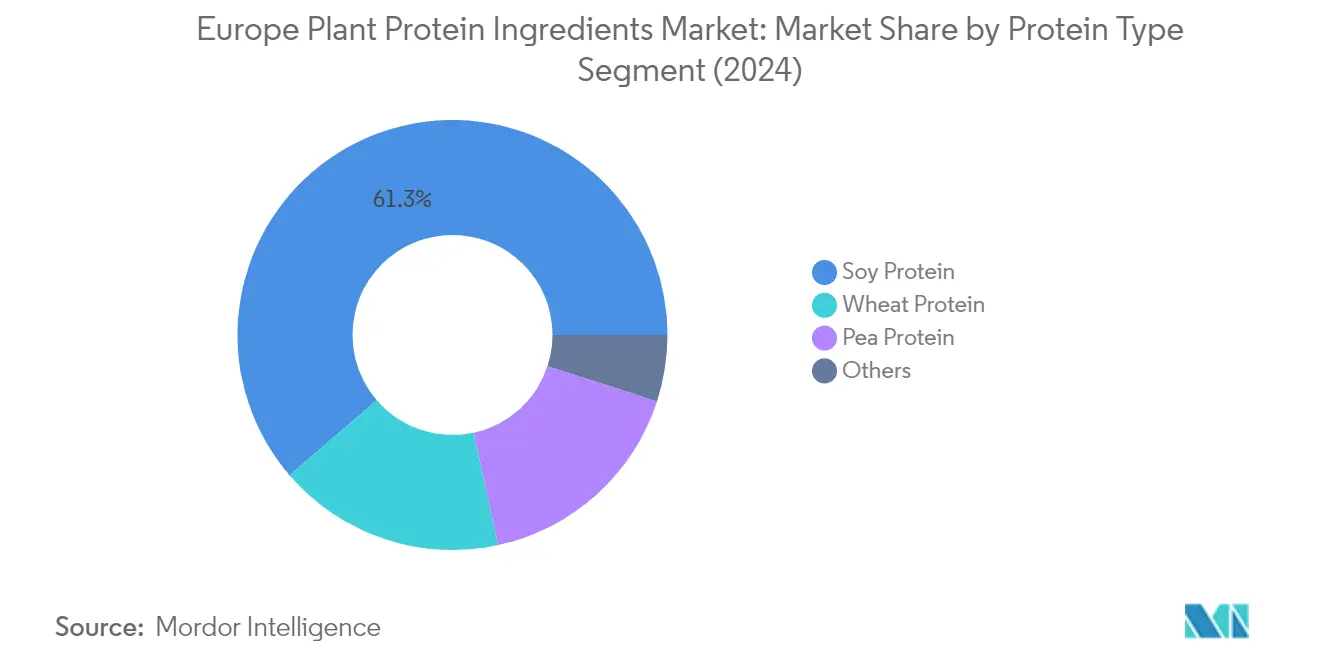
Segment Analysis: Protein Type
Soy Protein Segment in Europe Plant Protein Ingredients Market
Soy protein dominates the European plant protein ingredients market, commanding approximately 61% market share in 2024. The segment's dominance is primarily attributed to its extensive applications across various end-user industries, particularly in the meat and dairy alternatives sector. The ingredient's superior functionalities, including high protein content, low viscosity, and excellent solubility, make it a preferred choice among manufacturers. Additionally, the cost-effectiveness of soy protein ingredients compared to other plant proteins and its ability to enhance products' nutritional profiles have strengthened its market position. The segment's growth is further supported by the increasing adoption of soy protein in animal feed applications, where it serves as a sustainable and protein-rich alternative to traditional feed ingredients.

Pea Protein Segment in Europe Plant Protein Ingredients Market
The pea protein ingredients segment is experiencing remarkable growth in the European market, projected to expand at approximately 9% CAGR from 2024 to 2029. This growth is primarily driven by increasing consumer preference for clean label protein alternatives. Pea protein's versatility in applications, particularly in meat alternatives, sports nutrition, and bakery products, is fueling its adoption. The ingredient's quick rehydration properties, neutral taste profile, and superior texturizing capabilities make it particularly suitable for plant-based meat applications. European manufacturers are increasingly investing in pea protein production facilities and developing innovative applications, further accelerating segment growth.
Remaining Segments in Protein Type
The European plant protein ingredients market encompasses several other significant segments, including wheat protein, rice protein, hemp protein, and potato protein. Wheat protein has established a strong presence in bakery applications due to its unique gluten content and dough-binding properties. Rice protein is gaining traction in sports nutrition and personal care applications owing to its hypoallergenic properties. Hemp protein, though a niche segment, is attracting attention for its complete amino acid profile and sustainability credentials. Potato protein, while smaller in market share, is finding applications in specialized food formulations and animal feed. Each of these segments contributes to the market's diversity and caters to specific consumer preferences and application requirements.
Segment Analysis: End User
Food & Beverages Segment in Europe Plant Protein Ingredients Market
The Food & Beverages (F&B) segment dominates the European plant protein ingredients market, commanding approximately 52% market share in 2024. This significant market position is primarily driven by the meat/poultry/seafood and meat alternative products sub-segment, followed by dairy and dairy alternative products. The growing awareness of health risks associated with meat consumption and the expanding availability of plant-based protein substitutes across European distribution centers has fueled this segment's dominance. The segment's growth is further supported by increasing consumer knowledge about protein functionalities and rising awareness about protein-rich diets. Manufacturers are actively innovating to address the sensory challenges in emerging alternative applications, particularly in meat and dairy substitutes, which has helped maintain the segment's market leadership.
Supplements Segment in Europe Plant Protein Ingredients Market
The supplements segment is emerging as the fastest-growing category in the European plant protein ingredients market, projected to achieve a growth rate of approximately 7% during 2024-2029. This remarkable growth is primarily driven by the sports and performance nutrition sub-segment, reflecting the increasing popularity of bodybuilding and muscle development activities across Europe. The segment's expansion is further supported by growing consumer awareness of plant protein benefits and the rising preference for plant-based alternatives over traditional protein sources. Market players are innovating on sensory profiles to make plant proteins more acceptable, particularly targeting higher dosages (40g/day or more) to replicate the fitness benefits of traditional protein supplements. The segment's growth is also bolstered by the increasing number of consumers seeking sustainable and vegan-friendly protein supplements.
Remaining Segments in End User Segmentation
The animal feed and personal care & cosmetics segments complete the market landscape for plant protein ingredients in Europe. The animal feed segment maintains a substantial presence in the market, driven by the increasing demand for high-quality protein sources in livestock nutrition and the growing trend toward sustainable feed solutions. Meanwhile, the personal care & cosmetics segment, though smaller in market share, is gaining traction due to the rising demand for natural and vegan beauty products. Both segments benefit from ongoing innovations in protein extraction technologies and increasing consumer preference for sustainable and plant-based alternatives across all application areas. The segments are further supported by stringent regulations promoting sustainable practices and growing awareness about animal welfare concerns.
Europe Plant Protein Ingredients Market Geography Segment Analysis
Plant Protein Ingredients Market in Russia
Russia dominates the European plant protein ingredients market, commanding approximately 16% of the total market volume in 2024. The country's market leadership is primarily driven by its food and beverage sector orientation, with a strong focus on meat and dairy alternatives. The market benefits from the increasing consumer acceptance of plant-based proteins, particularly among high-income consumers. Russian manufacturers are actively expanding their product portfolios, with companies like Maysoet, Okraina, and Kotletar boosting their offerings in meat and dairy alternatives. The country's strategic position in agricultural production and processing capabilities further strengthens its market dominance. The integration of plant proteins in various food applications continues to evolve, supported by robust distribution networks and increasing consumer awareness about health and sustainability benefits. Additionally, the market is witnessing significant investments in research and development, focusing on improving protein extraction techniques and developing innovative applications.
Plant Protein Ingredients Market in France
France is emerging as the most dynamic market in Europe, projected to grow at approximately 5.5% annually from 2024 to 2029. The French market is experiencing a transformative phase driven by significant investments from agri-food corporations like Beyond Meat Inc., HappyVore, and Maple Leaf Foods. The country's strategic focus on domestic production for both feed and human nutrition is reshaping the market landscape, aiming to boost agri-food sovereignty and sustainability. French consumers are increasingly embracing plant-based alternatives, with the food and beverage segment leading market applications. The market is characterized by innovative product development and strategic partnerships between suppliers of plant protein and food companies. Local research institutions are actively involved in developing new protein extraction technologies and applications, particularly in the meat alternative sector. The country's strong agricultural foundation and technical expertise in food processing provide a robust platform for market expansion. Furthermore, France's commitment to sustainable agriculture and protein independence is driving investments in local protein production capabilities.
Plant Protein Ingredients Market in Germany
Germany stands as a pivotal market in Europe's plant protein landscape, driven by its strong environmental consciousness and high rate of vegetarianism compared to its European neighbors. The country's market is characterized by sophisticated consumer preferences and a well-developed food processing industry. German manufacturers are at the forefront of innovation in plant-based products, particularly in meat alternatives and dairy substitutes. The market benefits from strong research and development capabilities, with numerous institutions focusing on improving protein functionality and application versatility. The country's robust distribution infrastructure and well-established retail networks facilitate efficient market penetration of plant protein ingredients products. Additionally, German consumers' increasing preference for sustainable and healthier food options continues to drive market growth, particularly among younger demographics who are more likely to embrace plant-based alternatives. The market also benefits from strong government support for sustainable food production and consumption patterns.
Plant Protein Ingredients Market in United Kingdom
The United Kingdom's plant protein market demonstrates strong potential, supported by evolving consumer preferences and innovative product developments. The market is characterized by high consumer awareness and acceptance of plant-based products, particularly among urban populations. British retailers are actively expanding their plant-based offerings, with major supermarket chains developing private-label plant protein products. The country's food industry is investing significantly in research and development to improve the taste and texture of plant-based products. The market benefits from strong collaboration between food manufacturers and suppliers of plant protein, leading to innovative product launches. Consumer demand is particularly strong in the sports nutrition and meat alternative segments, driven by health and environmental concerns. The UK market also shows significant growth in the foodservice sector, with restaurants and fast-food chains increasingly incorporating plant-based options in their menus. Additionally, the country's strong focus on food innovation and product development continues to drive market expansion.
Plant Protein Ingredients Market in Other Countries
The plant protein ingredients market in other European countries, including Spain, Italy, Belgium, Netherlands, Turkey, and other nations, exhibits diverse growth patterns and market characteristics. These markets are characterized by varying levels of consumer acceptance and market maturity. Southern European countries are witnessing increasing adoption of plant-based proteins, particularly in traditional food applications. Nordic countries demonstrate strong environmental consciousness driving market growth. Eastern European markets are gradually embracing plant-based alternatives, with growing health awareness among consumers. These markets benefit from knowledge transfer and technological advancements from larger markets, while developing their unique applications based on local preferences and food traditions. The diversity in food cultures across these countries creates opportunities for specialized product development and market expansion. Additionally, these markets are seeing increased investment in local production capabilities and distribution networks, supporting overall market growth in the region.

Competitive Landscape
Top Companies in Europe Plant Protein Ingredients Market
The leading companies in the European plant protein ingredients market are actively pursuing growth through multiple strategic initiatives. Product innovation remains a key focus area, with companies developing novel protein variants and improving existing formulations to meet evolving consumer preferences for clean-label, sustainable options. Operational agility is demonstrated through investments in advanced plant-based protein manufacturing capabilities and supply chain optimization to ensure consistent product quality and availability. Strategic partnerships and collaborations, particularly with ingredient suppliers and food manufacturers, have become increasingly common to strengthen market presence. Geographic expansion through new production facilities and distribution networks, especially in high-growth regions, continues to be prioritized alongside sustainability commitments and certifications to align with market demands.
Consolidated Market Led By Global Players
The European plant protein ingredients market exhibits a relatively consolidated structure dominated by large multinational corporations with diverse product portfolios. These established players leverage their extensive R&D capabilities, global supply networks, and strong financial positions to maintain market leadership. Local specialists and regional players maintain a significant presence in specific geographic markets or product niches, particularly in specialized protein variants and application-specific solutions. The market has witnessed increased participation from agricultural cooperatives and ingredient specialists who bring unique capabilities in sourcing and processing.
Merger and acquisition activity has been particularly robust, driven by larger companies seeking to expand their plant-based protein manufacturing capabilities and geographic reach. Strategic acquisitions focus on companies with complementary technologies, unique protein extraction processes, or a strong regional presence. Vertical integration has emerged as a key trend, with companies acquiring capabilities across the value chain from raw material sourcing to final product manufacturing. Joint ventures and strategic alliances are increasingly common, particularly in developing new protein sources and expanding production capacity.
Innovation and Sustainability Drive Future Success
For incumbent players to maintain and expand their market position, focus must be placed on continuous innovation in protein extraction technologies and product formulations. Investment in sustainable sourcing practices and transparent supply chains has become crucial for long-term success. Companies need to develop strong relationships with agricultural producers and invest in backward integration to ensure consistent raw material supply. Building comprehensive product portfolios that address various application needs while maintaining cost competitiveness will be essential for market leadership.
New entrants and challenger brands can gain market share by focusing on specialized market segments and innovative protein sources. Success factors include developing unique value propositions around sustainability, transparency, and local sourcing. Companies must navigate increasing regulatory scrutiny around protein quality standards and environmental impact while addressing growing end-user demands for clean-label products. Building strong relationships with food manufacturers and investing in application development support will be crucial for market penetration. The ability to scale production while maintaining product consistency and managing cost pressures will determine long-term success in this evolving market. Additionally, the integration of meat alternative ingredients and dairy alternative ingredients into product lines can provide a competitive edge for companies looking to diversify their offerings.
Europe Plant Protein Ingredients Industry Leaders
Archer Daniels Midland Company
Ingredion Incorporated
International Flavors & Fragrances Inc.
Kerry Group PLC
Südzucker AG
- *Disclaimer: Major Players sorted in no particular order


Recent Industry Developments
- June 2022: Roquette, a plant-based protein manufacturer, released two novel rice proteins to address the market demand for meat substitute applications. The new Nutralys rice protein line includes a rice protein isolate and a rice protein concentrate.
- May 2022: BENEO, a subsidiary of Südzucker, entered a purchase agreement to acquire Meatless BV, a producer of functional ingredients. BENEO is expanding its existing product offering with the acquisition to offer an even broader range of texturizing solutions for meat and fish alternatives.
- May 2021: Lantmannen's subsidiary, Lantmännen Agroetanol, invested SEK 800 million in a biorefinery in Norrköping. It will strengthen Lantmännen’s position in the market for grain-based food ingredients, specifically gluten production. The new production line is planned to be fully operational during the second quarter of 2023.


Europe Plant Protein Ingredients Market Report Scope
Hemp Protein, Pea Protein, Potato Protein, Rice Protein, Soy Protein, Wheat Protein are covered as segments by Protein Type. Animal Feed, Food and Beverages, Personal Care and Cosmetics, Supplements are covered as segments by End User. Belgium, France, Germany, Italy, Netherlands, Russia, Spain, Turkey, United Kingdom are covered as segments by Country.Protein Type
| Hemp Protein |
| Pea Protein |
| Potato Protein |
| Rice Protein |
| Soy Protein |
| Wheat Protein |
| Other Plant Protein |
End User
| Animal Feed | ||
| Food and Beverages | By Sub End User | Bakery |
| Beverages | ||
| Breakfast Cereals | ||
| Condiments/Sauces | ||
| Confectionery | ||
| Dairy and Dairy Alternative Products | ||
| Meat/Poultry/Seafood and Meat Alternative Products | ||
| RTE/RTC Food Products | ||
| Snacks | ||
| Personal Care and Cosmetics | ||
| Supplements | By Sub End User | Baby Food and Infant Formula |
| Elderly Nutrition and Medical Nutrition | ||
| Sport/Performance Nutrition | ||
Country
| Belgium |
| France |
| Germany |
| Italy |
| Netherlands |
| Russia |
| Spain |
| Turkey |
| United Kingdom |
| Rest of Europe |
| Protein Type | Hemp Protein | ||
| Pea Protein | |||
| Potato Protein | |||
| Rice Protein | |||
| Soy Protein | |||
| Wheat Protein | |||
| Other Plant Protein | |||
| End User | Animal Feed | ||
| Food and Beverages | By Sub End User | Bakery | |
| Beverages | |||
| Breakfast Cereals | |||
| Condiments/Sauces | |||
| Confectionery | |||
| Dairy and Dairy Alternative Products | |||
| Meat/Poultry/Seafood and Meat Alternative Products | |||
| RTE/RTC Food Products | |||
| Snacks | |||
| Personal Care and Cosmetics | |||
| Supplements | By Sub End User | Baby Food and Infant Formula | |
| Elderly Nutrition and Medical Nutrition | |||
| Sport/Performance Nutrition | |||
| Country | Belgium | ||
| France | |||
| Germany | |||
| Italy | |||
| Netherlands | |||
| Russia | |||
| Spain | |||
| Turkey | |||
| United Kingdom | |||
| Rest of Europe | |||


Market Definition
- End User - The Protein Ingredients Market operates on a B2B basis. Food, Beverages, Supplements, Animal Feed, and Personal Care & Cosmetic manufacturers are considered to be end-consumers in the market studied. The scope excludes manufacturers buying liquid/dry whey to be used for application as a binding agent or thickener or other non-protein applications.
- Penetration Rate - Penetration Rate is defined as the percentage of Protein-Fortified End User Market Volume in the Overall End User Market Volume.
- Average Protein Content - Average protein content is the average protein content present per 100 g of product manufactured by all end-user companies considered under the scope of this report.
- End User Market Volume - End-user market volume is the consolidated volume of all types and forms of end-user products in the country or region.
| Keyword | Definition |
|---|---|
| Alpha-lactalbumin (α-Lactalbumin) | It is a protein that regulates the production of lactose in the milk of almost all mammalian species. |
| Amino acid | It is an organic compound that contains both amino and carboxylic acid functional groups, which are required for the synthesis of body protein and other important nitrogen-containing compounds, such as creatine, peptide hormones, and some neurotransmitters. |
| Blanching | It is the process of briefly heating vegetables with steam or boiling water. |
| BRC | British Retail Consortium |
| Bread improver | It is a flour-based blend of several components with specific functional properties designed to modify dough characteristics and give quality attributes to bread. |
| BSF | Black Soldier Fly |
| Caseinate | It is a substance produced by adding an alkali to acid casein, a derivative of casein. |
| Celiac disease | Celiac disease is an immune reaction to eating gluten, a protein found in wheat, barley, and rye. |
| Colostrum | It is a milky fluid that’s released by mammals that have recently given birth before breast milk production begins. |
| Concentrate | It is the least processed form of protein and has a protein content ranging from 40-90% by weight. |
| Dry protein basis | It refers to the percentage of "pure protein" present in a supplement after the water in it is completely removed through heat. |
| Dry whey | It is the product resulting from drying fresh whey which has been pasteurized and to which nothing has been added as a preservative. |
| Egg protein | It is a mixture of individual proteins, including ovalbumin, ovomucoid, ovoglobulin, conalbumin, vitellin, and vitellenin. |
| Emulsifier | It is a food additive that facilitates the blending of foods that are immiscible with one another, such as oil and water. |
| Enrichment | It is the process of addition of micronutrients that are lost during the processing of the product. |
| ERS | Economic Research Service of the USDA |
| Extrusion | It is the process of forcing soft mixed ingredients through an opening in a perforated plate or die designed to produce the required shape. The extruded food is then cut to a specific size by blades. |
| Fava | Also known as Faba, it is another word for yellow split beans. |
| FDA | Food and Drug Administration |
| Flaking | It is a process in which typically a cereal grain (like corn, wheat, or rice) is broken down into grits, cooked with flavors and syrups, and then pressed into flakes between cooled rollers. |
| Foaming agent | It is a food ingredient that makes it possible to form or maintain a uniform dispersion of a gaseous phase in a liquid or solid food. |
| Foodservice | It refers to the part of the food industry which includes businesses, institutions, and companies which prepare meals outside the home. It includes restaurants, school and hospital cafeterias, catering operations, and many other formats. |
| Fortification | It is the deliberate addition of micronutrients that are not found in them naturally or which are lost during processing, to improve a food product's nutritional value. |
| FSANZ | Food Standards Australia New Zealand |
| FSIS | Food Safety and Inspection Service |
| FSSAI | Food Safety and Standards Authority of India |
| Gelling agent | It is an ingredient that functions as a stabilizer and thickener to provide thickening without stiffness through the formation of gel. |
| GHG | Greenhouse Gas |
| Gluten | It is a family of proteins found in grains, including wheat, rye, spelt, and barley. |
| Hemp | It is a botanical class of Cannabis sativa cultivars grown specifically for industrial or medicinal use. |
| Hydrolysate | It is a form of protein manufactured by exposing the protein to enzymes that can partially break the bonds between the protein's amino acids and break down large, complicated proteins into smaller pieces. Its processing makes it easier and quicker to digest. |
| Hypoallergenic | It refers to a substance that causes fewer allergic reactions. |
| Isolate | It is the purest and most processed form of protein which has undergone separation to obtain a pure protein fraction. It typically contains ≥ 90% of protein by weight. |
| Keratin | It is a protein that helps form hair, nails, and the outer layer of skin. |
| Lactalbumin | It is the albumin contained in milk and obtained from whey. |
| Lactoferrin | It is an iron‑binding glycoprotein that is present in the milk of most mammals. |
| Lupin | It is the yellow legume seeds of the genus Lupinus. |
| Millenial | Also known as Generation Y or Gen Y, it refers to the people born from 1981 to 1996. |
| Monogastric | It refers to an animal with a single-compartmented stomach. Examples of monogastric include humans, poultry, pigs, horses, rabbits, dogs, and cats. Most monogastric are generally unable to digest much cellulose food materials such as grasses. |
| MPC | Milk protein concentrate |
| MPI | Milk protein isolate |
| MSPI | Methylated soy protein isolate |
| Mycoprotein | Mycoprotein is a form of single-cell protein, also known as fungal protein, derived from fungi for human consumption. |
| Nutricosmetics | It is a category of products and ingredients that act as nutritional supplements to care for skin, nails, and hair natural beauty. |
| Osteoporosis | It is a medical condition in which the bones become brittle and fragile from loss of tissue, typically as a result of hormonal changes, or deficiency of calcium or vitamin D. |
| PDCAAS | Protein digestibility-corrected amino acid score (PDCAAS) is a method of evaluating the quality of a protein based on both the amino acid requirements of humans and their ability to digest it. |
| Per-capita consumption of animal protein | It is the average amount of animal protein (such as milk, whey, gelatin, collagen, and egg proteins) that is readily available for consumption by each person in an actual population. |
| Per-capita consumption of plant protein | It is the average amount of plant protein (such as soy, wheat, pea, oat, and hemp proteins) that is readily available for consumption by each person in an actual population. |
| Quorn | It is a microbial protein manufactured using mycoprotein as an ingredient, in which the fungus culture is dried and mixed with egg albumen or potato protein, which acts as a binder, and then is adjusted in texture and pressed into various forms. |
| Ready-to-Cook (RTC) | It refers to food products that include all of the ingredients, where some preparation or cooking is required through a process that is given on the package. |
| Ready-to-Eat (RTE) | It refers to a food product prepared or cooked in advance, with no further cooking or preparation required before being eaten. |
| RTD | Ready-to-Drink |
| RTS | Ready-to-Serve |
| Saturated fat | It is a type of fat in which the fatty acid chains have all single bonds. It is generally considered unhealthy. |
| Sausage | It is a meat product made of finely chopped and seasoned meat, which may be fresh, smoked, or pickled and which is then usually stuffed into a casing. |
| Seitan | It is a plant-based meat substitute made out of wheat gluten. |
| Softgel | It is a gelatin-based capsule with a liquid fill. |
| SPC | Soy protein concentrate |
| SPI | Soy protein isolate |
| Spirulina | It is a biomass of cyanobacteria that can be consumed by humans and animals. |
| Stabilizer | It is an ingredient added to food products to help maintain or enhance their original texture, and physical and chemical characteristics. |
| Supplementation | It is the consumption or provision of concentrated sources of nutrients or other substances that are intended to supplement nutrients in the diet and is intended to correct nutritional deficiencies. |
| Texturant | It is a specific type of food ingredient that is used to control and alter the mouthfeel and texture of food and beverage products. |
| Thickener | It is an ingredient that is used to increase the viscosity of a liquid or dough and make it thicker, without substantially changing its other properties. |
| Trans fat | Also called trans-unsaturated fatty acids or trans fatty acids, it is a type of unsaturated fat that naturally occurs in small amounts in meat. |
| TSP | Textured soy protein |
| TVP | Textured vegetable protein |
| WPC | Whey protein concentrate |
| WPI | Whey protein isolate |


Research Methodology
Mordor Intelligence follows a four-step methodology in all our reports.
- Step-1: Identify Key Variables: The quantifiable key variables (industry and extraneous) pertaining to the specific product segment and country are selected from a group of relevant variables & factors based on desk research & literature review; along with primary expert inputs. These variables are further confirmed through regression modeling (wherever required).
- Step-2: Build a Market Model: In order to build a robust forecasting methodology, the variables and factors identified in Step-1 are tested against available historical market numbers. Through an iterative process, the variables required for market forecast are set and the model is built on the basis of these variables.
- Step-3: Validate and Finalize: In this important step, all market numbers, variables and analyst calls are validated through an extensive network of primary research experts from the market studied. The respondents are selected across levels and functions to generate a holistic picture of the market studied.
- Step-4: Research Outputs: Syndicated Reports, Custom Consulting Assignments, Databases & Subscription Platforms


