Europe Pet Treats Market Size and Share
Market Overview
| Study Period | 2017 - 2030 |
|---|---|
| Forecast Data Period | 2025 - 2030 |
| Historical Data Period | 2017 - 2023 |
| Market Size (2025) | USD 10.17 Billion |
| Market Size (2030) | USD 14.03 Billion |
| Growth Rate (2025 - 2030) | 6.65% CAGR |
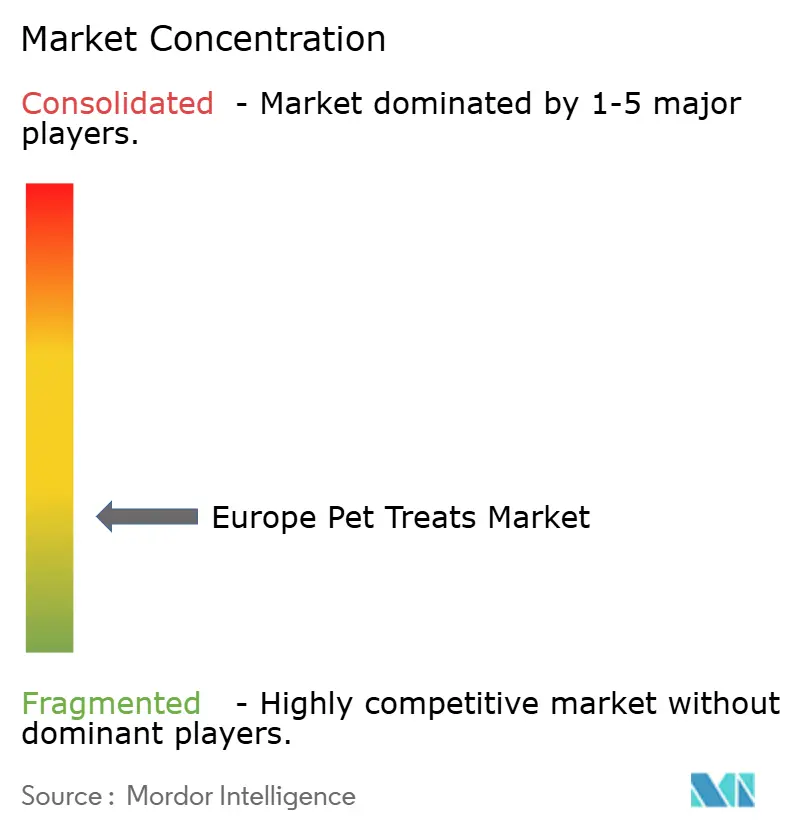
| Market Concentration | Low |
Major Players *Disclaimer: Major Players sorted in no particular order Image © Mordor Intelligence. Reuse requires attribution under CC BY 4.0. | |

Europe Pet Treats Market Analysis by Mordor Intelligence
The Europe pet treat market size stood at USD 10.17 billion in 2025 and is projected to expand at a 6.65% CAGR, reaching the value of USD 14.03 billion by 2030. Behind this trajectory are strong pet-humanization trends, premiumization that lifts average selling prices, and an expanding direct-to-consumer base that values ingredient transparency. Owners now treat snacks as daily wellness tools, which supports steady volume gains even when unit prices rise. Manufacturers continue to bring human-grade and novel protein recipes to market, raising product differentiation and fueling the Europe pet treat market growth curve. Parallel regulatory updates foster safe innovation and favor brands that invest in ISO 22000 facilities and traceable supply chains.
Key Report Takeaways
- By sub-product, crunchy treats led with 23.9% of the Europe pet treat market share in 2024, while freeze-dried and jerky treats are advancing at a 7.8% CAGR through 2030.
- By pets, dogs commanded 48.4% share of the Europe pet treat market size in 2024, cats post the fastest growth at a 7.0% CAGR to 2030.
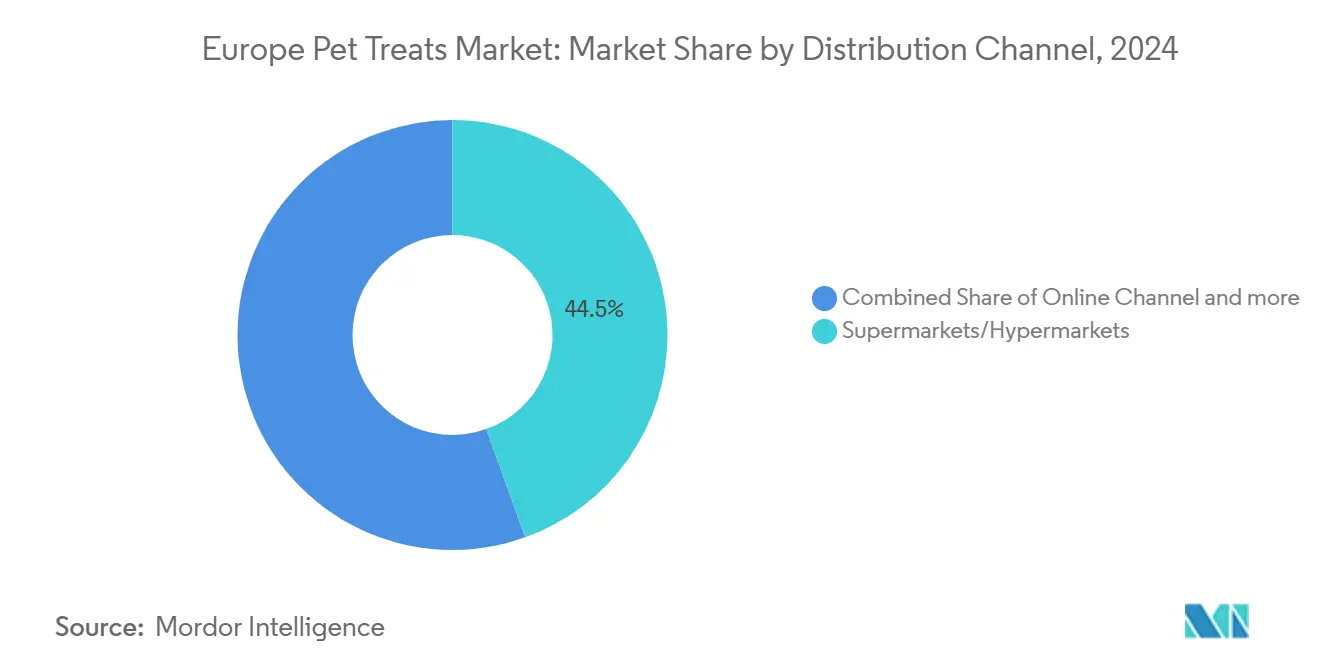
- By distribution channel, supermarkets and hypermarkets held 44.5% revenue share in 2024, whereas online sales are climbing at a 7.8% CAGR through 2030.
- By geography, Russia captured 20.1% share of the Europe pet treat market in 2024, while Germany records the highest projected CAGR at 7.6% during 2030.
- The European pet food and treats market exhibits a fragmented competitive landscape with a mix of global multinational corporations and regional specialists, including Mars, Incorporated, Colgate-Palmolive Company (Hill's Pet Nutrition, Inc.), Nestle (Purina), Affinity Petcare S.A , and VAFO Group a.s. has accounted for 25.8% of market share in 2024.
Europe Pet Treats Market Trends and Insights
Drivers Impact Analysis*
| Driver | (~) % Impact on CAGR Forecast | Geographic Relevance | Impact Timeline |
|---|---|---|---|
| Premiumization of treats | +1.8% | Western Europe | Medium term (2-4 years) |
| Human-grade ingredient adoption | +1.5% | Germany, France, and Netherlands | Medium term (2-4 years) |
| E-commerce penetration in pet care | +1.2% | All Europe | Short term (≤ 2 years) |
| Veterinary endorsement of functional treats | +0.9% | Germany, United Kingdom, and Nordics | Long term (≥ 4 years) |
| Upcycling of meat co-products into treats | +0.7% | Nordics, and Benelux | Long term (≥ 4 years) |
| Expansion of insect protein supply chains | +0.4% | France, Spain, and Netherlands | Long term (≥ 4 years) |
| Source: Mordor Intelligence | |||


Premiumization of Treats
European pet owners are fundamentally redefining treat purchasing criteria, with 67% prioritizing ingredient transparency over price considerations in 2024 purchasing surveys.This shift has enabled manufacturers to command average selling price increases of 12-18% annually while maintaining volume growth, as consumers associate higher prices with superior nutritional value and safety standards. The premiumization wave extends beyond ingredient quality to packaging innovations, with recyclable and biodegradable materials becoming standard requirements for products targeting the EUR 8-15 per kilogram price segment. Premiumization also rewards investments in advanced cooking and freeze-drying lines that lock in nutrient density. Category leaders divert R&D into functional toppings, enabling multi-benefit claims that protect margins and raise repeat purchase rates within the Europe pet treat market [1]Source: European Pet Food Industry Federation, “European Facts and Figures 2025,” fediaf.org.
Human-Grade Ingredient Adoption
The adoption of human-grade ingredients has transcended marketing positioning to become a fundamental manufacturing requirement, with 40% of new European treat launches in 2024 featuring HACCP-certified production facilities previously reserved for human food processing. Partnerships with organic meat suppliers secure uninterrupted flow of premium raw materials. Europe guidance on acceptable daily intakes permits more precise health statements, which in turn move products into higher price tiers. The result is a virtuous cycle of better safety perception, stronger brand equity, and rising Europe pet treat market demand among affluent households. Supply chain partnerships with human food suppliers have become strategic imperatives, with companies like Affinity Petcare securing long-term contracts with organic meat processors to ensure consistent ingredient availability and quality standards.
E-commerce Penetration in Pet Care
Online channels captured 35% of Western Europe treat sales in 2024. Germany leads with 42% penetration as subscription models deliver tailored boxes and auto-replenishment savings. Digital-native brands such as Edgard and Cooper match algorithms with veterinarian chat services to command 25–40% price premiums. Revised EU distance-selling rules create frictionless cross-border fulfillment, letting small labels tap 27 markets from a single hub. Consolidated marketplaces like Zooplus host 2,400 sellers, dropping per-order logistics cost by almost one-fifth and supporting widespread availability of niche SKUs within the Europe pet treat market. The regulatory environment supports this growth through updated distance selling regulations that streamline cross-border transactions and establish clear liability frameworks for online pet food retailers.
Veterinary endorsement of functional treats
Veterinary clinics have emerged as influential distribution channels for functional treats, with 34% of European veterinarians actively recommending specific brands for dental health and weight management applications in 2024. This professional endorsement has enabled manufacturers to establish premium pricing for veterinary-exclusive formulations, with products like Hill's Prescription Diet treats commanding 40-60% higher margins than retail equivalents while maintaining strong volume growth through professional recommendations. The regulatory framework supporting veterinary distribution includes updated guidelines from the European Medicines Agency that clarify the distinction between therapeutic feeds and conventional treats, enabling veterinarians to make specific health claims when recommending products to pet owners.
Restraints Impact Analysis*
| Restraint | (~) % Impact on CAGR Forecast | Geographic Relevance | Impact Timeline |
|---|---|---|---|
| Rising raw-material price volatility | -1.2% | All Europe | Short term (≤ 2 years) |
| Stricter European feed additive regulations | -0.8% | Europe Union -27 | Medium term (2-4 years) |
| Growing scrutiny of ultra-processed foods | -0.5% | Germany, France, and United Kingdom | Medium term (2-4 years) |
| Supply risk from African Swine Fever spillover | -0.3% | Eastern Europe | Short term (≤ 2 years) |
| Source: Mordor Intelligence | |||
Rising Raw-Material Price Volatility
European pet treat manufacturers face unprecedented input cost volatility, with wheat prices fluctuating 25% and meat ingredient costs varying 15-20% annually due to climate disruptions, energy price spikes, and supply chain bottlenecks[2]Source: European Food Safety Authority, “Feed Additives and Animal Nutrition,” efsa.europa.eu. This volatility has compressed gross margins by 3-5 percentage points across the industry, forcing manufacturers to implement dynamic pricing strategies and hedge commodity positions to maintain profitability. Smaller manufacturers lack the financial resources to implement sophisticated hedging strategies, creating competitive disadvantages that favor large multinational corporations with established risk management capabilities and diversified supplier networks.
Stricter European Feed Additive Regulations
The European Food Safety Authority has restricted functional claims for 12 new compounds since 2024, requiring extensive clinical trials and safety studies that cost EUR 1-3 billion (USD 1.16-3.49 billion) per ingredient and extend product development timelines by 18-24 months. These regulatory tightening measures have particularly impacted the functional treat segment, where manufacturers previously relied on novel ingredients and health claims to justify premium pricing and differentiate products from conventional alternatives. Compliance costs have created barriers to entry for smaller manufacturers, as the investment required for regulatory approval often exceeds the financial capabilities of emerging brands and regional players.
*Our forecasts treat driver/restraint impacts as directional, not additive. The impact forecasts reflect baseline growth, mix effects, and variable interactions.
Segment Analysis
By Sub-product: Premium Categories Drive Value Creation
Crunchy treats maintained their dominant 23.9% market share in 2024, benefiting from established consumer preferences and manufacturing efficiencies that enable competitive pricing across all market segments. Crunchy treats serve multiple purposes, including promoting dental hygiene and providing overall satisfaction for pets, contributing to their sustained market leadership. The segment's strong performance is further supported by the increasing focus on pet health and wellness, with many manufacturers incorporating natural and functional ingredients into their crunchy treat formulations.
Freeze-dried and jerky treats emerged as the fastest-growing category at 7.8% CAGR, driven by consumer demand for minimally processed options that preserve nutritional integrity and deliver concentrated protein content. Freeze-dried and jerky treats accelerated growth is primarily driven by increasing consumer preference for minimally processed pet treats with high meat content. The segment's success is attributed to several key factors, including the treats' extended shelf life of up to four months, superior nutritional value compared to air-dried alternatives, and the absence of heat in the drying process, which helps preserve natural nutrients. Pet owners' growing awareness of ingredient quality and the rising demand for premium, protein-rich treats are further propelling this segment's expansion.


By Pets: Dog Segment Accelerates Through Specialized Formulations
Dogs retained their commanding 48.4% market share in 2024, supported by established consumption patterns and diverse size-specific formulations that address breed-specific nutritional requirements. The segment's dominance is particularly notable in countries like France and Germany, where dog owners show a strong preference for premium and specialized treats. Additionally, the rising trend of pet humanization has led to increased spending on high-quality dog treats, with owners particularly favoring crunchy treats and dental treats for their various health benefits and training applications.
Cats emerged as the fastest-growing segment at 7.0% CAGR, driven by specialized formulations that address feline-specific needs including urinary health, hairball control, and palatability preferences that differ significantly from canine products. ats' unique dietary preferences as obligate carnivores have particularly influenced the market, leading to a high demand for freeze-dried and jerky treats. The segment has also seen significant innovation in treat varieties, with manufacturers developing products specifically tailored to cats' preferences and nutritional needs, including dental treats, crunchy treats, and soft & chewy variants that enhance palatability and provide various health benefits.
By Distribution Channel: Online Growth Transforms Retail Dynamics
Supermarkets and hypermarkets retained their 44.5% market share in 2024 through expanded premium sections and improved category management that positions treats as impulse purchases alongside main meal products. This channel's prominence can be attributed to several key factors, including the convenience of one-stop shopping for pet owners who can purchase treats alongside their regular grocery items. These retail giants offer a diverse range of pet treat products, catering to various consumer preferences from economical options to premium brands. Major supermarket chains like Tesco, Carrefour, Auchan, Sainsbury's, Lidl, and Aldi have established strong distribution networks across Europe, making pet treats easily accessible to consumers.
Online channels emerged as the fastest-growing distribution method at 7.8% CAGR, penetration in Western European markets through subscription services, personalized recommendations, and direct-to-consumer brands that bypass traditional retail partnerships. Online channels have gained significant traction by offering convenience, competitive pricing, and a wide product selection with home delivery options. The regulatory environment supports channel diversification through updated distance selling regulations that facilitate cross-border e-commerce transactions while establishing clear liability frameworks for online pet food retailers across Europe member states[3]Source: European Commission, “Circular Economy Action Plan,” ec.europa.eu.
Geography Analysis
Russia commands the largest country share at 20.1% despite geopolitical challenges, with domestic manufacturers like Gamma and local production facilities maintaining market access through import substitution strategies and partnerships with regional suppliers. Russia pet treat markets are witnessing increasing adoption of modern retail formats and e-commerce platforms for pet treat distribution. The trend toward pet humanization is evident across these countries, driving demand for higher quality treats with specific functional benefits. Local manufacturers in Russia are increasingly focusing on product innovation and quality improvements to meet evolving consumer expectations and compete effectively in the European market.
Germany leads growth momentum at 7.6% CAGR, driven by sustainability-focused consumer preferences that favor organic and environmentally responsible formulations, supported by regulatory frameworks that incentivize circular economy initiatives and novel protein adoption. . The market benefits from a well-developed distribution network, with specialty pet stores and supermarkets playing crucial roles in product accessibility. German pet owners' increasing focus on pet dental health has driven strong demand for dental treats, while the growing trend of pet humanization continues to influence product development and marketing strategies.
France and Italy represent mature markets with established premium segments, where human-grade ingredient adoption and artisanal positioning enable manufacturers to command higher average selling prices while maintaining steady volume growth through veterinary endorsement and specialty retail partnerships. Nordic countries lead sustainability initiatives, with circular economy approaches and upcycling programs gaining consumer acceptance and regulatory support that enables premium positioning for environmentally responsible products
Competitive Landscape
The European pet food and treats market exhibits a fragmented competitive landscape with a mix of global multinational corporations and regional specialists including Mars, Incorporated, Colgate-Palmolive Company (Hill's Pet Nutrition, Inc.), Nestle (Purina), Affinity Petcare S.A , and VAFO Group a.s. has accounted for 25.8% of market share in 2024. Global conglomerates leverage their extensive research capabilities, established distribution networks, and strong brand recognition to maintain their market positions, while regional players capitalize on their local market knowledge and ability to cater to specific regional preferences. The market is characterized by continuous consolidation activities, with larger companies acquiring smaller, innovative players to expand their product portfolios and geographical presence.
The competitive dynamics are shaped by the presence of both pet food specialists and diversified consumer goods companies, creating a multi-layered competitive environment. Regional players maintain strong positions in specific markets through specialized product offerings and a deep understanding of local consumer preferences. The market witnesses regular merger and acquisition activities, particularly targeting companies with strong innovation capabilities or established regional presence, as larger players seek to strengthen their market positions and expand their geographical footprint.
Success in the European pet treats market increasingly depends on companies' ability to innovate and develop products that align with the growing trend of pet humanization and health consciousness. Companies need to focus on developing premium, natural, and functional treats while maintaining strong relationships with veterinary professionals and pet specialty retailers. Building robust omnichannel distribution networks, including both traditional retail channels and e-commerce platforms, is crucial for market success. Manufacturers must also invest in sustainable packaging solutions and transparent supply chains to meet growing consumer demands for environmentally responsible products.
Europe Pet Treats Industry Leaders
Mars, Incorporated
Colgate-Palmolive Company (Hill's Pet Nutrition, Inc.)
Nestle (Purina)
Affinity Petcare S.A
VAFO Group a.s.
- *Disclaimer: Major Players sorted in no particular order

Recent Industry Developments
- September 2025: Mars, Incorporated has planned to invest €1 billion (USD 1.16 billion) in its European Union operations by the end of 2026. The investment aims to strengthen the region's manufacturing capabilities, sustainability initiatives, and innovation pipeline while increasing economic resilience. This investment follows the company's previous €1.5 billion (USD 1.74) investment in European Union manufacturing over the past five years, which focused on modernizing facilities, increasing production capacity, and reducing carbon emissions across its value chain. The investment supports Mars' 24 factories across 10 European Union countries and its 25,000 direct employees.
- May 2023: Vafo Praha, s.r.o. launched its new range of Brit RAW Freeze-dried treats and toppers for dogs. These products are made up of high-quality proteins and minimally processed ingredients for potential health benefits.
- May 2023: Nestle Purina launched new cat treats under the Friskies "Friskies Playfuls - treats" brand. These treats are round in shape and are available in chicken and liver and salmon and shrimp flavors for adult cats.


Europe Pet Treats Market Report Scope
Crunchy Treats, Dental Treats, Freeze-dried and Jerky Treats, Soft & Chewy Treats are covered as segments by Sub Product. Cats, Dogs are covered as segments by Pets. Convenience Stores, Online Channel, Specialty Stores, Supermarkets/Hypermarkets are covered as segments by Distribution Channel. France, Germany, Italy, Netherlands, Poland, Russia, Spain, United Kingdom are covered as segments by Country.| Crunchy Treats |
| Dental Treats |
| Freeze-dried and Jerky Treats |
| Soft & Chewy Treats |
| Other Treats |
| Cats |
| Dogs |
| Other Pets |
| Convenience Stores |
| Online Channel |
| Specialty Stores |
| Supermarkets/Hypermarkets |
| Other Channels |
| France |
| Germany |
| Italy |
| Netherlands |
| Poland |
| Russia |
| Spain |
| United Kingdom |
| Rest of Europe |
| Sub Product | Crunchy Treats |
| Dental Treats | |
| Freeze-dried and Jerky Treats | |
| Soft & Chewy Treats | |
| Other Treats | |
| Pets | Cats |
| Dogs | |
| Other Pets | |
| Distribution Channel | Convenience Stores |
| Online Channel | |
| Specialty Stores | |
| Supermarkets/Hypermarkets | |
| Other Channels | |
| Country | France |
| Germany | |
| Italy | |
| Netherlands | |
| Poland | |
| Russia | |
| Spain | |
| United Kingdom | |
| Rest of Europe |


Market Definition
- FUNCTIONS - Pet foods are usually intended to provide complete and balanced nutrition to the pet but are primarily used as functional products. The scope includes the food and supplements consumed by pets including veterinary diets. Supplements/nutraceuticals that are directly supplied to pets are considered within the scope.
- RESELLERS - Companies engaged in reselling of pet food without value addition have been excluded from the market scope, in order to avoid double counting.
- END CONSUMERS - Pet owners are considered to be the end-consumers in the market studied.
- DISTRIBUTION CHANNELS - Supermarkets/hypermarkets, specialty stores, convenience stores, online channels and other channels are considered within the scope. The stores which are exclusively providing pet related basic and custom products are considered within the scope of specialty stores.
| Keyword | Definition |
|---|---|
| Pet Food | The scope of pet food includes the food that is eatable by pets including food, treats, veterinary diets, and nutraceuticals/supplements. |
| Food | Food is animal feed intended for consumption by pets. It is formulated to provide essential nutrients and meet the dietary needs of various types of pets, including dogs, cats, and other animals. These are generally segmented into dry and wet pet foods. |
| Dry Pet Food | Dry pet foods may be extruded/baked (kibbles) or flaked. They have a lower moisture content, typically around 12-20%. |
| Wet Pet Food | Wet pet food, also known as canned pet food or moist pet food, generally has a higher moisture content compared to dry pet food, often ranging from 70-80%. |
| Kibbles | Kibbles are dry, processed pet food in small, bite-sized pieces or pellets. They are specifically formulated to provide balanced nutrition for various domestic animals, such as dogs, cats, and other animals. |
| Treats | Pet Treats are special food items or rewards given to pets, to show affection, and encourage good behavior. They are especially used during training. Pet treats are made from various combinations of meat or meat-derived materials with other ingredients. |
| Dental Treats | Pet dental treats are specialized treats that are formulated to promote good oral hygiene in pets. |
| Crunchy Treats | It is a type of pet treat that has a firm and crispy texture which can be a good source of nutrition for pets. |
| Soft and chewy treats | Soft and Chewy pet treats are a type of pet food product that is formulated to be easy to chewy and digest. They are usually made from soft and pliable ingredients, such as meat, poultry, or vegetables, that have been blended and formed into bite-sized pieces or strips. |
| Freeze-dried & Jerky Treats | Freeze-dried and jerky treats are snacks given to pets, that are prepared through a special preservation process, without damaging the nutritional content, resulting in long-lasting, nutrient-rich treats. |
| Urinary Tract Disease Diets | These are commercial diets that are specifically formulated to promote urinary health and reduce the risk of urinary tract infections and other urinary problems. |
| Renal Diets | These are specialized pet foods formulated to support the health of pets with kidney disease or renal insufficiency. |
| Digestive Sensitivity Diets | Digestive-sensitive diets are specially formulated to meet the nutritional needs of pets with digestive issues such as food intolerances, allergies, and sensitivities. These diets are designed to be easily digestible and to reduce the symptoms of digestive problems in pets. |
| Oral Care Diets | Oral care diets for pets are specially formulated diets produced to promote oral health and hygiene in pets. |
| Grain-Free Pet Food | Pet food that does not contain common grains like wheat, corn, or soy. Grain-free diets are often preferred by pet owners seeking alternative options or if their pets have specific dietary sensitivities. |
| Premium Pet Food | High-quality pet food formulated with superior ingredients often offers additional nutritional benefits compared to standard pet food. |
| Natural Pet Food | Pet food made from natural ingredients, with minimal processing and without artificial preservatives. |
| Organic Pet Food | Pet food is produced using organic ingredients, free from synthetic pesticides, hormones, and genetically modified organisms (GMOs). |
| Extrusion | A manufacturing process used to produce dry pet food, where ingredients are cooked, mixed, and shaped under high pressure and temperature. |
| Other Pets | Other pets include birds, fish, rabbits, hamsters, ferrets, and reptiles. |
| Palatability | The taste, texture, and aroma of pet food influence its appeal and acceptance by pets. |
| Complete and Balanced Pet Food | Pet food that provides all essential nutrients in appropriate proportions to meet the nutritional needs of pets without additional supplementation. |
| Preservatives | These are the substances that are added to pet food to extend its shelf life and prevent spoilage. |
| Nutraceuticals | Food products that offer health benefits beyond basic nutrition, often contain bioactive compounds with potential therapeutic effects. |
| Probiotics | Live beneficial bacteria that promote a healthy balance of gut flora, supporting digestive health and immune function in pets. |
| Antioxidants | Compounds that help neutralize harmful free radicals in the body, promoting cellular health and supporting the immune system in pets. |
| Shelf-Life | The duration of which pet food remains safe and nutritionally viable for consumption after its production date. |
| Prescription diet | Specialized pet food formulated to address specific medical conditions under veterinary supervision. |
| Allergen | A substance that can cause allergic reactions in some pets, leading to food allergies or sensitivities. |
| Canned food | Wet pet food that is packed in cans and contains higher moisture content than dry food. |
| Limited ingredient diet (LID) | Pet food formulated with a reduced number of ingredients to minimize potential allergens. |
| Guaranteed Analysis | The minimum or maximum levels of certain nutrients present in pet food. |
| Weight management | Pet food designed to help pets maintain a healthy weight or support weight loss efforts. |
| Other Nutraceuticals | It includes prebiotics, antioxidants, digestive fiber, enzymes, essential oils and herbs. |
| Other Veterinary Diets | It includes weight management diets, skin and coat health, cardiac care, and joint care. |
| Other Treats | It includes rawhides, mineral blocks, lickables, and catnips. |
| Other Dry Foods | It includes cereal flakes, mixers, meal toppers, freeze-dried foods, and air-dried foods. |
| Other Animals | It includes birds, fish, reptiles, and small animals (rabbits, ferrets, hamsters). |
| Other Distribution Channels | It includes veterinary clinics, local unregulated stores, and feed and farm stores. |
| Proteins and Peptides | Proteins are large molecules composed of basic units called amino acids which help in the growth and development of pets. Peptides are the short string of 2 to 50 amino acids. |
| Omega-3 fatty acids | Omega-3 fatty acids are essential polyunsaturated fats that play a crucial role in the overall health and well-being of Pets |
| Vitamins | Vitamins are the essential organic compounds that are essential for vital physiological functioning. |
| Minerals | Minerals are naturally occurring inorganic substances that are essential for various physiological functions in pets. |
| CKD | Chronic Kidney Disease |
| DHA | Docosahexaenoic Acid |
| EPA | Eicosapentaenoic Acid |
| ALA | Alpha-linolenic Acid |
| BHA | Butylated Hydroxyanisol |
| BHT | Butylated Hydroxytoluene |
| FLUTD | Feline Lower Urinary Tract Disease |


Research Methodology
Mordor Intelligence follows a four-step methodology in all our reports.
- Step-1: IDENTIFY KEY VARIABLES: In order to build a robust forecasting methodology, the variables and factors identified in Step-1 are tested against available historical market numbers. Through an iterative process, the variables required for market forecast are set and the model is built on the basis of these variables.
- Step-2: Build a Market Model: Market-size estimations for the forecast years are in nominal terms. Inflation is not a part of the pricing, and the average selling price (ASP) is kept constant throughout the forecast period.
- Step-3: Validate and Finalize: In this important step, all market numbers, variables and analyst calls are validated through an extensive network of primary research experts from the market studied. The respondents are selected across levels and functions to generate a holistic picture of the market studied.
- Step-4: Research Outputs: Syndicated Reports, Custom Consulting Assignments, Databases & Subscription Platforms


