Market Overview
| Study Period | 2020 - 2031 |
|---|---|
| Forecast Data Period | 2026 - 2031 |
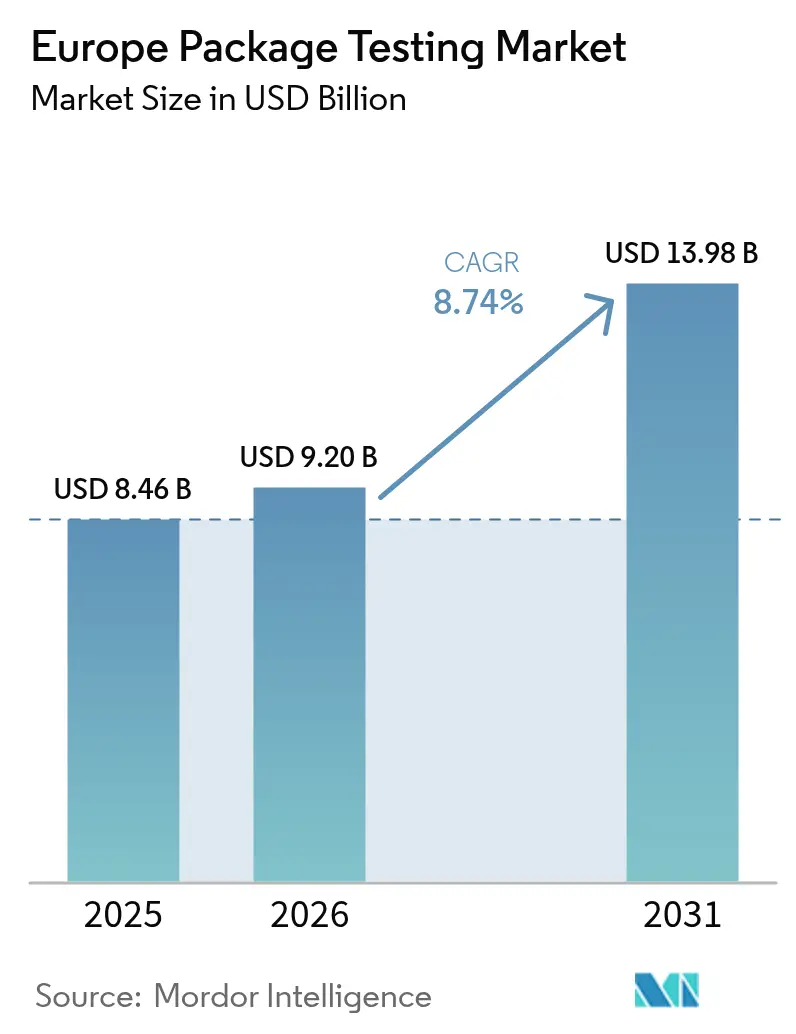
| Base Year Market Size (2025) | USD 8.46 Billion |
| Market Size (2026) | USD 9.2 Billion |
| Market Size (2031) | USD 13.98 Billion |
| Growth Rate (2026 - 2031) | 8.74% CAGR |
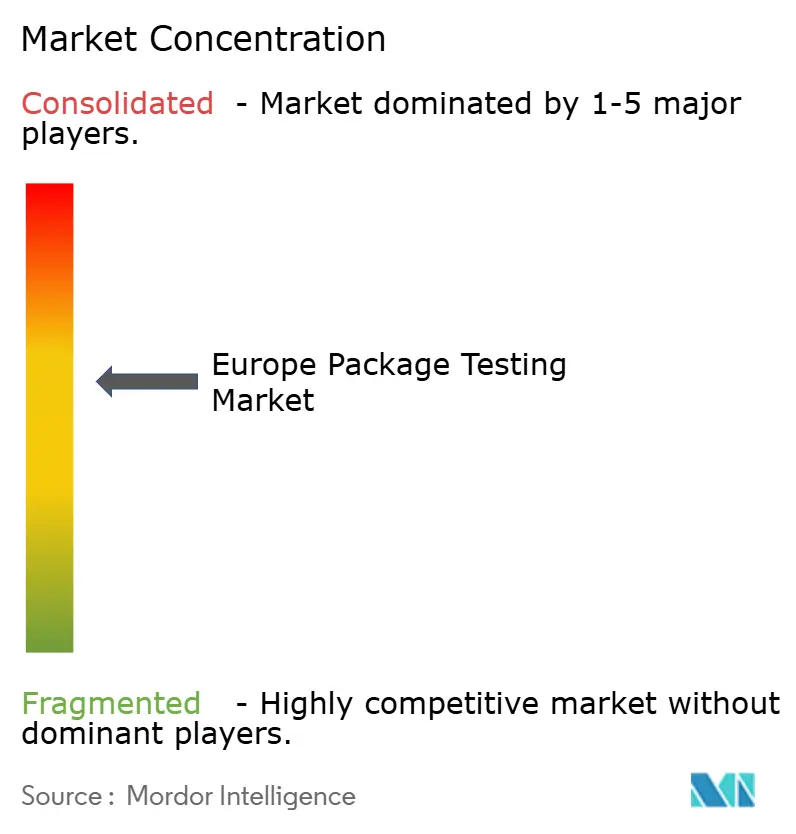
| Market Concentration | Medium |
Major Players *Disclaimer: Major Players sorted in no particular order Image © Mordor Intelligence. Reuse requires attribution under CC BY 4.0. | |
Europe Package Testing Market Analysis by Mordor Intelligence
The Europe package testing market size is expected to grow from USD 8.46 billion in 2025 to USD 9.2 billion in 2026 and is forecast to reach USD 13.98 billion by 2031 at 8.74% CAGR over 2026-2031. Accelerated growth flows from the Packaging and Packaging Waste Regulation (PPWR), e-commerce transit pressures, and the move toward circular, fiber-rich materials that demand more sophisticated validation. Heightened PFAS restrictions have pushed laboratories to invest in advanced chemical migration equipment, while rapid deployment of AI-enabled benches shortens turnaround times and boosts throughput. Converter–brand partnerships now integrate real-time quality data into design cycles, squeezing development timelines without compromising compliance. Investment barriers persist, yet regional consolidation and automation are gradually easing the capacity shortages that once delayed sustainable product launches across the Europe package testing market.
Key Report Takeaways
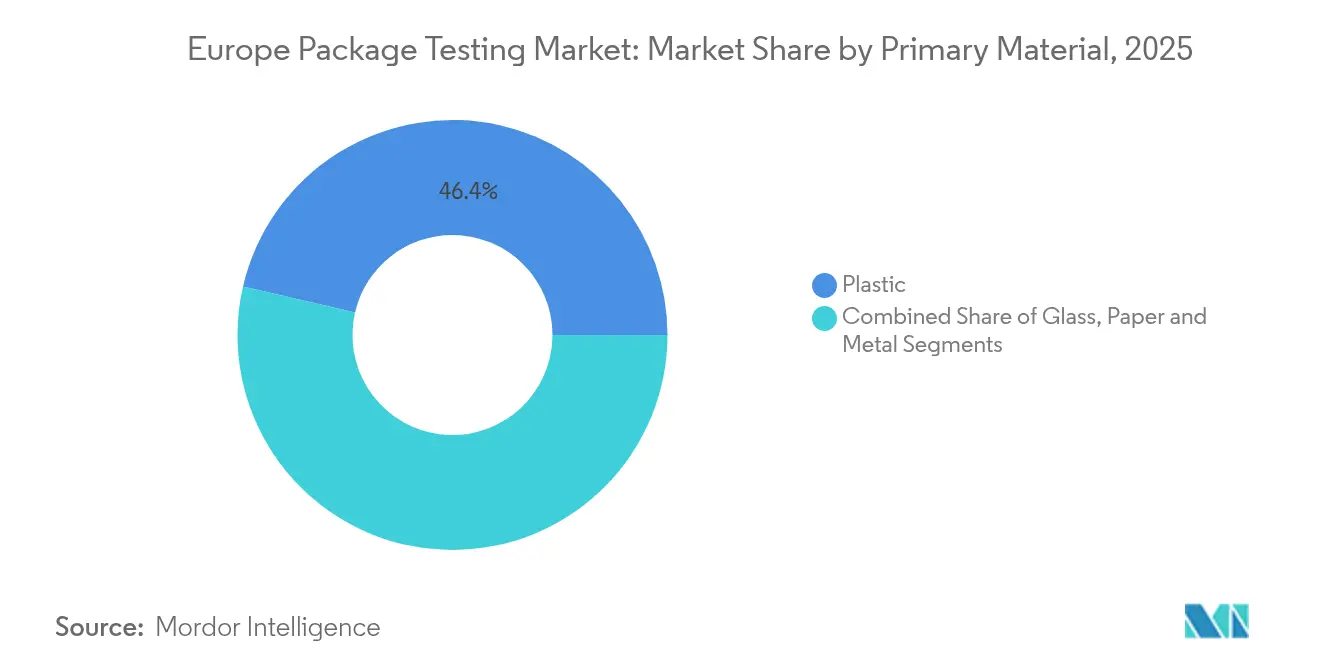
- By primary material, plastic maintained 46.38% of the Europe package testing market share in 2025, whereas paper-based formats are on track for a 10.15% CAGR through 2031.
- By type of testing, physical performance held 48.75% of the Europe package testing market size in 2025, while environmental protocols are forecast to rise at 9.31% CAGR to 2031.
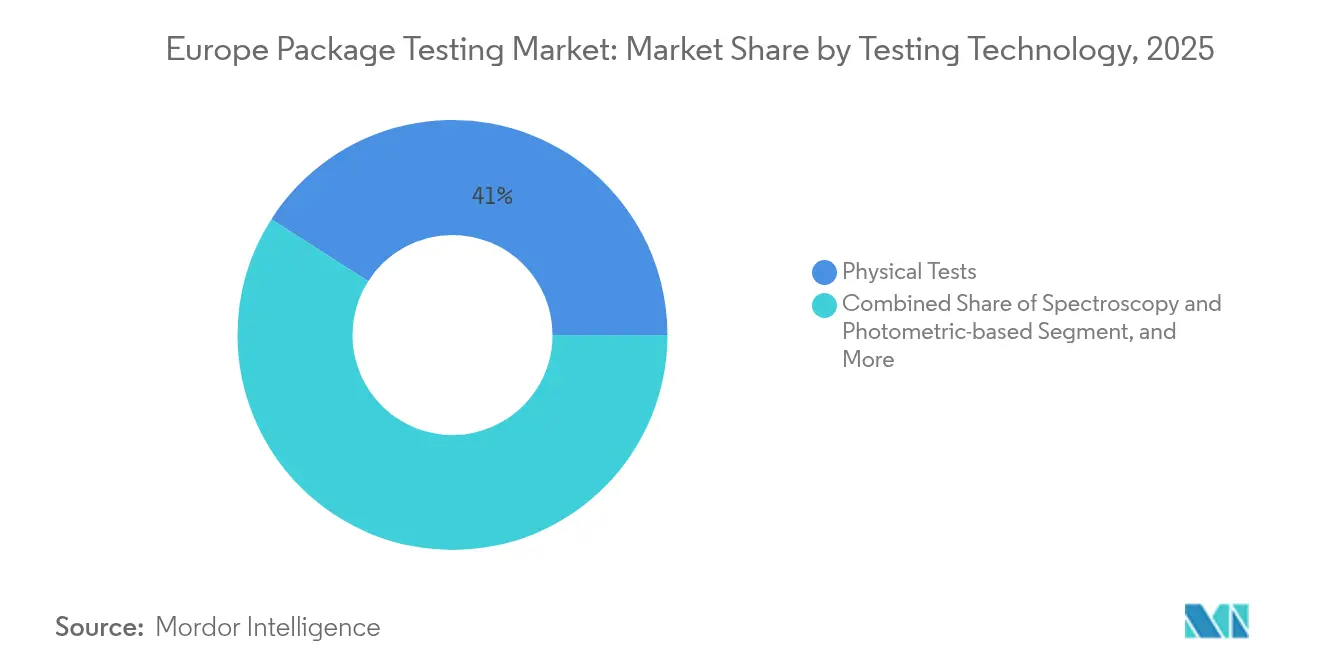
- By testing technology, physical rigs still hold 40.95% of the Europe package testing market size in 2025, while spectroscopy and photometric methods are projected to grow at a 9.7% CAGR through 2031.
- By country, the United Kingdom captured 20.95% share of the Europe package testing market size in 2025; Spain is projected to post the fastest 10.82% CAGR through 2031.
- By end-user vertical, food and beverage led with 32.05% revenue share in 2025; healthcare and pharmaceuticals will accelerate at a 10.05% CAGR to 2031.
Note: Market size and forecast figures in this report are generated using Mordor Intelligence’s proprietary estimation framework, updated with the latest available data and insights as of 2026.
Europe Package Testing Market Trends and Insights
Drivers Impact Analysis*
| Driver | (~) % Impact on CAGR Forecast | Geographic Relevance | Impact Timeline |
|---|---|---|---|
| Stringent EU regulatory compliance on packaging safety and performance | +2.1% | EU-wide, strongest in Germany and France | Medium term (2-4 years) |
| Growing e-commerce intensifying demand for transit-ready packaging validation | +1.8% | UK, Germany, Netherlands core markets | Short term (≤ 2 years) |
| Transition to sustainable materials creating new test protocol demand | +1.6% | Nordic countries and Germany leading | Long term (≥ 4 years) |
| Rapid deployment of AI-enabled automated test benches | +1.3% | Industrial hubs in Germany, Italy, France | Medium term (2-4 years) |
| Rising need to extend shelf-life for food and pharma | +1.0% | Food processing regions, pharmaceutical hubs | Medium term (2-4 years) |
| Converter-brand in-house lab partnerships accelerating innovation cycles | +0.8% | Manufacturing centers across EU | Short term (≤ 2 years) |
| Source: Mordor Intelligence | |||
Stringent EU Regulatory Compliance on Packaging Safety and Performance
The PPWR, in force since January 2025, obliges every package above 10 grams to pass recyclability, compostability, and chemical-migration tests before entering the single market.[1]European Commission, “Packaging and Packaging Waste,” environment.ec.europa.eu Laboratories have poured more than EUR 2 million (USD 2.18 million) per site into PFAS detection systems able to quantify 25 ppm limits, and sample volumes for that assay alone have climbed 40% year on year. Digital product passport data now links life-cycle metrics to each shipment, intertwining environmental and physical validations inside the Europe package testing market. Extended lead times from two to six weeks are driving demand for AI scheduling tools that allocate instrumentation dynamically, shrinking bottlenecks. Given PPWR’s scope across cosmetics, pharmaceuticals, and industrial packages, compliance pressure is likely to keep test-volume demand elevated through the medium term.
Growing E-commerce Intensifying Demand for Transit-Ready Packaging Validation
Amazon’s 2024 update to ISTA 6-Amazon simulations requires high-speed vibration, climate cycling, and last-mile drop analytics in one sequence. European labs have spent up to EUR 1.5 million (USD 1.64 million) on route-specific chambers because fragile direct-to-consumer biologics must arrive intact within narrow temperature bands. Machine-learning models ingest courier sensor data to predict failure modes, cutting redesign cycles by 20 %. The surge of pharmacy-to-door deliveries positions e-commerce as a top volume driver for the Europe package testing market over the next two years.
Transition to Sustainable Materials Creating New Test Protocol Demand
Fiber-based, algae-based, and compostable biopolymers now account for the fastest-rising sample category. EN 13432 standards have widened to include marine degradation metrics, prompting capital outlays of EUR 200,000–800,000 (USD 218,000–872,000) for controlled composting rigs. Recyclability tests for mycelium foams demand contamination assays that push run times to 12 weeks. Co-development agreements between labs and resin producers are common, granting both parties iterative data and keeping sustainable designs flowing into the Europe package testing market.
Rapid Deployment of AI-Enabled Automated Test Benches
Optical-sensor arrays from PTI and AT2E provide nondestructive container-closure integrity checks that trim costs 30 % while spotting micro-leaks at micrometer scales. Figure AI’s robotic platforms have tripled sample throughput and link results to enterprise systems for live process tweaks. Predictive algorithms crunch historical failure data, steering packaging engineers toward lighter materials without sacrificing safety. Automation is therefore emerging as the linchpin for meeting swelling volumes in the Europe package testing market.
Restraints Impact Analysis*
| Restraint | (~) % Impact on CAGR Forecast | Geographic Relevance | Impact Timeline |
|---|---|---|---|
| High capital costs for advanced test equipment and accreditation | -1.4% | Smaller EU markets, Eastern Europe | Medium term (2-4 years) |
| Offshore low-cost labs undercutting European service pricing | -0.8% | EU-wide, strongest impact in price-sensitive segments | Short term (≤ 2 years) |
| Shortage of ISTA-certified technicians causing certification bottlenecks | -0.9% | EU-wide, acute in Nordic countries | Short term (≤ 2 years) |
| Uneven enforcement of EU directives creating compliance uncertainty | -0.7% | Eastern and Southern Europe primarily | Medium term (2-4 years) |
| Source: Mordor Intelligence | |||
High Capital Costs for Advanced Test Equipment and Accreditation
Container-closure integrity rigs can exceed EUR 1.2 million (USD 1.31 million) each, while full climate chambers add another EUR 500,000 (USD 545,000).[2]Bureau Veritas, “Testing Services,” bureauveritas.com ISO 17025 maintenance costs run up to EUR 150,000 (USD 163,500) annually, a burden that keeps small entrants on the sidelines. Rapid protocol evolution, especially around PFAS, forces reinvestment every three to five years, inflating the cost curve inside the Europe package testing market. Eastern European labs face 12- to 18-month delivery delays, compounding capacity gaps and pushing regional brands toward larger Western providers.
Shortage of ISTA-Certified Technicians Causing Certification Bottlenecks
Only about 200 CPLP and PDP professionals graduate in Europe each year, against the estimated demand for 400, creating chronic understaffing. Premium salaries 15–25 % above standard lab rates invite poaching that destabilizes smaller facilities. Nordic life-science hubs feel the crunch most acutely, with some projects waiting six weeks for technician availability. Dual requirements for AI-bench operation and ISTA protocols further narrow the talent pool, restraining growth momentum in the Europe package testing market.
*Our forecasts treat driver/restraint impacts as directional, not additive. The impact forecasts reflect baseline growth, mix effects, and variable interactions.
Segment Analysis
By Primary Material: Plastic Dominance Drives Complex Validation Requirements
Plastic packaging retained 46.38% share of the Europe package testing market in 2025, a position secured by multilayer barrier films that protect high-value foods and medicines. Ongoing PFAS limits mean every new resin variant triggers extensive migration and leachate analytics. A typical validation cycle now consumes EUR 800,000–2 million (USD 872,000–2.18 million) in capital toward chromatography, spectroscopy, and image-analysis suites. Paper formats, however, are registering a 10.15% CAGR through 2031, thanks to wet-strength additives that raise performance closer to that of polymer rivals while keeping recyclable content intact.
Paper’s ascent also reflects brand ambitions to cut carbon footprints in line with PPWR targets. Testing labs therefore bundle Cobb absorption, tensile integrity, and fiber-recovery simulations into one composite protocol that halves turnaround time. Glass and metal, though smaller, continue to demand coating-adhesion and corrosion assays, especially for premium cosmetics and RTD beverages. By balancing legacy protocols with emerging fiber validations, laboratories are broadening service menus and reinforcing the Europe package testing market.


By Type of Testing: Environmental Protocols Accelerate Sustainability Validation
Physical performance examinations, drop, vibration, and compression still command 48.75% of 2025 revenue. These tests underpin every e-commerce fulfillment model and remain integral to the Europe package testing market size ISTA.ORG. Yet environmental assays, from carbon footprint to biodegradation kinetics, will expand fastest at 9.31% CAGR. Laboratories are buying EUR 400,000–1.5 million (USD 436,000–1.64 million) composting rigs capable of monitoring CO₂ evolution, disintegration, and ecotoxicity in a single pass.
Chemical testing occupies the middle ground, specializing in low-level migration and additive quantification. As PPWR’s digital passport rollout scales, labs are merging all three disciplines, physical, chemical, and environmental, into integrated protocols. The ability to deliver a complete compliance pack in one report is emerging as a decisive differentiator across the Europe package testing market.
By Testing Technology: Spectroscopy Advances Enable Rapid Characterization
Spectroscopy and photometric methods are projected to grow at 9.7% CAGR through 2031, driven by real-time, nondestructive analytics that optimize high-volume runs. Physical rigs still hold 40.95% slice of current revenue but face competition from AI-directed systems that compress cycle times. Chromatography remains essential for nanogram-level contaminant detection, particularly in pharmaceutical blister packs, where detection limits fall below 1 ppb.
AI-ready equipment now stitches machine vision, spectroscopy, and pressure sensors into a single enclosure. Such platforms cut sampling error, raise data granularity, and feed directly into MES dashboards, sharpening process capability across the Europe package testing market.
By End-User Vertical: Healthcare Applications Drive Premium Testing
Food and beverage packages accounted for a 32.05% share in 2025, sustained by shelf-life and migration protocols that secure mainstream grocery distribution. The healthcare and pharmaceuticals segment, however, is advancing at a 10.05% CAGR. Container-closure integrity studies for injectables require helium leakproofing down to 10⁻⁶ mbar·L/s, mandating EUR 500,000–1.5 million benches (USD 545,000–1.64 million). Typical test cycles span 12–20 weeks and command premium fees that bolster profitability inside the Europe package testing market.
Industrial clients prioritize flame-spread, puncture, and corrosion, while household-product providers need compatibility reviews against aggressive detergents. The result is cross-pollination of test know-how: a pharma-grade micro-leak benchmark, for instance, is now migrating to sensitive food applications. Such convergence keeps laboratories diversified and protects margins amid sector swings.
Geography Analysis
The United Kingdom contributed 20.95% of 2025 revenue after Brexit-era statutes raised national compliance thresholds beyond EU baselines. Investments exceeding GBP 50 million (USD 63 million) into automated chambers and robotic samplers have lifted sample throughput, giving British labs a first-mover edge. Germany, anchored by process engineering depth, channels funding toward environmental validation for bio-polymer innovations, with test-volume growth hitting 25% in 2024.
Spain’s 10.82% CAGR outlook ties to booming fruit-and-veg exports and rising pharma fill-finish capacity. Transport simulations for Mediterranean produce now integrate humidity algorithms that mimic cross-region trucking conditions, refining package sizing and slashing spoilage. Italy leverages luxury food and fashion export needs to push substrate-specific color fastness and aroma-barrier trials, whereas France’s cosmetics dominance drives optical-defect and allergen-migration certification. Smaller Eastern markets face capital and talent constraints yet frequently outsource high-complexity studies to Western hubs, sustaining intra-region sample flows that lift overall utilization across the Europe package testing market. Pan-European collaborations under Horizon funding aim to democratize AI benches, hinting at capacity equalization by the decade’s close.
Competitive Landscape
The competitive field remains moderately fragmented: the top five service providers account for roughly 35–40% of the Europe package testing market, while specialist labs and in-house centers capture the balance. SGS recorded 12% service-line growth in 2024 after allocating EUR 45 million (USD 49 million) to PFAS analytics and bench automation. Bureau Veritas and Intertek leverage multi-sector credentials to win pan-EU outsourcing deals, yet nimble regional labs often prevail on quick-turn custom protocols.
Patent filings for AI-enhanced validation jumped 35% in 2024, signaling an innovation race that favors automation suppliers.[3]European Patent Office, “Patent Statistics,” epo.org Shortages of ISTA-licensed technicians have prompted joint ventures between labs and academic centers to guarantee pipeline talent. Converter-brand alliances are introducing real-time performance dashboards that reduce external testing spend, but these systems still rely on third-party labs for accreditation, ensuring sustained underlying demand in the Europe package testing market.
Pricing power is moving toward facilities that blend robotics, machine vision, and multi-physics simulation, since they can deliver full PPWR compliance reports in half the traditional lead time. Those capabilities, coupled with sector-specific expertise pharma in the UK, cosmetics in France, bio-polymers in Germany determine contract wins more than raw scale.
Europe Package Testing Industry Leaders
Intertek Group plc
TUV SUD AG
SGS SA
Bureau Veritas SA
Eurofins Scientific SE
- *Disclaimer: Major Players sorted in no particular order

Recent Industry Developments
- May 2025: ProMach acquired DJS Systems to integrate disposable food-pack automation with validation hardware, broadening sustainable-package services across the Europe package testing market.
- March 2025: Figure AI unveiled the Helix robotic sorter, slashing lab prep cycles by 40% via AI-directed sample handling.
- February 2025: SGS posted EUR 2.8 billion (USD 3.05 billion) 2024 revenue, noting 12% uptick in package testing lines as pharma and sustainable-material projects surged.
- January 2025: The EU activated PPWR, widening mandatory recyclability, compostability, and PFAS checks for every package type, adding EUR 500 million (USD 545 million) in annual test demand.


Europe Package Testing Market Report Scope
Packaging testing is a systematic evaluation process that assesses product packaging for quality, durability, functionality, and appeal. This process involves subjecting packaging materials and designs to various tests that simulate real-world conditions, consumer interactions, and potential challenges throughout the supply chain.
The Europe package testing market is segmented by primary material type (glass, paper, plastic, metal), by type of testing (drop test, vibration test, shock test, temperature testing), by end-user verticals (food and beverage, healthcare, industrial, personal care and household products, other end-user verticals), and by country (France, Germany, Italy, Spain and Rest of Europe). The market sizes and forecasts are provided in terms of value in (USD) for all the above segments.
By Primary Material
| Glass |
| Paper |
| Plastic |
| Metal |
By Type of Testing
| Physical Performance Testing |
| Chemical Testing |
| Environmental Testing |
By Testing Technology
| Physical Tests |
| Spectroscopy and Photometric-based |
| Chromatography-based |
| Other Advanced Methods |
By End-user Vertical
| Food and Beverage |
| Healthcare and Pharmaceuticals |
| Industrial and Manufacturing |
| Personal and Household Products |
| Other End-user Verticals |
By Country
| United Kingdom |
| Germany |
| Italy |
| France |
| Spain |
| Rest of Europe |
| By Primary Material | Glass |
| Paper | |
| Plastic | |
| Metal | |
| By Type of Testing | Physical Performance Testing |
| Chemical Testing | |
| Environmental Testing | |
| By Testing Technology | Physical Tests |
| Spectroscopy and Photometric-based | |
| Chromatography-based | |
| Other Advanced Methods | |
| By End-user Vertical | Food and Beverage |
| Healthcare and Pharmaceuticals | |
| Industrial and Manufacturing | |
| Personal and Household Products | |
| Other End-user Verticals | |
| By Country | United Kingdom |
| Germany | |
| Italy | |
| France | |
| Spain | |
| Rest of Europe |


Key Questions Answered in the Report
How large is the Europe package testing market in 2026?
The Europe package testing market size stands at EUR 8.44 billion (USD 9.2 billion) in 2026.
What is the expected growth rate for package testing services through 2031?
Aggregate demand is forecast to rise at an 8.74% CAGR through 2031.
Which testing segment is expanding fastest?
Environmental validation protocols, driven by sustainability mandates, are projected to post a 9.31% CAGR.
Which country currently leads in European package testing demand?
The United Kingdom holds the largest 20.95% share, supported by stringent post-Brexit regulations.
Why are paper-based packages gaining momentum?
Fiber formats match recyclability targets and register a 10.15% CAGR, the fastest among materials.
What factor most limits laboratory expansion today?
High capital costs for advanced test benches and ISO 17025 accreditation expenses restrain new entrants.
Page last updated on:


