Europe LED Lighting Market Size and Share
Market Overview
| Study Period | 2020 - 2031 |
|---|---|
| Forecast Data Period | 2026 - 2031 |
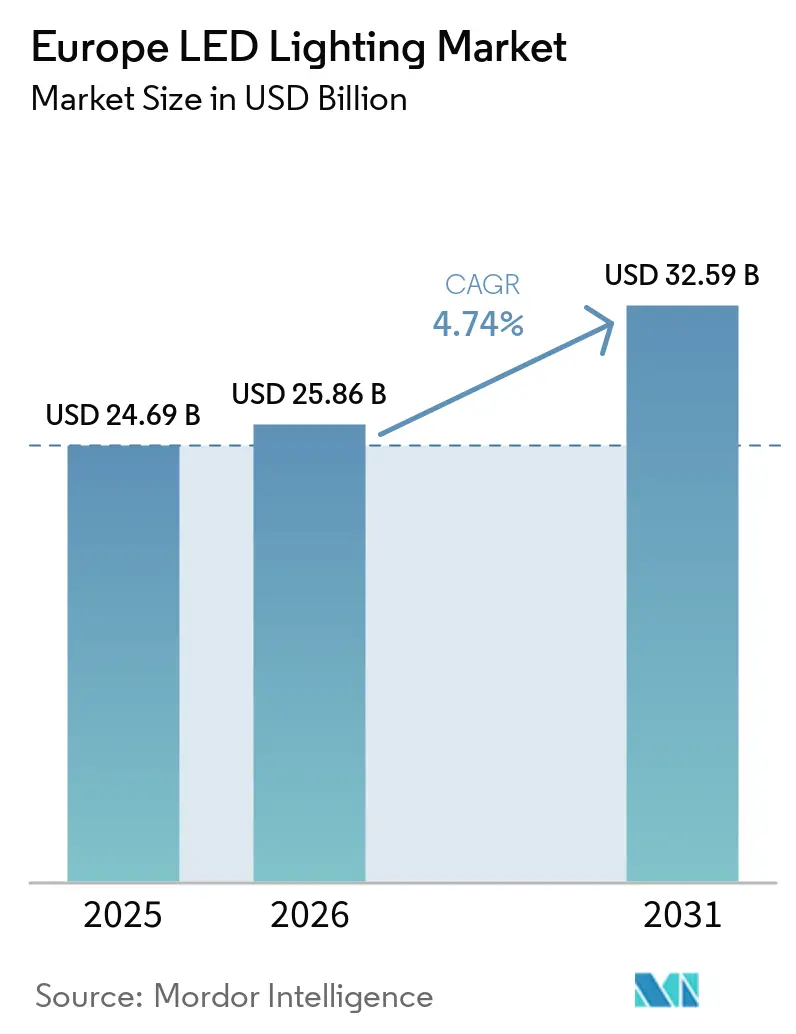
| Base Year Market Size (2025) | USD 24.69 Billion |
| Market Size (2026) | USD 25.86 Billion |
| Market Size (2031) | USD 32.59 Billion |
| Growth Rate (2026 - 2031) | 4.74% CAGR |
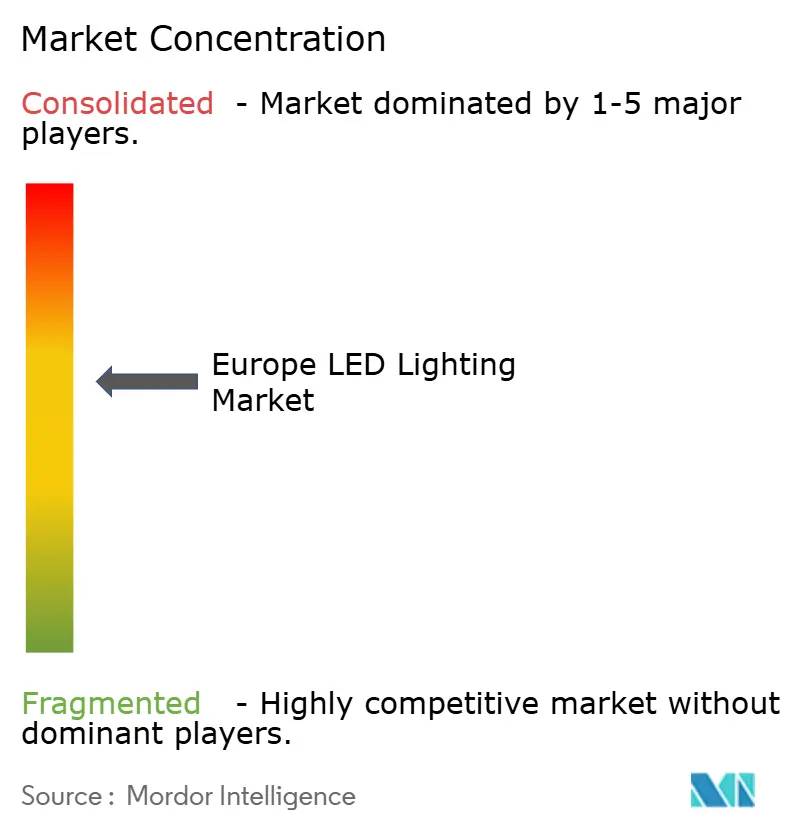
| Market Concentration | Medium |
Major Players *Disclaimer: Major Players sorted in no particular order Image © Mordor Intelligence. Reuse requires attribution under CC BY 4.0. | |
Europe LED Lighting Market Analysis by Mordor Intelligence
The Europe LED lighting market size was valued at USD 24.69 billion in 2025 and is forecasted to grow from USD 25.86 billion in 2026 to USD 32.59 billion by 2031, growing at a CAGR of 4.74% from 2026 to 2031. The European LED lighting market is being shaped by a tighter regulatory cycle that now covers efficiency, durability, reparability, recycled content, and digital traceability, which keeps product qualification active well beyond initial launch. Building renovation mandates are adding steady demand, especially in non-residential projects where automated lighting controls are moving from optional upgrades to baseline requirements. The ban on legacy fluorescent tubes continues to support a broad replacement cycle across offices, retail sites, logistics assets, and municipal infrastructure, which keeps retrofit volumes elevated across the region. The European LED lighting market is also shifting toward connected systems, service contracts, and software-led value capture, which gives established suppliers more room to defend margins even when basic luminaire pricing remains under pressure. This structure continues to favor large European suppliers with compliance depth and installed-system capabilities, while lower-cost imports remain more exposed in standardized, non-connected categories.
Key Report Takeaways
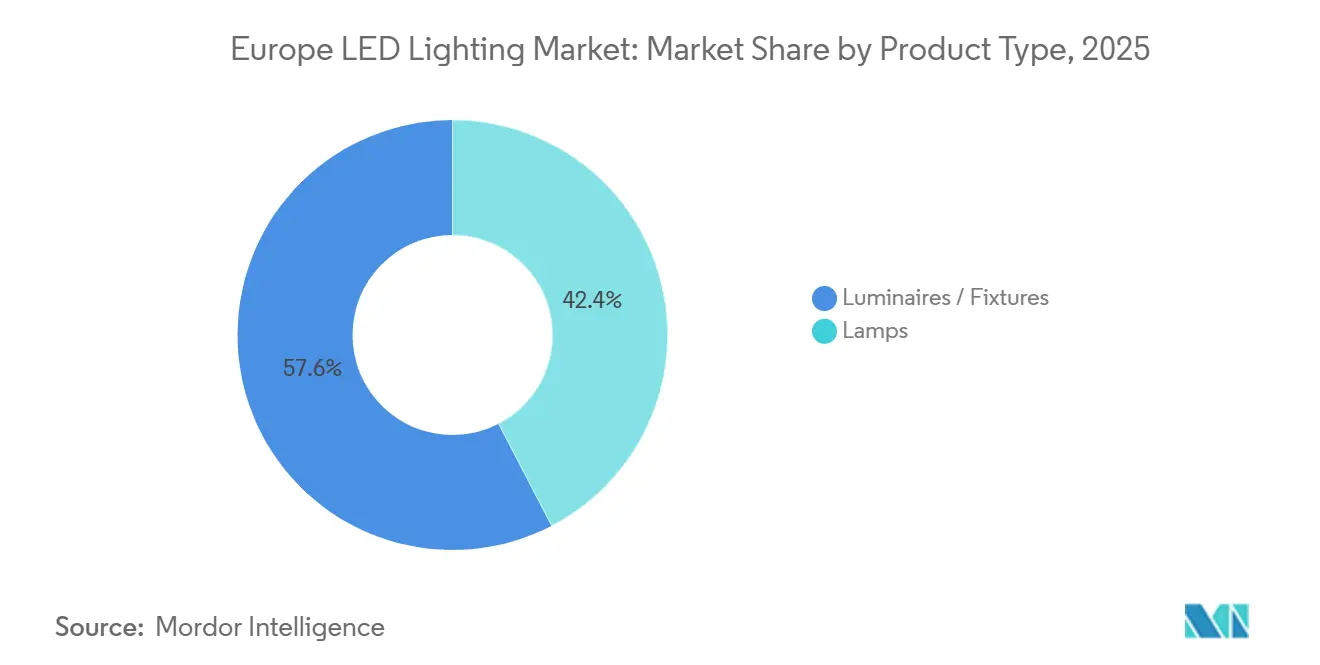
- By product type, luminaires and fixtures held 57.63% of the Europe LED lighting market share in 2025, while lamps are forecasted to grow at a 5.02% CAGR through 2031.
- By distribution channel, wholesale and retail accounted for 46.12% in 2025, while e-commerce is projected to expand at a 5.45% CAGR through 2031.
- By installation type, retrofit installation held 62.23% share of the Europe LED lighting market in 2025 and also recorded the fastest projected CAGR at 5.36% through 2031.
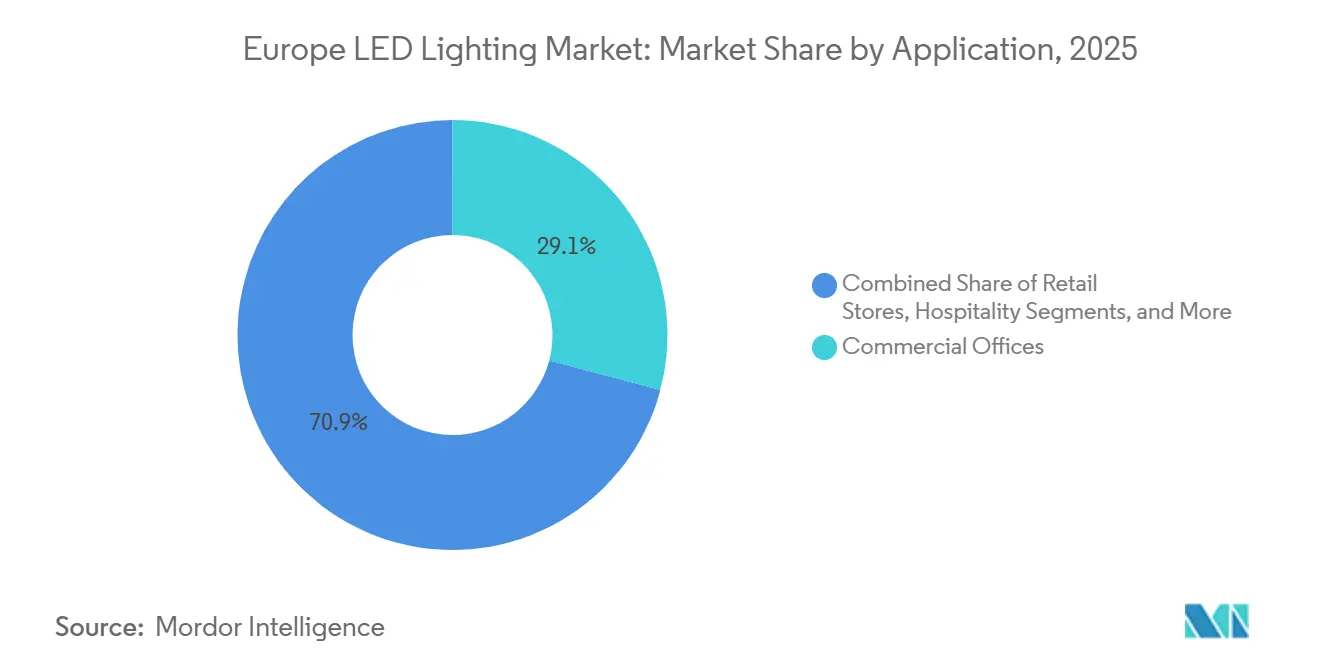
- By application, commercial offices accounted for 29.12% share in 2025, while horticulture gardens are forecasted to advance at a 5.29% CAGR through 2031.
- By end user, the indoor segment held 54.11% share in 2025, while the outdoor segment is projected to grow at a 5.51% CAGR through 2031.
- By Country, Germany held 22.14% of the Europe led lighting market share in 2025, and Poland is forecasted to grow at a 5.62% CAGR through 2031.
Note: Market size and forecast figures in this report are generated using Mordor Intelligence’s proprietary estimation framework, updated with the latest available data and insights as of 2026.
Europe LED Lighting Market Trends and Insights
Drivers Impact Analysis*
| Driver | (~) % Impact on CAGR Forecast | Geographic Relevance | Impact Timeline |
|---|---|---|---|
| Stringent EU Energy-Efficiency Regulations | +1.8% | EU-wide, strongest in Germany, the Netherlands, and Nordic countries | Short term (≤ 2 years) |
| Rapid Phase-Out of Halogen and Fluorescent Lamps | +1.5% | EU-wide, with highest replacement volumes in Northern and Western Europe | Short term (≤ 2 years) |
| Falling LED Cost per Lumen | +0.9% | EU-wide, with strongest adoption acceleration in Southern and Eastern Europe | Medium term (2-4 years) |
| Corporate Net-Zero Commitments Accelerating Retrofits | +0.6% | Western Europe, especially Germany, France, the Netherlands, and the UK, with spillover to the Nordics | Medium term (2-4 years) |
| Smart-City Tenders Bundling IoT Sensors | +0.4% | Urban EU centers, including Germany, Poland, Sweden, and Belgium | Medium term (2-4 years) |
| On-Site Renewable and DC Micro-Grids Adoption | +0.2% | The Netherlands, Germany, and Nordic countries, with early-stage activity in Southern Europe | Long term (≥ 4 years) |
| Source: Mordor Intelligence | |||


Stringent EU Energy-Efficiency Regulations Drive Baseline Demand
The Europe LED lighting market is benefiting from a regulatory framework that now reaches beyond efficiency and into product structure, documentation, and lifecycle performance. Regulation (EU) 2019/2020 set minimum efficacy thresholds for LED lamps, and the newer Ecodesign for Sustainable Products Regulation extended the compliance burden into durability, reparability, and recycled-content disclosure. This has raised the cost of non-compliance, especially as EPREL registration and data validation have become more visible enforcement tools across the region. The European Commission also stated that the current ecodesign and energy-labelling program helped cut final EU energy consumption by 12% in 2023, while avoiding 145 million tonnes of CO2 emissions and supporting 346,000 jobs, which shows why policy support remains firm rather than temporary. The Digital Product Passport will add another layer from 2026 onward, which means the Europe LED lighting market will continue to reward manufacturers that can manage engineering, traceability, and regulatory reporting at scale. Premium brands are also gaining support in specification-led projects because requirements such as stricter flicker and stroboscopic performance have made technical quality easier to verify during procurement.
Rapid Phase-Out of Halogen and Fluorescent Lamps Creates a Structural Replacement Pipeline
The Europe LED lighting market continues to draw demand from the 2023 EU phase-out of T5 and T8 fluorescent tubes because replacement behavior typically trails regulation by several maintenance cycles. That lag matters because many offices, retail sites, hospitals, and municipal facilities are still working through old installed bases that were not replaced immediately after the sales ban. A hospital retrofit in Slovakia showed a 52% reduction in annual energy use, falling from 93,728 kWh to 45,063 kWh, while yearly cost savings exceeded EUR 23,000 (USD 25,070), which keeps the payback case visible for public and institutional buyers. The replacement cycle is also larger than a simple lamp swap because many T8 conversions require control-gear updates and commissioning work, which pushes more projects toward connected retrofits instead of basic maintenance spend. Public tenders continue to reinforce that pipeline, as seen in the Szemud Commune project in Poland, where 436 LED replacements were contracted through 2026 under a municipal modernization program. This keeps the Europe LED lighting market supported by a replacement wave that has not yet fully worked through the region’s non-residential and public infrastructure stock.
Falling LED Cost Per Lumen Expands The Addressable Market
The Europe LED lighting market is also benefiting from a longer cost-efficiency cycle, where better chip performance and lower system costs are widening adoption outside premium projects. ams-OSRAM stated that its semiconductor optimization has enabled 200 lm/W emitters, which helps luminaire makers reduce component count while moving mainstream products closer to premium efficiency levels. That shift matters because the bill of materials can fall even when end-user performance improves, which opens more room for adoption in price-sensitive municipal and small business projects. A parking-lot retrofit at IKEA Switzerland replaced 14,000 fluorescent tubes with LED equivalents and delivered annual power savings of 2,520,000 kWh, while cutting energy and maintenance costs by 80% with a 28-month payback period. These economics make LED upgrades easier to justify for operators who previously delayed conversion because fixture-level investment looked too high for standard sites. As a result, the Europe LED lighting market is reaching more cost-sensitive demand pockets in Southern and Eastern Europe, where upfront capital discipline still shapes procurement behavior.
Corporate Net-Zero Commitments Accelerate Commercial Retrofits Beyond Minimum Compliance
The Europe LED lighting market is gaining support from corporate decarbonization programs that are pulling lighting upgrades forward before regulations alone would require them. Signify’s climate plan targets net-zero greenhouse gas emissions across its value chain by 2040, and the company reported 148 million tonnes of avoided CO2e in 2025 from LED technology sales relative to conventional alternatives.[1]Signify, “Annual Report 2025,” Signify, signify.com This has helped make lighting-as-a-service and managed retrofit contracts more attractive because they combine verified energy savings with reporting value for procurement and sustainability teams. An Irish leisure-center project that replaced 416 smart LED lights cut operating energy costs by 56% and carbon emissions by 65%, while also supporting a deep-renovation building energy rating improvement from E to A2. Fagerhult’s March 2025 entry into Germany with Organic Response as a standard commercial-office offer shows how connected controls are now being positioned as a core carbon-reduction tool rather than an optional add-on. Carrefour’s Belgian store in Mariakerke also used Signify’s Interact system and 3D-printed luminaires to achieve up to 30% additional energy savings and cut annual CO2e by 4 tonnes, which shows how retail chains are linking lighting choices directly to emissions targets.
Restraints Impact Analysis*
| Restraint | (~) % Impact on CAGR Forecast | Geographic Relevance | Impact Timeline |
|---|---|---|---|
| Price-Sensitive Retrofit Payback Period in SMEs | -0.5% | Southern and Eastern Europe, including Italy, Spain, Greece, Poland, and Romania | Short term (≤ 2 years) |
| Supply-Chain Volatility for Rare-Earth Phosphors | -0.3% | EU-wide, with strongest exposure among manufacturers dependent on Chinese terbium and europium oxide | Medium term (2-4 years) |
| Complexity of EU Eco-Design and WEEE Compliance | -0.2% | EU-wide, with disproportionate burden on SME manufacturers and importers | Medium term (2-4 years) |
| Shortage of Skilled Installers for Connected Lighting | -0.1% | EU-wide, most acute in the Netherlands, Poland, and Spain, with spillover into Ireland and the UK | Long term (≥ 4 years) |
| Source: Mordor Intelligence | |||
Price-Sensitive Retrofit Payback Periods Constrain SME Adoption
The Europe LED lighting market still faces a clear adoption gap among smaller businesses because full connected retrofits require higher upfront spending than many SMEs can absorb in one budget cycle. In Ireland alone, 248,000 SMEs occupied 109,000 buildings, yet only 4% had undergone deep retrofitting by 2025, which illustrates how slowly smaller occupiers move even when the long-term efficiency case is positive. This constraint is more visible in Southern and Eastern Europe, where lower electricity prices and tighter capital budgets weaken the near-term return case for basic retrofits. Financing models can help, but they often require energy audits, credit screening, and contract structures that many smaller operators see as complex or time-consuming. Whitecroft Lighting’s circular relight program for Currys showed what scale can achieve, refurbishing 77 stores, reusing more than 6,500 luminaires, and reducing energy use and greenhouse gas emissions by 40%. The problem is that individually owned SMEs rarely have that purchasing leverage, so the Europe LED lighting market still loses some conversion volume where investment decisions remain short-cycle and highly cash sensitive.
Supply-Chain Volatility for Rare-Earth Phosphors Introduces Margin and Availability Risk
The Europe LED lighting market remains exposed to concentrated rare-earth supply chains because key phosphor materials for white LEDs still rely heavily on Chinese upstream processing. This dependency became more visible after tighter Chinese controls on medium and heavy rare earths in late 2025 increased concern over cost and availability across European manufacturing lines.[2]International Energy Agency, “Rare Earth Elements, Pathways to Secure and Diversified Supply Chains,” IEA, iea.org The European Commission responded with the RESourceEU Action Plan in December 2025, including an early 2026 Critical Raw Materials Centre and plans to mobilize up to EUR 3 billion (USD 3.3 billion) for alternative supply projects within 12 months. A second line of mitigation is emerging through projects such as REESilience and through the expansion of non-Chinese rare-earth processing options in Estonia, Norway, Finland, and Sweden. Even so, these alternatives will take time to scale, which means many mid-tier manufacturers still face margin risk when they compete against vertically integrated Asian suppliers on price. Until upstream diversification becomes commercially meaningful, the Europe LED lighting market will continue to carry a supply-side vulnerability that can interrupt procurement timing and reduce pricing flexibility.
*Our forecasts treat driver/restraint impacts as directional, not additive. The impact forecasts reflect baseline growth, mix effects, and variable interactions.
Segment Analysis
By Product Type: Fixture-Led Compliance Keeps Value Concentrated In Luminaires
Luminaires and fixtures held 57.63% of the Europe LED lighting market share in 2025, which kept this category firmly ahead of lamps in value terms. This lead reflects the shift from lamp-only replacement toward integrated fixture upgrades, where compliance, controls, and service life are assessed at the full-product level rather than through a simple source swap. The Europe LED lighting market has therefore moved more of its value into complete luminaire systems, especially in commercial and public projects where specification, installation time, and documentation all matter. Zumtobel’s TECTON II modular continuous-row system showed how suppliers are competing on labor efficiency as much as on output, with a stated 71% saving in installation time compared with conventional configurations.[3]Zumtobel Group, “Capital Market Story,” Zumtobel Group, z.lightingThat matters in a market where contractor availability, compliance paperwork, and retrofit downtime often shape procurement decisions as much as unit cost.
The lamps segment is smaller, but it is still forecasted to grow at a 5.02% CAGR through 2031, which makes it the fastest-moving product category in the Europe LED lighting market. This growth is tied to the replacement of banned fluorescent formats and to municipal programs that continue to remove older sodium and conventional lighting points from public estates. The lamp category remains relevant where full fixture replacement is not yet necessary, or where operators want a staged conversion that limits immediate capital spend. Regulation (EU) 2019/2020 also keeps durability standards high, including lumen-maintenance requirements that screen out weaker products and support certified suppliers in public-sector buying. With more than 500,000 light-source models registered in EPREL, the Europe LED lighting industry remains deep and active, but quality verification has become easier for surveillance authorities and more visible for buyers.


By Distribution Channel: Online Growth Changes Buying Behavior But Not Project Control
Wholesale and retail held 46.12% share in 2025, which shows that distributor networks still anchor a large part of Europe LED lighting market activity. Electrical wholesalers remain important because they connect manufacturers with contractors, installers, and maintenance teams that still prefer local inventory support and technical guidance. Direct sales also remained important in the Europe LED lighting market, where large commercial, healthcare, airport, and municipal projects are specified by facility managers, consultants, or architects instead of off-the-shelf buyers. Those routes stay resilient because complex projects need design support, commissioning input, and after-sales accountability that broad online channels do not always provide. Even so, purchasing behavior is becoming more transparent and more standardized as product data has become easier to compare across brands.
E-commerce is forecasted to expand at a 5.45% CAGR through 2031, making it the fastest-growing route to market in the Europe LED lighting market size mix by channel. EPREL’s QR-based product information has helped this shift because buyers can verify performance and labeling data without relying only on distributor interpretation. The downside is that online comparison makes non-connected LED products easier to commoditize, which can compress pricing for suppliers that compete mainly on basic hardware. Connected luminaires still resist full disintermediation because configuration, controls integration, and commissioning software often require dealer-backed or manufacturer-led workflows. As Digital Product Passport rules move closer, the Europe LED lighting market is likely to sort itself more clearly between simple products that sell on transparent digital comparison and system-led products that still depend on specification and support.
By Installation Type: Retrofit Keeps Leading And Still Has Room To Run
Retrofit installation held 62.23% share in 2025 and is also forecasted to grow at a 5.36% CAGR through 2031, which makes it both the largest and fastest-growing installation type in the Europe LED lighting market. That combination shows that retrofit demand is not close to saturation, even after years of LED adoption across the region. The ongoing replacement of fluorescent and older conventional systems continues to feed the Europe LED lighting market through offices, retail estates, industrial buildings, healthcare sites, and public infrastructure. A shopping-center retrofit at Hvidovre C in Denmark used AI-led scanning and custom LED inserts to reduce installation time by 8 minutes per unit and cut energy use by 56% without sensor controls. When Casambi wireless daylight regulation was added, the same project reached 72% energy savings, which shows why retrofit projects are increasingly being designed as control-enabled upgrades rather than simple equipment changes.
New installation still matters, but it has been more exposed to the weak cycle in European commercial construction that several listed suppliers cited in their 2025 reporting. That pressure has limited the near-term share of greenfield projects in the Europe LED lighting market, especially in offices and discretionary commercial builds. The revised Energy Performance of Buildings Directive will change that from 2027 onward as larger new buildings move toward mandatory automated lighting controls.[4]Signify, “A Solution for Light and JUNG Elevate Intelligent Building Control to the Next Level,” Signify, signify.comThis means new installation should become a stronger specification-led demand stream later in the forecast period, even if retrofits remain dominant in the Europe LED lighting market. For now, retrofit remains the clearest proof that older building stock continues to hold a large and practical conversion opportunity across the region.
By Application: Offices Hold Scale While Horticulture Builds The Fastest Niche
Commercial offices accounted for 29.12% of the Europe LED lighting market size in 2025, which kept them as the largest application area. This position reflects the overlap between occupancy-driven energy management, workplace modernization, and corporate reporting requirements that keep offices high on retrofit budgets. A connected public-lighting project in Gothenburg deployed more than 38,000 light points and achieved up to 80% energy savings while halving operating costs, which has become a visible reference point for office and urban property managers comparing control-led LED systems. The Europe LED lighting market continues to treat commercial sites as the main installed base for system upgrades because offices concentrate long operating hours, multi-zone control needs, and energy reporting priorities. Retail, hospitality, industrial, hospitals, roadway, and residential projects are also advancing, but they are doing so at their own replacement pace rather than through a single common trigger.
Horticulture gardens are forecasted to grow at a 5.29% CAGR through 2031, making them the fastest-growing application in the Europe LED lighting market. The Netherlands and Germany absorbed more than EUR 1.5 billion (USD 1.6 billion) in vertical farming and indoor agriculture investment by 2024, which has kept horticultural lighting demand on a strong upward path. Signify’s GreenPower LED Toplighting Force 2.0 reached 2.7 µmol/J in PAR efficacy and was associated with a reported 25% yield improvement and 50% energy reduction against high-pressure sodium systems. This part of the Europe LED lighting market is still smaller in base, but it carries better technical differentiation because crop output, spectral tuning, and energy efficiency all matter directly to operating economics. Roadway and architectural applications also remain active because smart-city procurement continues to bundle energy savings with controls, data collection, and maintenance efficiency in public projects.
By End User: Indoor Volume Leads While Outdoor and Automotive Capture Premium Demand
Indoor end users held 54.11% of the Europe LED lighting market in 2025, supported by the scale of commercial offices, retail sites, factories, hospitals, and other interior installations. This segment continues to dominate because indoor projects carry broad replacement needs and because automation, occupancy sensing, and space optimization are easier to integrate at the building level. The indoor base also gives suppliers a steady route into service contracts and controls software, which helps protect value in the Europe LED lighting market even when hardware pricing weakens. Yet growth is moving faster outside, where public lighting and mobility-related projects are adding new layers of certification and connectivity. The indoor segment remains the scale anchor, but it no longer defines the entire value frontier of the Europe LED lighting market.
Outdoor is forecasted to grow at a 5.51% CAGR through 2031, which makes it the fastest-moving end-user group in the Europe LED lighting market size by end use. Kraków’s smart-public-lighting tender required ENEC, ENEC+, Zhaga D4i, and TALQ certifications for luminaires and controllers, which shows how specification standards are tightening in outdoor procurement. Automotive lighting adds another premium layer, with ams-OSRAM holding the number 1 position in packaged LEDs and in automotive LEDs in 2025, while its EVIYOS HD25 platform generated design wins above EUR 500 million (USD 545 million). FORVIA HELLA also launched its FlatLight daytime running light in October 2025, delivering 40% higher energy efficiency and an 80% reduction in module weight compared with conventional DRL systems. Together, outdoor and automotive activity show that the Europe LED lighting market is finding some of its strongest margin support in applications where photonics, controls, and compliance are harder to commoditize.
Geography Analysis
Germany held 22.14% of the European LED lighting market share in 2025, making it the largest country market in the region. The country benefits from strong regulatory enforcement, a deep professional lighting base, and commercial buyers that increasingly treat connected LED systems as standard equipment rather than optional upgrades. Fagerhult formally entered Germany in March 2025 with Organic Response as a standard office offering, demonstrating how suppliers view the market as central to control-led growth. Zumtobel’s Four Towers project in Frankfurt, valued at EUR 9 million (USD 9.8 million), also reflects the high-specification nature of large German commercial developments. The United Kingdom, France, Italy, and Spain make up the next major tier, with the UK drawing projects such as Zumtobel’s Gatwick Airport work, France organizing industry support around Digital Product Passport obligations, and Italy maintaining a design-led premium through brands such as iGuzzini and Disano.
Poland is forecasted to grow at a 5.62% CAGR through 2031, making it the fastest-growing national segment in the Europe LED lighting market. A major reason is the funding structure behind public modernization, where EU-linked support can cover up to 85% of capital outlays for street-lighting upgrades under the National Recovery Plan. Warsaw’s smart-lighting system manages 47,700 luminaires, saves PLN 36 million (USD 9 million) each year, and avoids 23,000 tonnes of CO2 emissions, which gives municipal buyers a visible benchmark for scale deployment. A JRC study on a Polish city also found that replacing 80,000 sodium lamps with LED systems and controls reduced annual electricity use from 28.4 GWh to 10.5 GWh and cut CO2 emissions from 22,908 tonnes to 8,461 tonnes.[5]Joint Research Centre, “Update on Status of Solid-State Lighting and Smart Lighting Systems,” European Commission, publications.jrc.ec.europa.euThe Netherlands, Sweden, and the broader Nordics remain the region’s leading test bed for DC micro-grid lighting, as shown by the N470 project in South Holland, which delivered 10% energy savings, used 35% less copper, and met 50% of annual energy needs from renewables.
The Rest of Europe is also contributing through EU-backed modernization work in markets such as Bulgaria and Romania, where procurement structures are increasingly tied to guaranteed energy-efficiency outcomes. Sofia’s Vitosha District awarded an ESCO-style street-lighting modernization contract worth EUR 1,735,145 (USD 1,891,308) in February 2026, which shows how performance-based models are spreading beyond the largest Western European economies. The Netherlands also added a knowledge-building example in March 2025 when Nieuw Reijerwaard commissioned a 340-pole DC LED street-lighting system powered by 125 rooftop solar panels and repurposed automotive battery storage. Russia remains outside the practical flow of the Europe LED lighting market because sanctions since 2022 have limited its role in mainstream European supply chains and project activity.
Competitive Landscape
The Europe LED lighting market remains moderately concentrated in the upper tier, where large solution providers compete through brands, control platforms, service models, and long project histories. Signify reported EUR 5,765 million (USD 6,284 million) in 2025 sales and an installed base of 167 million connected light points, which shows the scale advantage available to suppliers that combine hardware with software and services. Fagerhult Group reported MSEK 7,891 (USD 726 million) in 2025 net sales, with 80% of revenue generated in Europe, reinforcing its strong regional focus across infrastructure, healthcare, and outdoor applications. The competitive center of gravity in the Europe LED lighting market is shifting upward into data and building intelligence, where platforms such as Interact and Keyture aim to monetize occupancy analytics, maintenance data, and space-use visibility. Fagerhult’s patented Organic Response sensor cluster and ISO 27001 certification show how firmware, cybersecurity, and controls integration are becoming more defensible than basic chip efficiency in the professional segment.
Below that upper tier, the Europe LED lighting market is far more fragmented and much more exposed to price pressure in standard, non-connected products. The presence of more than 1,000 specialist manufacturers across LightingEurope’s broader ecosystem keeps the market active and innovative, but it also limits the ability of mid-tier firms to defend margins when cheaper imports intensify competition. Chinese overcapacity redirected toward Europe has increased that pressure, especially in categories where connectivity and lifecycle documentation are weak differentiators. ams-OSRAM’s Simplify program, which targets EUR 200 million (USD 218 million) in run-rate savings by FY 2028 and includes a 2,000-role reduction with around half in Europe, shows how serious the restructuring challenge has become in the component tier. Compliance with WEEE, ecodesign, and future digital traceability rules is likely to reinforce this divide because larger suppliers can spread those overheads across wider product portfolios and installed bases.
Strategic moves across 2025 and 2026 show that the Europe LED lighting market is responding through focus, partnerships, and targeted capability expansion. Fagerhult’s acquisition of Capelon in July 2025 gave it a stronger smart-outdoor platform in Sweden and a route into wider Nordic expansion. Signify’s March 2026 partnership with JUNG linked Interact lighting controls with smart heating thermostats, pushing the company further into EPBD-aligned building solutions rather than stand-alone luminaires.[6]Signify, “A Solution for Light and JUNG Elevate Intelligent Building Control to the Next Level,” Signify, signify.com ams-OSRAM’s sale of its non-optical analog and mixed-signal sensor business for EUR 570 million (USD 621.3 million) sharpened its focus on digital photonics and automotive LED leadership, which is a clear sign that portfolio concentration is becoming as important as scale in the Europe LED lighting market.
Europe LED Lighting Industry Leaders
Signify N.V.
Zumtobel Group AG
Osram Licht AG (ams-Osram)
Schreder SA
Fagerhult Group
- *Disclaimer: Major Players sorted in no particular order

Recent Industry Developments
- April 2026: Fagerhult upgraded its indoor luminaire range to Flip Chip LED technology, reducing annual GHG emissions by an estimated 2,250 tonnes CO2e per year. The change improves luminous efficacy by 5-10% and extends rated operating time from 50,000 to 100,000 hours without a cost increase to customers, establishing a new benchmark for lifecycle carbon in high-volume commercial luminaires.
- November 2025: ams-OSRAM launched OSLON Compact RM, a 1,000-lumen, 1 mm² emitter enabling pixel-level adaptive beams for automotive headlamps.
- November 2025: OPPLE Lighting Europe unveiled nine luminaire families rated to 170 lm/W, sold exclusively via e-commerce to target cost-sensitive city projects.
- September 2025: Signify rolled out SunStay Pro gen2 solar streetlights that integrate PV panels, batteries, and LEDs into a single mast, trimming total cost by 40% versus grid-tied equivalents.


Europe LED Lighting Market Report Scope
The Europe LED lighting market comprises the production, distribution, and adoption of energy-efficient lighting solutions based on light-emitting diode (LED) technology across residential, commercial, industrial, infrastructure, and automotive applications. The market is driven by increasing energy-efficiency regulations, smart-city initiatives, sustainability targets, and the replacement of conventional lighting technologies with connected and digitally controlled LED systems. Growth is further supported by rising investments in retrofit projects, intelligent lighting controls, and human-centric lighting solutions that improve operational efficiency and reduce energy consumption.
The Europe LED Lighting Market Report is Segmented by Product Type (Lamps, and Luminaires/Fixtures), Distribution Channel (Direct Sales, Wholesale/Retail, and E-Commerce), Installation Type (New Installation, and Retrofit Installation), Application (Commercial Offices, Retail, Hospitality, Industrial, Highway and Roadway, Architectural, Public Places, Hospitals, Horticulture Gardens, Residential, Automotive, and More), End User (Indoor, Outdoor, and Automotive), and Country (Germany, United Kingdom, France, Italy, Spain, Netherlands, Sweden, Poland, and the Rest of Europe). The Market Forecasts are Provided in Terms of Value (USD).
| Lamps |
| Luminaires / Fixtures |
| Direct Sales |
| Wholesale / Retail |
| E-Commerce |
| New Installation |
| Retrofit Installation |
| Commercial Offices |
| Retail Stores |
| Hospitality |
| Industrial |
| Highway and Roadway |
| Architectural |
| Public Places |
| Hospitals |
| Horticulture Gardens |
| Residential |
| Automotive |
| Other Applications (Chemicals, Oil and Gas, Agriculture) |
| Indoor |
| Outdoor |
| Automotive |
| Germany |
| United Kingdom |
| France |
| Italy |
| Spain |
| Netherlands |
| Sweden |
| Poland |
| Rest of Europe |
| By Product Type | Lamps |
| Luminaires / Fixtures | |
| By Distribution Channel | Direct Sales |
| Wholesale / Retail | |
| E-Commerce | |
| By Installation Type | New Installation |
| Retrofit Installation | |
| By Application | Commercial Offices |
| Retail Stores | |
| Hospitality | |
| Industrial | |
| Highway and Roadway | |
| Architectural | |
| Public Places | |
| Hospitals | |
| Horticulture Gardens | |
| Residential | |
| Automotive | |
| Other Applications (Chemicals, Oil and Gas, Agriculture) | |
| By End User | Indoor |
| Outdoor | |
| Automotive | |
| By Country | Germany |
| United Kingdom | |
| France | |
| Italy | |
| Spain | |
| Netherlands | |
| Sweden | |
| Poland | |
| Rest of Europe |


Market Definition
- INDOOR LIGHTING - It incorporates all LED based lamps and fixtures/luminaire that are used to illuminate indoor section of residential, commercial, industrial buildings and agricultural lighting. LED offers efficient brightness with higher durability in comparison to other lighting technology.
- OUTDOOR LIGHTING - It incorporates the LED lighting fixtures that is used for illumination for exterior/outdoor illumination. For instance, LED lighting fixtures used to illuminate streets and highways, transport hubs, stadiums and other public places such as parking spaces.
- AUTOMOTIVE LIGHTING - It refers to the lighting fixtures installed for illumination and signaling purposes. It is used in both exterior and interior lighting of the vehicle. Headlamps, fog lamp, daytime running light (DRLs) are examples of exterior light whereas cabin light are interior lights.
- END USER - It refers to the end use application area where the LED fixture will be installed. For instance, in terms of indoor lighting, we have residential, commercial and industrial as end user category. For automotive lighting, primary end user considered are automotive manufacturers and aftermarket sale
| Keyword | Definition |
|---|---|
| Lumen | Lumen is a unit of luminous flux in the International System of Units that is equal to the amount of light given out through a solid angle by a source of one-candela intensity radiating equally in all directions. |
| Footcandle | A foot-candle (or foot-candle, fc, lm/ft2, or ft-c) is a measurement of light intensity. One foot-candle is defined as enough light to saturate a one-foot square with one lumen of light. |
| Colour Rendering Index (CRI) | Color Rendering Index (CRI) is a measurement of how natural colors render under an artificial white light source when compared with sunlight. The index is measured from 0-100, with a perfect 100 indicating that colors of objects under the light source appear the same as they would under natural sunlight. |
| Luminous flux | Luminous flux is a measure of the power of visible light produced by a light source or light fitting. It is measured in lumens (lm). |
| Annual Energy Cost | Annual Energy Cost means the average daily energy consumption multiplied by 365 (days per year), expressed in kilowatt hour per year (kWh/a). |
| Constant voltage drivers | Constant voltage drivers are designed for a single direct current (DC) output voltage. Most common constant voltage drivers (or Power Supplies) are 12VDC or 24VDC. An LED light that is rated for constant voltage usually specifies the amount of input voltage it needs to operate correctly. |
| Constant Current Driver | Constant current LED drivers are designed for a designated range of output voltages and a fixed output current (mA). LEDs that are rated to operate on a constant current driver require a designated supply of current usually specified in milliamps (mA) or amps (A). These drivers vary the voltage along an electronic circuit which allows current to remain constant throughout the LED system. |
| Minimum Energy Performance Standards (MEPS) | Minimum Energy Performance Standards specify the minimum level of energy performance that appliances and equipment must meet or exceed before they can supply or used for commercial purposes. |
| Luminous Efficacy | Luminous efficacy is a measurement commonly used in the lighting industry that indicates the ability of a light source to emit visible light using a given amount of power. |
| Solid State Lighting | Solid-state lighting (SSL) is a type of lighting that uses semiconductor light-emitting diodes (LEDs), organic light-emitting diodes (OLED), or polymer light-emitting diodes (PLED) as sources of illumination rather than electrical filaments, plasma (used in arc lamps such as fluorescent lamps), or gas. |
| Rated Lamp Life | Lamp life, also referred to as rated life, is the time in hours a lamp will last before a percentage of lamps will burn out. |
| Color Temperature | Colour temperature is a scale that measures how ‘warm’ (yellow) or ‘cool’ (blue) the light from a particular source is. It is measured in degrees of the Kelvin scale (abbreviated to K), and the higher the number, the ‘cooler’ the light. The lower the ‘K’ number, the ‘warmer’ the light. |
| Ingress Protection rating (IP rating) | The IP (Ingress Protection) rating of a bulb or light fixture declares the level of protection it has against dirt and water. |
| Fidelity Index | The general colour fidelity index, Rf, represents how closely the colour appearances of the entire sample set are reproduced (rendered) on average by a test light as compared to those under a reference illuminant. |
| Gamut Index | The gamut area is defined as “the area enclosed by a set of test color samples illuminated by a light source, in a two-dimensional chromaticity diagram or a plane of color space.”1 Within a defined color space, a “gamut” describes the subset of colors that can be perceived under specific lighting conditions. |
| Binning | In the lighting industry, the act of "binning" of LEDs is the process of sorting LEDs by certain characteristics, such as color, voltage, and brightness. |
| Accent lighting | Accent lighting, also called highlighting, emphasizes objects by focusing light directly on them. Accent lighting is used inside and outside the home to feature locations such as an entrance or to create dramatic effects. |
| Dimmable driver | A dimming driver has two functions: As a driver, it converts the 230V AC mains input to a low voltage DC output. As a dimmer, it reduces the amount of electrical energy flowing to the LEDs, thereby causing them to dim. |
| Flicker | Flicker is the repeated and frequent variation in the output of a light source over time. |
| Fluorescent | A property of materials defined as the ability to emit light after absorbing electromagnetic radiation such as visible or UV light. |
| Candela | The candela is the unit of luminous intensity in the International System of Units. It measures the light output per unit solid angle emitted from a light source in a specific direction. |
| LUX | Lux is used to measure the amount of light output in a given area - one lux is equal to one lumen per square meter. It enables us to measure the total "amount" of visible light present and the intensity of the illumination on a surface. |
| Uniformity (U0) | The uniformity of lighting has significant effects on visual performance in both indoor and outdoor areas. Uniformity (represented as U0) value can be found by dividing the minimum brightness (Emin) resulting from calculations according to the current lighting order, to the average brightness value (Eavg). |
| Visible Light Spectrum | The visible light spectrum is the segment of the electromagnetic spectrum that the human eye can view. More simply, this range of wavelengths is called visible light. Typically, the human eye can detect wavelengths from 380 to 700 nanometers. |
| Ambient Temperature | Ambient Temperature is the temperature of the air surrounding an electrical enclosure. |
| Current-controlled dimming control | Current-controlled dimming controls LED brightness by varying the applied current using a 0-10V dimmer. Current-controlled dimming is smooth and HD-video friendly. It can only dim to a minimum of 5% of light output. |
| Design Light Consortium | It is a partnership of energy efficiency stakeholders in the United States and Canada to “promote quality, performance and energy efficient lighting solutions for the commercial sector”. |
| Pulse Width Modulation | Pulse-width modulation, or pulse-duration modulation, is a method of controlling the average power delivered by an electrical signal. |
| Surface Mounted Device | A surface mount device (SMD) is an electronic device whose components are mounted or placed directly on the surface of a printed circuit board. |
| Alternating Current | Alternating current is an electric current which periodically reverses direction and changes its magnitude continuously with time, in contrast to direct current, which flows only in one direction. |
| Direct Current | Direct current (DC) is an electric current that is uni-directional, so the flow of charge is always in the same direction. |
| Beam Angle | Beam angle (also called beam spread) is a measure of how light is distributed. On any plane perpendicular to the centerline of the light, the beam angle is the angle between two rays where the light intensity is 50% of the maximum light intensity. |
| LED Based Solar High Mast Lighting Systems | A Solar LED High Mast Light is a raised source of High illumination lights (6~8 lights) and with high intensity on the middle of major junctions (Ring roads, Outer Ring roads), turned on or lit automatically in the absence of light (at specified timings or at periodic times, every night). |
| Surface Mounted Diode (SMD) LEDs | A surface mount diode is a type that emits light and is flat mounted and soldered onto a circuit board. |
| Chip on Board (COB) LEDs | A COB LED is basically multiple LED chips (usually 9 or more) glued directly onto a substrate by the manufacturer to form a single module. |
| Dual In-Line Package (DIP) LEDs | A dual in-line package (DIP or DIL) is an electronic component package with a rectangular case and two parallel rows of electrical connector pins. |
| Graphene LED Lights | A graphene LED light bulb is simply an LED light bulb where the filament has been coated in graphene. A graphene LED bulb is reported to be 10% more efficient than regular LED light bulbs and they are cheaper to manufacture and buy. |
| LED Corn Bulbs | LED Corn lights are designed as an energy efficient alternative to high intensity discharge (HID) and SON lamps. It uses a large number of LEDs on a metal structure to provide sufficient light. This arrangement of LEDs looks a lot like a corn cob, hence the name "corn light". |
| Per Capita Income | Per capita income or total income measures the average income earned per person in a given area in a specified year. It is calculated by dividing the area's total income by its total population. Per capita income is national income divided by population size. |
| Charging Stations | A charging station, also known as a charging station or electric vehicle utility, is a power supply that provides electrical energy for charging plug-in electric vehicles. |
| Headlight | A headlight is a light that is mounted on the front of a car and illuminates the road in front of it. Low beam and high beam LED headlights are additional categories for these LED headlights. |
| Day Time Running Light (DRLs) | A daytime running lamp is a white, yellow, or amber lighting device mounted on the front of a road-going motor vehicle or bicycle. |
| Directional Signal Light | Directional signal lights are the front and rear lights on an automobile that flash to show the direction of a turn. |
| Stop Light | A red light that is mounted to the back of a car and turns on when the brakes are used to show that the car is stopped. |
| Reverse Light | The reverse light is at the back of the vehicle to indicate its backward motion. |
| Tail Light | A red light that can be seen in the dark is mounted on the rear of a road vehicle. Stop, reverse, and directional signal lights are all part of it. |
| Fog Light | Bright lights in automobiles used to increase visibility on the road in foggy conditions or to warn other drivers of the presence of the vehicle. |
| Passenger Vehicle | A passenger vehicle is a road vehicle, other than a moped or a motorcycle, intended for the transportation of people and designed for up to 8 to 9 seats. |
| Commercial Vehicle | A commercial vehicle (Bus, Truck, Van) is any type of motor vehicle used to transport goods or pay passengers. |
| Two Wheelers (2W) | A two-wheeler is a vehicle that runs on two wheels. |
| Streets & Roadways | Both roads and streets refer to hard, flat surfaces on the ground on which vehicles, people, and animals can travel. Since streetways are usually in cities and towns, they often have houses and buildings on both sides. The roadway is in the countryside and sometimes passes through forests and fields |
| Horticulture Lighting | Horticulture is the science and art of sustainably growing, producing, marketing and using high quality, intensively cultivated food and ornamental plants. |


Research Methodology
Mordor Intelligence has followed the following methodology in all our data center reports.
- Step 1: Raw Data Collection: To understand the market, initially, all crtical data points were identified. Critical information about countries and regions of interest including Per-capita Income, Population, Automotive Production, Interest rate on Auto-Loans, Number of Automobiles on Road, Total LED Import, Lighting Electricity Consumption among others were recorded or estimated based on internal calculations.
- Step 2: Identify Key Variables: To build a robust forecasting model, key variables such as Number of Households, Automotive Production, Road Networks among others were identified. Through an iterative process, the variables required for the market forecast were set, and the model was built using these variables.
- Step 3: Build a Market Model: Based on data and critical industry trend data (variables), including LED pricing, LED penetration rate, and project macro and micor economic factors were utilized for building the market forecasting.
- Step 4: Validate and Finalize: In this crucial step, all market numbers and variables derived through an internal mathematical model were validated through an extensive network of primary research experts from all the markets studied. The respondents are selected across levels and functions to generate a holistic picture of the market studied.
- Step 5: Research Outputs: Syndicated Reports, Custom Consulting Assignments, Databases & Subscription Platforms


