Market Overview
| Study Period | 2020 - 2031 |
|---|---|
| Forecast Data Period | 2026 - 2031 |
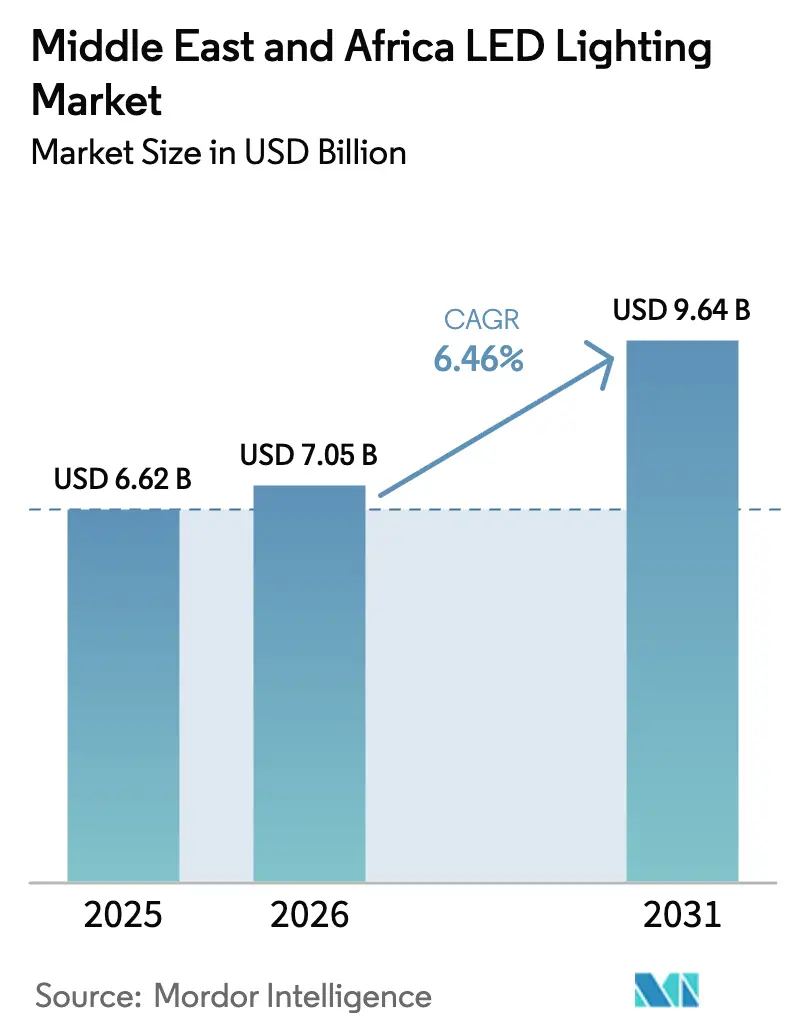
| Base Year Market Size (2025) | USD 6.62 Billion |
| Market Size (2026) | USD 7.05 Billion |
| Market Size (2031) | USD 9.64 Billion |
| Growth Rate (2026 - 2031) | 6.46% CAGR |
| Market Concentration | Medium |
Major Players *Disclaimer: Major Players sorted in no particular order Image © Mordor Intelligence. Reuse requires attribution under CC BY 4.0. | |
Middle East And Africa LED Lighting Market Analysis by Mordor Intelligence
The Middle East and Africa LED lighting market size was valued at USD 6.62 billion in 2025 and estimated to grow from USD 7.05 billion in 2026 to reach USD 9.64 billion by 2031, at a CAGR of 6.46% during the forecast period (2026-2031). Policymakers now mandate high-efficiency luminaires, smart-city budgets are accelerating public lighting upgrades, and commercial buyers view LED retrofits as quick cost-reduction projects. Solar mini-grids in Sub-Saharan Africa further widen the addressable base because low-wattage LED loads maximize the utilization of generation assets. Competitive intensity remains moderate as European incumbents, regional assemblers, and cost-driven Chinese brands pursue distinct value propositions. Volatility in foreign exchange rates and grey-market inflows challenge profitability; however, falling component prices and ESG financing incentives continue to underpin the steady penetration of LED solutions across indoor and outdoor applications.
Key Report Takeaways
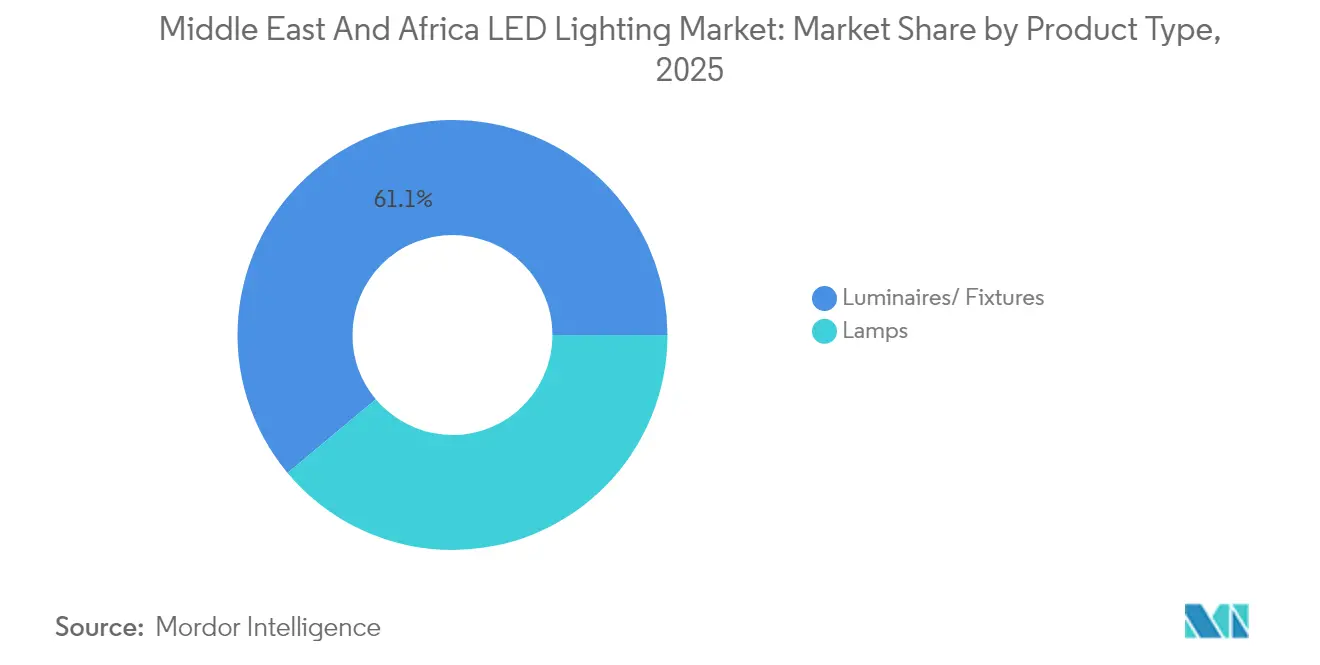
- By product type, luminaires captured 61.08% of the the Middle East and Africa's LED lighting market share in 2025,, while lamps advanced at an 7.94% CAGR through 2031.
- By distribution channel, wholesale and retail held 52.93% of the Middle East and Africa LED lighting market size in 2025; e-commerce is projected to rise at a 6.78% CAGR through 2031.
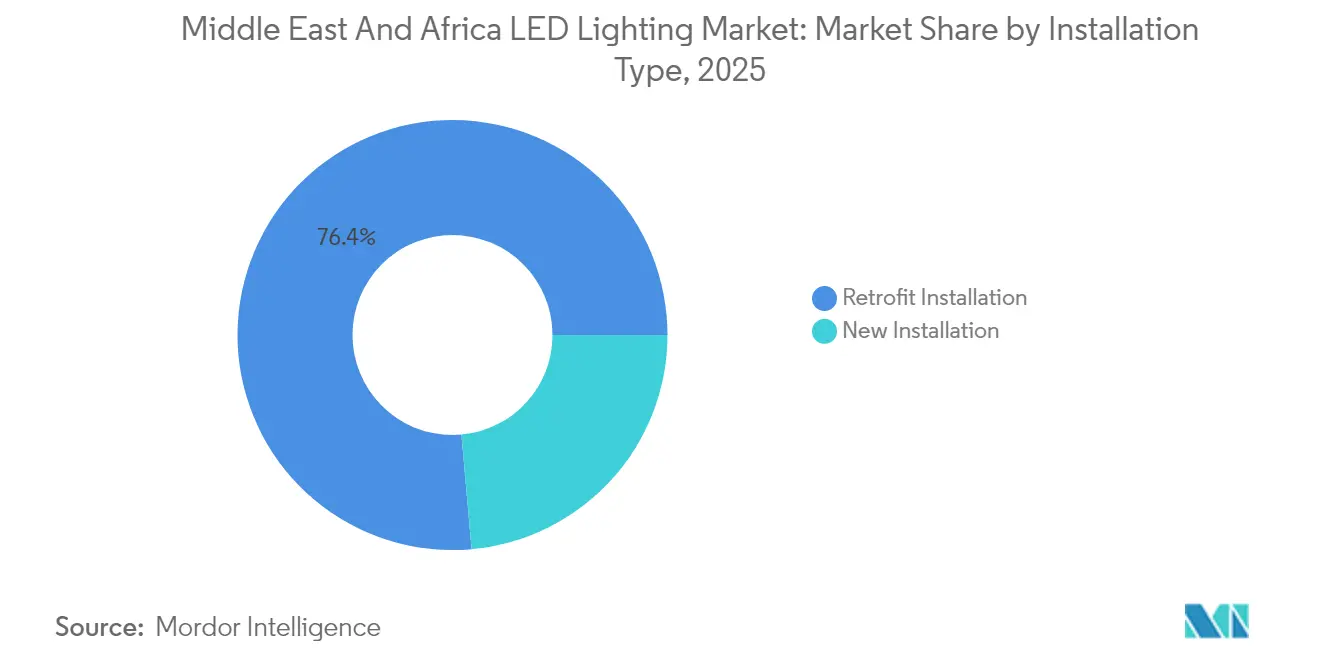
- By installation type, retrofit projects accounted for a 76.42% share of the Middle East and Africa LED lighting market size in 2025, and new installations are projected to grow at a 6.95% CAGR through 2031.
- By application, residential accounted for 18.63% of market revenue in 2025, while highway and roadway lighting is projected to expand at a 8.96% CAGR to 2031.
- By end user, indoor settings represented 61.45% market share in 2025, whereas outdoor deployments exhibit the fastest 8.38% CAGR through 2031.
- By region, the Middle East dominated with a 64.92% share in 2025, and Africa is forecast to post a 7.18% CAGR through 2031.
Note: Market size and forecast figures in this report are generated using Mordor Intelligence’s proprietary estimation framework, updated with the latest available data and insights as of 2026.
Middle East And Africa LED Lighting Market Trends and Insights
Drivers Impact Analysis*
| Driver | (~) % Impact on CAGR Forecast | Geographic Relevance | Impact Timeline |
|---|---|---|---|
| Government energy-efficiency regulations and bulb phase-outs | +1.8% | Middle East core, expanding to North Africa | Medium term (2-4 years) |
| Rapid smart-city and infrastructure projects across the GCC | +1.5% | GCC states, UAE, and Saudi Arabia leadership | Short term (≤ 2 years) |
| Declining LED costs are improving ROI for commercial buyers | +1.2% | Global, strongest in price-sensitive MEA markets | Long term (≥ 4 years) |
| Hospitality build-outs for mega-events | +0.9% | Saudi Arabia, Qatar, UAE event destinations | Medium term (2-4 years) |
| Off-grid solar-LED demand in Sub-Saharan mini-grids | +0.7% | Sub-Saharan Africa rural and peri-urban areas | Long term (≥ 4 years) |
| ESG-linked real-estate loans mandating green lighting | +0.5% | Urban centers across MEA | Medium term (2-4 years) |
| Source: Mordor Intelligence | |||


Government Energy-Efficiency Regulations and Bulb Phase-Outs Drive Market Transformation
Mandatory codes now require high-lumen-per-watt fixtures in new buildings and major renovations across Saudi Arabia, Egypt, Qatar, and Lebanon. Saudi Arabia’s SBC 601 sets a 45 lumens-per-watt floor for exterior lighting, effectively making LED the only compliant technology.[1]National Fire Protection Association, “What Changes Are in Store for the 2025 Edition of NFPA 72?,” nfpa.org Egypt’s performance-contracting model finances large-scale retrofits, while Qatar University achieved 40% energy savings after a full-campus conversion. The World Bank’s ESMAP findings reinforce codes as the strongest lever for regional lighting efficiency, encouraging buyers to opt for certified vendors that can meet quality standards. A typical two- to three-year compliance window enables suppliers to plan their capacity and logistics effectively.
Smart-City Projects Across GCC Create Infrastructure Demand Surge
Dubai completed 140,000 sensor-enabled streetlight upgrades in 2024, which halved municipal energy consumption and added traffic and air quality monitoring functions. Abu Dhabi’s adaptive network already covers 85% of urban areas, and Saudi Arabia’s New Murabba allocates USD 2.8 billion for connected lighting. These projects favor vendors offering interoperability with broader city platforms, locking in multiyear service revenues while pushing average selling prices above commodity levels. Implementation cycles of three to five years deliver a predictable backlog for system integrators.
Declining LED Costs Improve Commercial ROI Calculations
Chinese fabs trimmed fixture costs by 15-20% in 2024 as chip-on-board architectures lowered bill-of-materials ratios.[2]Shenzhen Benwei Lighting, “The Cost Structure of LED Lamps,” benweilight.com LED chips now account for 20-40% of the total fixture cost, compared to more than 50% in early designs, reducing payback periods in power-subsidized Gulf states from four to five years to approximately two to three years. The global secondary replacement wave for luminaires installed between 2014 and 2016 added 5.8 billion units of demand in 2024, ensuring sustained volume for higher-efficiency retrofits.
Hospitality Build-Outs for Mega-Events Drive Premium Segment Growth
Saudi Arabia’s USD 800 billion tourism plan demands human-centric lighting across more than 100,000 hotel rooms, with NEOM and Red Sea projects specifying tunable white and circadian features. Stadiums being readied for the 2027 AFC Asian Cup require broadcast-grade fixtures that still cut energy use by 40%. Qatar’s post-World-Cup upgrades prioritize CRI above 90 in luxury properties, pushing premium luminaires that command 30-50% higher prices and showcase next-generation LED innovations.
Restraints Impact Analysis*
| Restraint | (~) % Impact on CAGR Forecast | Geographic Relevance | Impact Timeline |
|---|---|---|---|
| High upfront capital cost vs conventional lighting | -1.1% | Price-sensitive markets across MEA, rural areas | Short term (≤ 2 years) |
| Flood of low-quality grey-market imports | -0.8% | Import-dependent markets, weak regulatory enforcement | Medium term (2-4 years) |
| Weak after-sales and maintenance ecosystem | -0.6% | Sub-Saharan Africa, remote installations | Long term (≥ 4 years) |
| FX volatility and import restrictions on components | -0.4% | Currency-constrained markets | Short term (≤ 2 years) |
| Source: Mordor Intelligence | |||
High Upfront Capital Costs Limit Adoption in Price-Sensitive Segments
LED fixtures still cost three to five times more than fluorescent or HID alternatives, which complicates cash-flow planning for small businesses and households, despite offering better total ownership economics.[3]Building Research Establishment, “LED Lighting Cost-Benefit Analysis for Commercial Applications,” bre.co.uk Low electricity tariffs across the GCC, ranging from USD 0.007 to USD 0.08 per kWh, further stretch payback horizons and dampen urgency. Limited access to affordable credit in Sub-Saharan markets keeps many potential users on legacy lamps even when savings are clear, forcing vendors to pilot leasing and performance-contracting models.
Grey-Market Imports Undermine Quality Standards and Brand Value
Substandard luminaires lacking basic IEC certification reach consumers through informal traders and online marketplaces, often failing within 12-18 months, compared with the 25,000-plus-hour lifespans of certified products. The influx erodes confidence, drives warranty claims, and suppresses margins for reputable brands. Customs' capacity to test incoming shipments remains patchy, especially in smaller African economies, allowing low-quality supply chains to persist until enforcement frameworks tighten.
*Our forecasts treat driver/restraint impacts as directional, not additive. The impact forecasts reflect baseline growth, mix effects, and variable interactions.
Segment Analysis
By Product Type: Luminaires Lead Market with Retrofit Focus
Luminaires captured 61.08% of revenue in 2025 as commercial and institutional buyers favored complete systems that integrate optics, drivers, and controls. Smart luminaires featuring IoT connectivity lift average selling prices and help vendors secure service contracts. The lamps category is smaller but posts an 7.94% CAGR, supported by quick replacement cycles in residential and secondary retrofit projects.
The luminaires' advantage lies in their influence on project specifications among lighting designers who prefer turnkey performance. Dubai’s intelligent streetlighting program illustrates the premium buyers place on integrated solutions. Lamp growth accelerates in specialized niches, such as high-bay industrial retrofits, where plug-and-play convenience takes precedence over full fixture swaps. Both subsegments benefit from declining chip costs and standardized form factors that shorten installation time.


By Distribution Channel: Wholesale Dominance Faces E-Commerce Disruption
Wholesale retail retained a 52.93% share in 2025 thanks to long-standing relationships with electrical contractors and on-site technical support. Detailed spec work and just-in-time inventory make this model resilient. Direct sales serve mega-projects that require customization, but online platforms are growing at a 6.78% CAGR as catalog uniformity improves.
Major wholesalers, such as Signify, operate 92 outlets across the UAE, offering a combination of design guidance, credit facilities, and local warehousing. E-commerce is gaining traction in the small commercial and residential segments, where buyers prioritize price and convenience over engineering advice. Vendors are therefore adopting omnichannel strategies that blend online configurators with in-person commissioning services.
By Installation Type: Retrofit Projects Drive Market Growth
Retrofits accounted for 76.42% of the 2025 value, as the installed base of legacy lighting remains vast in public infrastructure and commercial real estate. Energy-performance contracts make financing easier by tying repayments to savings. New builds post a 6.95% CAGR as construction rebounds and LED becomes the baseline specification even for mid-tier developments.
Retrofit complexity ranges from bulb swaps to full wiring upgrades. Compliance with Saudi exterior-lighting rules accelerated retrofit demand in retail and hospitality properties seeking code alignment. New construction enables architects to integrate daylight sensors and addressable drivers at the design stage, resulting in higher lifetime efficiency and lower maintenance burdens.
By Application: Highway Lighting Leads Growth amid Diversification
Residential spaces account for 18.63% of revenue, reflecting ongoing consumer conversions; however, highway and roadway lighting is the fastest-growing use case, with a 8.96% CAGR. Municipalities view adaptive LED streetlights as anchors for traffic, safety, and environmental monitoring networks.
Dubai’s 140,000-unit deployment confirmed 50% energy savings, along with benefits from real-time data. Commercial offices, retail, and hospitality maintain healthy demand as occupancy-driven control schemes improve comfort and slash operating costs. Industrial sites utilize ruggedized luminaires to minimize downtime, while architectural landmarks employ dynamic color systems to enhance their aesthetic appeal.
By End User: Indoor Applications Face Outdoor Growth Challenge
Indoor environments retained a 61.45% share in 2025 owing to large volumes in offices, healthcare, education, and retail. These buyers value precise photometric control and emerging human-centric features. Outdoor deployments are growing at a rate of 8.38% CAGR, driven by city infrastructure budgets and the integration of video surveillance and telecom backhaul.
LEDVANCE’s BIOLUX system exemplifies advanced indoor priorities, including circadian tuning and wellness certification. Outdoor installations leverage durability and lower wattage to extend solar streetlight uptime, particularly in grid-constrained African municipalities. Automotive lighting stands out with its stringent safety and OEM qualification cycles, yet still benefits from LED miniaturization.
Geography Analysis
Middle East buyers supplied 64.92% of 2025 revenue, leveraging robust capital budgets and clear government mandates. Saudi Arabia’s Vision 2030 earmarked USD 2.8 billion for intelligent lighting, and the UAE completed 140,000 smart streetlights that now serve as regional benchmarks. Qatar channels post-World-Cup momentum into high-CRI hospitality fixtures, and Egypt’s energy-performance contracts unlock public-sector retrofits.
African markets offer the highest upside with a 7.18% CAGR to 2031. South Africa’s distributed solar capacity doubled to 6.1 GW in Q3 2024, prompting commercial sites to pair PV arrays with low-wattage luminaires for maximum self-consumption. Nigeria’s hybrid PV levelized cost of USD 0.106 per kWh makes solar-LED packages attractive for backup and mini-grid scenarios. East African programs financed by multilateral banks bundle LEDs into rural electrification kits that scale rapidly.
Divergent priorities shape procurement behavior: the Gulf emphasizes smart-city functionality and architectural aesthetics, whereas Sub-Saharan buyers focus on basic illumination and off-grid reliability. Currency swings and import duties complicate supply chains, yet shared goals of electrification and efficiency sustain long-term market expansion. Distribution networks deepen as regional assemblers localize production to offset freight costs and shorten lead times.
Competitive Landscape
The market structure remains moderately fragmented, with no single vendor accounting for more than a quarter of the regional market share. Signify leverages broad portfolios, 92 UAE outlets, and school-retrofit ventures such as Taqat Nour in Egypt. ams OSRAM differentiates through semiconductor innovation, debuting 25,600-pixel EVIYOS micro-LED arrays that target adaptive roadway projection.[4]ams OSRAM, “Light and Sensor Solutions at CES 2025,” ams-osram.com
Chinese manufacturers win cost-driven tenders by combining scale and aggressive pricing, but regional assemblers gain traction through faster delivery and compliance with local content rules. Lumileds’ USD 239 million acquisition by San’an Optoelectronics strengthens cross-licensing arrangements that could lower IP barriers for mass adoption.
White-space niches include solar-integrated poles for remote villages, human-centric healthcare fixtures, and horticulture solutions for controlled-environment farming. Certification breadth, after-sales support, and IoT-ready software ecosystems increasingly separate premium providers from commodity entrants.
Middle East And Africa LED Lighting Industry Leaders
Signify N.V.
ams OSRAM AG
Acuity Brands Lighting Inc.
Cree Lighting (Ideal Industries, Inc.)
Opple Lighting Co., Ltd.
- *Disclaimer: Major Players sorted in no particular order

Recent Industry Developments
- August 2025: San’an Optoelectronics acquired Lumileds for USD 239 million, entering global cross-licensing networks.
- May 2025: Havells Lighting launched its U.S. operations through a joint venture with Krut LED, introducing same-day shipping capability.
- December 2024: ams OSRAM introduced EVIYOS Shape micro-LED, winning CES 2025 Smart Cities Innovation honors.
- November 2024: Nagoya University revealed semi-polar crystal LEDs that cut efficiency droop for micro-display applications.


Middle East And Africa LED Lighting Market Report Scope
Agricultural Lighting, Commercial, Industrial and Warehouse, Residential are covered as segments by Indoor Lighting. Public Places, Streets and Roadways, Others are covered as segments by Outdoor Lighting. Daytime Running Lights (DRL), Directional Signal Lights, Headlights, Reverse Light, Stop Light, Tail Light, Others are covered as segments by Automotive Utility Lighting. 2 Wheelers, Commercial Vehicles, Passenger Cars are covered as segments by Automotive Vehicle Lighting.By Product Type
| Lamps |
| Luminaires / Fixtures |
By Distribution Channel
| Direct Sales |
| Wholesale Retail |
| E-commerce |
By Installation Type
| New Installation |
| Retrofit Installation |
By Application
| Commercial Offices |
| Retail Stores |
| Hospitality |
| Industrial |
| Highway and Roadway |
| Architectural |
| Public Places |
| Hospitals |
| Horticulture Gardens |
| Residential |
| Automotive |
| Others (Chemicals, Oil and Gas, Agriculture) |
By End User
| Indoor |
| Outdoor |
| Automotive |
By Region
| Middle East | Saudi Arabia |
| United Arab Emirates | |
| Qatar | |
| Egypt | |
| Rest of Middle East | |
| Africa | South Africa |
| Nigeria | |
| Rest of Africa |
| By Product Type | Lamps | |
| Luminaires / Fixtures | ||
| By Distribution Channel | Direct Sales | |
| Wholesale Retail | ||
| E-commerce | ||
| By Installation Type | New Installation | |
| Retrofit Installation | ||
| By Application | Commercial Offices | |
| Retail Stores | ||
| Hospitality | ||
| Industrial | ||
| Highway and Roadway | ||
| Architectural | ||
| Public Places | ||
| Hospitals | ||
| Horticulture Gardens | ||
| Residential | ||
| Automotive | ||
| Others (Chemicals, Oil and Gas, Agriculture) | ||
| By End User | Indoor | |
| Outdoor | ||
| Automotive | ||
| By Region | Middle East | Saudi Arabia |
| United Arab Emirates | ||
| Qatar | ||
| Egypt | ||
| Rest of Middle East | ||
| Africa | South Africa | |
| Nigeria | ||
| Rest of Africa | ||


Market Definition
- INDOOR LIGHTING - It incorporates all LED based lamps and fixtures/luminaire that are used to illuminate indoor section of residential, commercial, industrial buildings and agricultural lighting. LED offers efficient brightness with higher durability in comparison to other lighting technology.
- OUTDOOR LIGHTING - It incorporates the LED lighting fixtures that is used for illumination for exterior/outdoor illumination. For instance, LED lighting fixtures used to illuminate streets and highways, transport hubs, stadiums and other public places such as parking spaces.
- AUTOMOTIVE LIGHTING - It refers to the lighting fixtures installed for illumination and signaling purposes. It is used in both exterior and interior lighting of the vehicle. Headlamps, fog lamp, daytime running light (DRLs) are examples of exterior light whereas cabin light are interior lights.
- END USER - It refers to the end use application area where the LED fixture will be installed. For instance, in terms of indoor lighting, we have residential, commercial and industrial as end user category. For automotive lighting, primary end user considered are automotive manufacturers and aftermarket sale
| Keyword | Definition |
|---|---|
| Lumen | Lumen is a unit of luminous flux in the International System of Units that is equal to the amount of light given out through a solid angle by a source of one-candela intensity radiating equally in all directions. |
| Footcandle | A foot-candle (or foot-candle, fc, lm/ft2, or ft-c) is a measurement of light intensity. One foot-candle is defined as enough light to saturate a one-foot square with one lumen of light. |
| Colour Rendering Index (CRI) | Color Rendering Index (CRI) is a measurement of how natural colors render under an artificial white light source when compared with sunlight. The index is measured from 0-100, with a perfect 100 indicating that colors of objects under the light source appear the same as they would under natural sunlight. |
| Luminous flux | Luminous flux is a measure of the power of visible light produced by a light source or light fitting. It is measured in lumens (lm). |
| Annual Energy Cost | Annual Energy Cost means the average daily energy consumption multiplied by 365 (days per year), expressed in kilowatt hour per year (kWh/a). |
| Constant voltage drivers | Constant voltage drivers are designed for a single direct current (DC) output voltage. Most common constant voltage drivers (or Power Supplies) are 12VDC or 24VDC. An LED light that is rated for constant voltage usually specifies the amount of input voltage it needs to operate correctly. |
| Constant Current Driver | Constant current LED drivers are designed for a designated range of output voltages and a fixed output current (mA). LEDs that are rated to operate on a constant current driver require a designated supply of current usually specified in milliamps (mA) or amps (A). These drivers vary the voltage along an electronic circuit which allows current to remain constant throughout the LED system. |
| Minimum Energy Performance Standards (MEPS) | Minimum Energy Performance Standards specify the minimum level of energy performance that appliances and equipment must meet or exceed before they can supply or used for commercial purposes. |
| Luminous Efficacy | Luminous efficacy is a measurement commonly used in the lighting industry that indicates the ability of a light source to emit visible light using a given amount of power. |
| Solid State Lighting | Solid-state lighting (SSL) is a type of lighting that uses semiconductor light-emitting diodes (LEDs), organic light-emitting diodes (OLED), or polymer light-emitting diodes (PLED) as sources of illumination rather than electrical filaments, plasma (used in arc lamps such as fluorescent lamps), or gas. |
| Rated Lamp Life | Lamp life, also referred to as rated life, is the time in hours a lamp will last before a percentage of lamps will burn out. |
| Color Temperature | Colour temperature is a scale that measures how ‘warm’ (yellow) or ‘cool’ (blue) the light from a particular source is. It is measured in degrees of the Kelvin scale (abbreviated to K), and the higher the number, the ‘cooler’ the light. The lower the ‘K’ number, the ‘warmer’ the light. |
| Ingress Protection rating (IP rating) | The IP (Ingress Protection) rating of a bulb or light fixture declares the level of protection it has against dirt and water. |
| Fidelity Index | The general colour fidelity index, Rf, represents how closely the colour appearances of the entire sample set are reproduced (rendered) on average by a test light as compared to those under a reference illuminant. |
| Gamut Index | The gamut area is defined as “the area enclosed by a set of test color samples illuminated by a light source, in a two-dimensional chromaticity diagram or a plane of color space.”1 Within a defined color space, a “gamut” describes the subset of colors that can be perceived under specific lighting conditions. |
| Binning | In the lighting industry, the act of "binning" of LEDs is the process of sorting LEDs by certain characteristics, such as color, voltage, and brightness. |
| Accent lighting | Accent lighting, also called highlighting, emphasizes objects by focusing light directly on them. Accent lighting is used inside and outside the home to feature locations such as an entrance or to create dramatic effects. |
| Dimmable driver | A dimming driver has two functions: As a driver, it converts the 230V AC mains input to a low voltage DC output. As a dimmer, it reduces the amount of electrical energy flowing to the LEDs, thereby causing them to dim. |
| Flicker | Flicker is the repeated and frequent variation in the output of a light source over time. |
| Fluorescent | A property of materials defined as the ability to emit light after absorbing electromagnetic radiation such as visible or UV light. |
| Candela | The candela is the unit of luminous intensity in the International System of Units. It measures the light output per unit solid angle emitted from a light source in a specific direction. |
| LUX | Lux is used to measure the amount of light output in a given area - one lux is equal to one lumen per square meter. It enables us to measure the total "amount" of visible light present and the intensity of the illumination on a surface. |
| Uniformity (U0) | The uniformity of lighting has significant effects on visual performance in both indoor and outdoor areas. Uniformity (represented as U0) value can be found by dividing the minimum brightness (Emin) resulting from calculations according to the current lighting order, to the average brightness value (Eavg). |
| Visible Light Spectrum | The visible light spectrum is the segment of the electromagnetic spectrum that the human eye can view. More simply, this range of wavelengths is called visible light. Typically, the human eye can detect wavelengths from 380 to 700 nanometers. |
| Ambient Temperature | Ambient Temperature is the temperature of the air surrounding an electrical enclosure. |
| Current-controlled dimming control | Current-controlled dimming controls LED brightness by varying the applied current using a 0-10V dimmer. Current-controlled dimming is smooth and HD-video friendly. It can only dim to a minimum of 5% of light output. |
| Design Light Consortium | It is a partnership of energy efficiency stakeholders in the United States and Canada to “promote quality, performance and energy efficient lighting solutions for the commercial sector”. |
| Pulse Width Modulation | Pulse-width modulation, or pulse-duration modulation, is a method of controlling the average power delivered by an electrical signal. |
| Surface Mounted Device | A surface mount device (SMD) is an electronic device whose components are mounted or placed directly on the surface of a printed circuit board. |
| Alternating Current | Alternating current is an electric current which periodically reverses direction and changes its magnitude continuously with time, in contrast to direct current, which flows only in one direction. |
| Direct Current | Direct current (DC) is an electric current that is uni-directional, so the flow of charge is always in the same direction. |
| Beam Angle | Beam angle (also called beam spread) is a measure of how light is distributed. On any plane perpendicular to the centerline of the light, the beam angle is the angle between two rays where the light intensity is 50% of the maximum light intensity. |
| LED Based Solar High Mast Lighting Systems | A Solar LED High Mast Light is a raised source of High illumination lights (6~8 lights) and with high intensity on the middle of major junctions (Ring roads, Outer Ring roads), turned on or lit automatically in the absence of light (at specified timings or at periodic times, every night). |
| Surface Mounted Diode (SMD) LEDs | A surface mount diode is a type that emits light and is flat mounted and soldered onto a circuit board. |
| Chip on Board (COB) LEDs | A COB LED is basically multiple LED chips (usually 9 or more) glued directly onto a substrate by the manufacturer to form a single module. |
| Dual In-Line Package (DIP) LEDs | A dual in-line package (DIP or DIL) is an electronic component package with a rectangular case and two parallel rows of electrical connector pins. |
| Graphene LED Lights | A graphene LED light bulb is simply an LED light bulb where the filament has been coated in graphene. A graphene LED bulb is reported to be 10% more efficient than regular LED light bulbs and they are cheaper to manufacture and buy. |
| LED Corn Bulbs | LED Corn lights are designed as an energy efficient alternative to high intensity discharge (HID) and SON lamps. It uses a large number of LEDs on a metal structure to provide sufficient light. This arrangement of LEDs looks a lot like a corn cob, hence the name "corn light". |
| Per Capita Income | Per capita income or total income measures the average income earned per person in a given area in a specified year. It is calculated by dividing the area's total income by its total population. Per capita income is national income divided by population size. |
| Charging Stations | A charging station, also known as a charging station or electric vehicle utility, is a power supply that provides electrical energy for charging plug-in electric vehicles. |
| Headlight | A headlight is a light that is mounted on the front of a car and illuminates the road in front of it. Low beam and high beam LED headlights are additional categories for these LED headlights. |
| Day Time Running Light (DRLs) | A daytime running lamp is a white, yellow, or amber lighting device mounted on the front of a road-going motor vehicle or bicycle. |
| Directional Signal Light | Directional signal lights are the front and rear lights on an automobile that flash to show the direction of a turn. |
| Stop Light | A red light that is mounted to the back of a car and turns on when the brakes are used to show that the car is stopped. |
| Reverse Light | The reverse light is at the back of the vehicle to indicate its backward motion. |
| Tail Light | A red light that can be seen in the dark is mounted on the rear of a road vehicle. Stop, reverse, and directional signal lights are all part of it. |
| Fog Light | Bright lights in automobiles used to increase visibility on the road in foggy conditions or to warn other drivers of the presence of the vehicle. |
| Passenger Vehicle | A passenger vehicle is a road vehicle, other than a moped or a motorcycle, intended for the transportation of people and designed for up to 8 to 9 seats. |
| Commercial Vehicle | A commercial vehicle (Bus, Truck, Van) is any type of motor vehicle used to transport goods or pay passengers. |
| Two Wheelers (2W) | A two-wheeler is a vehicle that runs on two wheels. |
| Streets & Roadways | Both roads and streets refer to hard, flat surfaces on the ground on which vehicles, people, and animals can travel. Since streetways are usually in cities and towns, they often have houses and buildings on both sides. The roadway is in the countryside and sometimes passes through forests and fields |
| Horticulture Lighting | Horticulture is the science and art of sustainably growing, producing, marketing and using high quality, intensively cultivated food and ornamental plants. |


Research Methodology
Mordor Intelligence has followed the following methodology in all our data center reports.
- Step 1: Raw Data Collection: To understand the market, initially, all crtical data points were identified. Critical information about countries and regions of interest including Per-capita Income, Population, Automotive Production, Interest rate on Auto-Loans, Number of Automobiles on Road, Total LED Import, Lighting Electricity Consumption among others were recorded or estimated based on internal calculations.
- Step 2: Identify Key Variables: To build a robust forecasting model, key variables such as Number of Households, Automotive Production, Road Networks among others were identified. Through an iterative process, the variables required for the market forecast were set, and the model was built using these variables.
- Step 3: Build a Market Model: Based on data and critical industry trend data (variables), including LED pricing, LED penetration rate, and project macro and micor economic factors were utilized for building the market forecasting.
- Step 4: Validate and Finalize: In this crucial step, all market numbers and variables derived through an internal mathematical model were validated through an extensive network of primary research experts from all the markets studied. The respondents are selected across levels and functions to generate a holistic picture of the market studied.
- Step 5: Research Outputs: Syndicated Reports, Custom Consulting Assignments, Databases & Subscription Platforms


