Market Overview
| Study Period | 2017 - 2030 |
|---|---|
| Forecast Data Period | 2025 - 2030 |
| Historical Data Period | 2017 - 2023 |
| Market Size (2025) | USD 7.55 Billion |
| Market Size (2030) | USD 9.57 Billion |
| Growth Rate (2025 - 2030) | 4.85% CAGR |
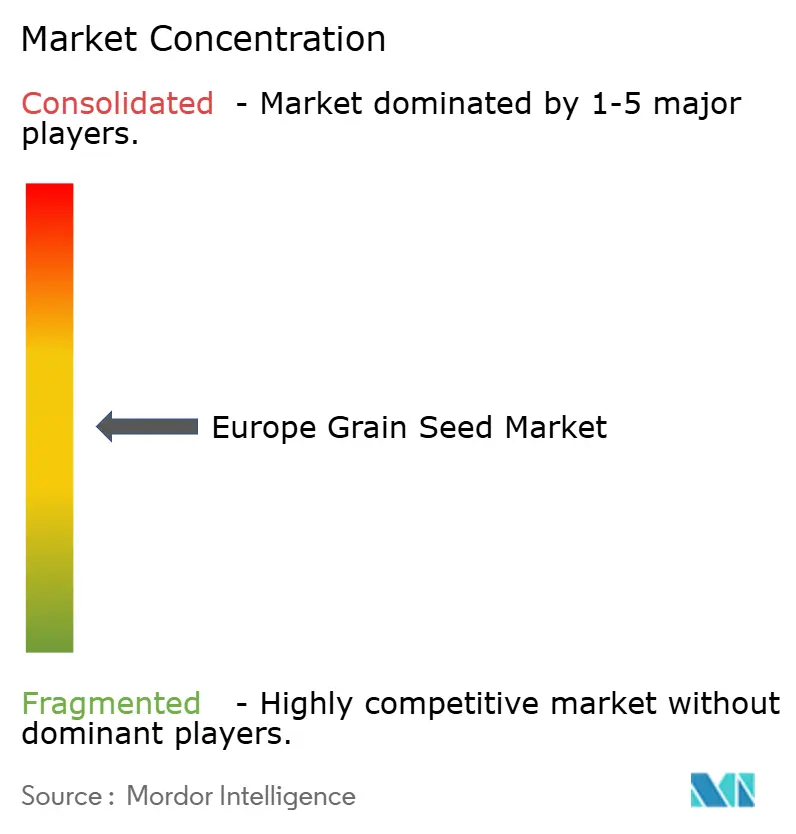
| Market Concentration | Medium |
Major Players *Disclaimer: Major Players sorted in no particular order Image © Mordor Intelligence. Reuse requires attribution under CC BY 4.0. | |

Europe Grain Seed Market Analysis by Mordor Intelligence
The Europe grain seed market size is USD 7.55 billion in 2025 and is projected to reach USD 9.57 billion by 2030, advancing at a 4.85% CAGR. Strong Certified Authorization Professional (CAP) incentives, rapid hybrid-corn uptake in Central and Eastern Europe, and mounting climate variability are redirecting seed selection toward certified, climate-resilient varieties.[1]Source: European Commission, “CAP 2023-27,” agriculture.ec.europa.eu Farmers now weigh regulatory compliance and environmental performance alongside yield, prompting seed companies to expand breeding pipelines and digital decision-support tools. Expansion capital flows into localized corn and wheat programs, while sorghum and other drought-tolerant crops attract pilot funding in Mediterranean regions. Competitive dynamics remain moderate as the top five players account for 48% of revenue, allowing regional specialists to prosper through niche positioning and partnership-based distribution.
Key Report Takeaways
- By breeding technology, open-pollinated varieties and hybrid derivatives led with 65.6% of the Europe grain seed market share in 2024, and the same segment is advancing at a 4.90% CAGR through 2030.
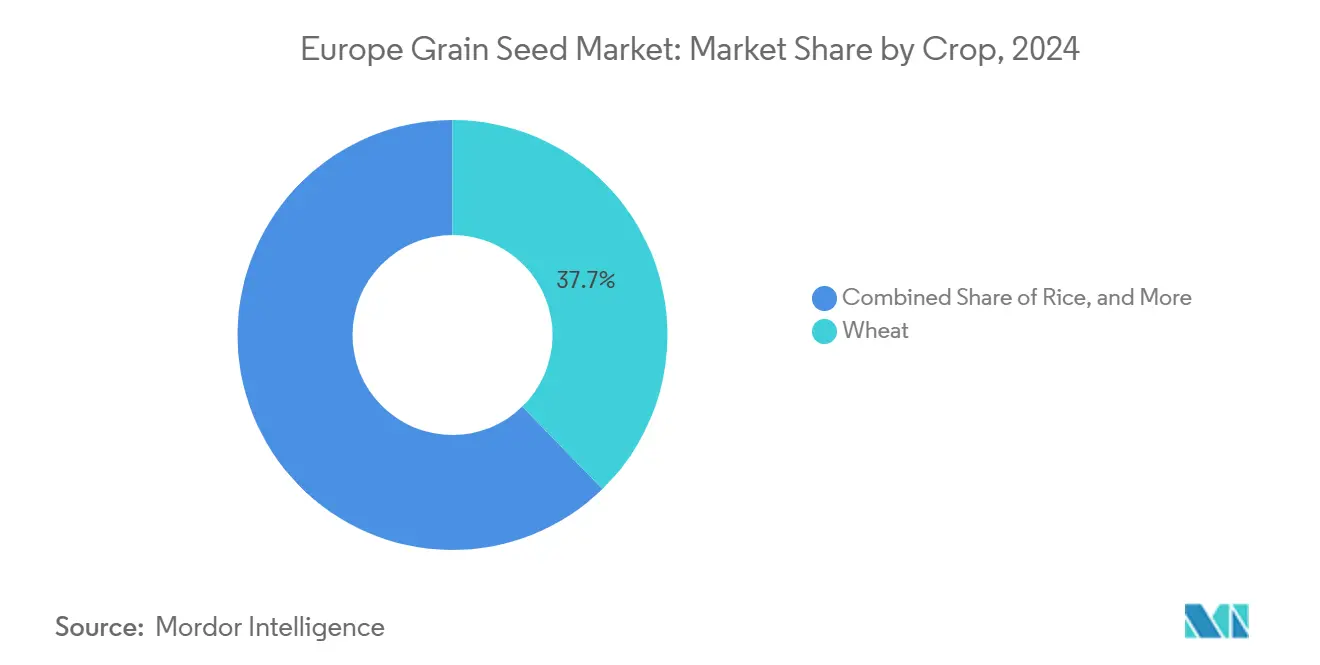
- By crop, wheat accounted for 37.7% of the Europe grain seed market size in 2024, while sorghum records the highest forecast CAGR at 9.50% to 2030.
- By country, France held 26.0% revenue share of the Europe grain seed market in 2024, while Poland representing the fastest-growing country segment with an 8.90% CAGR through 2030.
Europe Grain Seed Market Trends and Insights
Drivers Impact Analysis*
| Driver | (~) % Impact on CAGR Forecast | Geographic Relevance | Impact Timeline |
|---|---|---|---|
| Sustained Certified Authorization Professional (CAP) reforms incentivizing certified seed use | +1.2% | EU-27, with strongest impact in Central and Eastern Europe | Medium term (2-4 years) |
| Rapid hybrid-corn penetration in Central and Eastern Europe | +0.8% | Poland, Romania, Hungary, and Czech Republic | Short term (≤ 2 years) |
| Climate-resilient wheat varieties addressing heat stress | +0.7% | Southern Europe, expanding to Continental regions | Long term (≥ 4 years) |
| European Union Green Deal push for low-input agriculture | +0.6% | EU-27, with early adoption in the Netherlands, and Germany | Medium term (2-4 years) |
| On-farm seed processing bans in Russia and Ukraine | +0.4% | Eastern Europe, indirect benefits to European Union suppliers | Short term (≤ 2 years) |
| Carbon-credit premiums for regenerative grain rotations | +0.3% | Western Europe, pilot programs in France, and Germany | Long term (≥ 4 years) |
| Source: Mordor Intelligence | |||
Sustained Certified Authorization Professional (CAP) reforms incentivizing certified seed use
The 2023–2027 Common Agricultural Policy allocates EUR 387 billion (USD 425.7 billion) toward eco-schemes that reward traceable, certified seed adoption, shifting subsidies from volume support to outcome-based payments. Certified seed now unlocks higher direct-payment tiers and carbon-credit eligibility, accelerating uptake among farmers previously dependent on farm-saved seed. Central and Eastern European farmers, traditionally reliant on farm-saved seeds, now face economic incentives that make certified varieties financially attractive for the first time since European Union (EU) accession.
Rapid hybrid-corn penetration in Central and Eastern Europe
Hybrid corn achieved a 65% planting rate in Poland in 2024, delivering yields of 8.2 metric tons per hectare versus 6.4 metric tons for traditional seed.[2]Source: Polish Ministry of Agriculture, “Agricultural Statistics 2024,” gov.pl European Union (EU) modernization funds improve storage and mechanization, enabling growers to harvest the full value of hybrid performance and uplift regional demand for premium seed. Farmers, prioritizing risk mitigation over input cost savings, have driven the penetration rate for new plantings in these markets to 65%, marking a 15 percentage point surge since 2022.
Climate-resilient wheat varieties addressing heat stress
Three consecutive hot summers heightened demand for heat-tolerant wheat that holds productivity at 2–3 °C above historical norms.[3]Source: European Environment Agency, “State and Outlook 2020,” eea.europa.eu French breeders secured 15% price premiums for such varieties in 2024, indicating market willingness to pay for adaptation traits. The strategic implications extend beyond individual farm decisions, as national food security concerns drive government support for breeding programs that enhance domestic production resilience.
EU Green Deal push for low-input agriculture
The Farm to Fork strategy aims to reduce pesticide use by 50% by 2030, encouraging farmers to adopt seeds with inherent pest resistance and nutrient-efficient traits. Early adopters in the Netherlands and Germany reduced synthetic fertilizer use by up to 25% while maintaining yields, underscoring the economic benefits of compliant genetics. This policy-driven demand creates sustainable competitive advantages for seed companies that can deliver integrated solutions combining genetic traits with precision agriculture recommendations.
Restraints Impact Analysis*
| Restraint | (~) % Impact on CAGR Forecast | Geographic Relevance | Impact Timeline |
|---|---|---|---|
| Delayed biotech trait approvals in the European Union(EU) | -0.9% | EU-27, particularly affecting innovation-dependent markets | Long term (≥ 4 years) |
| Fragmented farm-level demand in Southern Europe | -0.6% | Italy, Spain, Greece, and Portugal | Medium term (2-4 years) |
| Price competition from farm-saved seeds | -0.5% | Eastern Europe, rural areas with traditional farming | Short term (≤ 2 years) |
| Supply-chain disruptions from geopolitical tensions | -0.4% | Border regions, import-dependent markets | Short term (≤ 2 years) |
| Source: Mordor Intelligence | |||
Delayed Biotech Trait Approvals in the EU
The European Union's regulatory framework for new genomic techniques continues to create approval timelines that extend 8-12 years beyond comparable processes in North America and South America, limiting European farmers' access to yield-enhancing and climate-adaptive traits. The European Food Safety Authority's risk assessment procedures require extensive field testing and environmental impact studies that add EUR 15-20 (USD 17-23) million to development costs per trait, creating barriers that only the largest seed companies can overcome.
Fragmented Farm-Level Demand in Southern Europe
Southern European agriculture remains characterized by small farm sizes averaging 5-8 hectares, creating demand patterns that favor low-volume, high-service distribution models that increase seed marketing costs by 25-30% compared to large-scale operations. Italian grain farmers, representing 40% of Southern European production, typically purchase seeds in quantities below economic order minimums for direct-from-producer sales, requiring intermediary distribution networks that add margin layers throughout the value chain.
*Our forecasts treat driver/restraint impacts as directional, not additive. The impact forecasts reflect baseline growth, mix effects, and variable interactions.
Segment Analysis
By Breeding Technology: Traditional Varieties Anchor Innovation Transition
Open-pollinated varieties and hybrid derivatives captured 65.6% of the Europe grain seed market in 2024 and will continue expanding at a 4.90% CAGR through 2030. The segment merges familiar genetics with marker-assisted upgrades, preserving farmer trust while boosting yield stability. Regulatory favorability toward conventional breeding sustains investment momentum as transgenic approvals lag. Portfolio strategies now emphasize genomic selection to fast-track trait stacking without triggering biotech oversight, allowing European breeders to circumvent costly approval cycles and secure premium margins.
Growers view certified non-transgenic hybrids as insurance against volatile climate and market conditions. Companies integrate digital prescription tools, matching field-level data with seed traits, further elevating perceived value. The Europe grain seed market is likely to see intensified collaboration between regional seed houses and technology providers to speed variety turnover and retain market share amid increasing hybrid adoption.


By Crop: Wheat Dominance Faces Diversification Pressure
Wheat retained a 37.7% share of the Europe grain seed market size in 2024, backed by agro-climatic suitability and export-driven production systems. Yet the fastest growth stems from sorghum, projected at 9.50% CAGR, as Mediterranean droughts elevate interest in water-efficient grains. Seed companies accelerate wheat breeding for heat and disease resilience while also allocating resources to corn and sorghum programs that spread climatic risk.
Diversification reflects national food-security agendas and evolving feed industry demand. Corn continues to gain ground in Eastern Europe where modern hybrids lift yield ceilings, whereas rice remains a niche confined to irrigated belts in Italy and Spain. Seed firms must optimize revenue from dominant wheat lines while nurturing emerging crops that promise superior growth and margin potential within the Europe grain seed market.
Geography Analysis
France accounted for 26.0% of Europe grain seed market share in 2024. France’s leadership stems from integrated wheat supply chains, robust cooperatives, and export-oriented standards that reward high-quality seed. German and Dutch growers drive demand for low-input varieties aligned with environmental regulations, sustaining premium pricing. Italy and Spain exhibit fragmented farm structures and rising water scarcity, motivating experimentation with drought-tolerant sorghum and innovative rotation systems.
Central and Eastern Europe contributes the fastest incremental volume as modern machinery and storage infrastructure enable farmers to unlock hybrid yield advantages. Poland represents the fastest-growing market at 8.90% CAGR. Poland’s rapid growth illustrates successful technology transfer programs, while Romania and Hungary follow similar trajectories, supported by Certified Authorization Professional (CAP) incentives that prioritize certified seed traceability and environmental compliance.
Ukraine and Russia continue to influence regional supply chains, yet geopolitical uncertainty elevates the strategic value of domestic European breeding capacity and logistical resilience. Southern Europe grapples with small farm sizes and micro-climate variability, creating demand for localized varieties and service-heavy distribution models that strain economies of scale but open specialized niches within the Europe grain seed market.
Competitive Landscape
The top five players command 48% of revenue, indicating moderate concentration that balances global scale with regional differentiation. Corteva Agriscience leads the market, leveraging proprietary germplasm and established dealer networks. Bayer AG follows, bundling crop protection with seed offerings. European champions KWS SAAT SE and Co. KGaA and Groupe Limagrain also have a strong presence, owing to their localized breeding expertise and cooperative alliances.
Strategic moves focus on climate resilience and digital agriculture. Corteva Agriscience launched Pioneer hybrids tailored to Polish and Romanian soils, backed by significant breeding investment. Bayer AG secured approval for the drought-tolerant BayWheat Pro variety, reinforcing competitive positioning without biotech hurdles. KWS SAAT SE and Co. KGaA invested substantial resources in R&D, allocating funds to heat-tolerant corn and sugar beet.
Partnerships with data analytics firms expand prescription-based seed sales, tying genetics to agronomic services. Portfolio diversification into regenerative agriculture traits positions leading companies to capture emerging carbon-credit revenue streams. Mid-tier firms target specialty crops and regional adaptations to avoid direct competition on scale, preserving profitability and relevance in the evolving Europe grain seed market.
Europe Grain Seed Industry Leaders
Syngenta Group
Bayer AG
Corteva Agriscience
KWS SAAT SE and Co. KGaA
Groupe Limagrain
- *Disclaimer: Major Players sorted in no particular order

Recent Industry Developments
- April 2025: RAGT Group acquired Deleplanque, Strube, and van Waveren, expanding its presence in the European grain seed market. The acquisition strengthens RAGT's capabilities in breeding, selection, and distribution of cereals, sunflowers, and sugar beet. This integration aligns with RAGT's goal to provide seed solutions adapted to various European agricultural and climatic regions.
- September 2024: DLF Seeds A/S and Groupe Florimond Desprez formed a joint venture, United Beet Seeds (UBS), combining their sugar beet, fodder beet, and chicory seed operations. The venture aims to enhance breeding, production, and distribution capabilities throughout Europe and international markets.
- September 2023: Corteva Agriscience invested USD 10 million in a new corn dryer at its Sissa seed plant in Italy to enhance operational efficiency and maintain seed quality for Pioneer hybrids. This investment strengthens Corteva's position in the European grain seed market and addresses the increasing demand for premium corn seeds.


Europe Grain Seed Market Report Scope
Hybrids, Open Pollinated Varieties & Hybrid Derivatives are covered as segments by Breeding Technology. Corn, Rice, Sorghum, Wheat are covered as segments by Crop. France, Germany, Italy, Netherlands, Poland, Romania, Russia, Spain, Turkey, Ukraine, United Kingdom are covered as segments by Country.Breeding Technology
| Hybrids | Non-Transgenic Hybrids | |
| Transgenic Hybrids | Insect Resistant Hybrids | |
| Open Pollinated Varieties and Hybrid Derivatives | ||
Crop
| Corn |
| Rice |
| Sorghum |
| Wheat |
| Other Grains and Cereals |
Country
| France |
| Germany |
| Italy |
| Netherlands |
| Poland |
| Romania |
| Russia |
| Spain |
| Turkey |
| Ukraine |
| United Kingdom |
| Rest of Europe |
| Breeding Technology | Hybrids | Non-Transgenic Hybrids | |
| Transgenic Hybrids | Insect Resistant Hybrids | ||
| Open Pollinated Varieties and Hybrid Derivatives | |||
| Crop | Corn | ||
| Rice | |||
| Sorghum | |||
| Wheat | |||
| Other Grains and Cereals | |||
| Country | France | ||
| Germany | |||
| Italy | |||
| Netherlands | |||
| Poland | |||
| Romania | |||
| Russia | |||
| Spain | |||
| Turkey | |||
| Ukraine | |||
| United Kingdom | |||
| Rest of Europe | |||


Market Definition
- Commercial Seed - For the purpose of this study, only commercial seeds have been included as part of the scope. Farm-saved Seeds, which are not commercially labeled are excluded from scope, even though a minor percentage of farm-saved seeds are exchanged commercially among farmers. The scope also excludes vegetatively reproduced crops and plant parts, which may be commercially sold in the market.
- Crop Acreage - While calculating the acreage under different crops, the Gross Cropped Area has been considered. Also known as Area Harvested, according to the Food & Agricultural Organization (FAO), this includes the total area cultivated under a particular crop across seasons.
- Seed Replacement Rate - Seed Replacement Rate is the percentage of area sown out of the total area of crop planted in the season by using certified/quality seeds other than the farm-saved seed.
- Protected Cultivation - The report defines protected cultivation as the process of growing crops in a controlled environment. This includes greenhouses, glasshouses, hydroponics, aeroponics, or any other cultivation system that protects the crop against any abiotic stress. However, cultivation in an open field using plastic mulch is excluded from this definition and is included under open field.
| Keyword | Definition |
|---|---|
| Row Crops | These are usually the field crops which include the different crop categories like grains & cereals, oilseeds, fiber crops like cotton, pulses, and forage crops. |
| Solanaceae | These are the family of flowering plants which includes tomato, chili, eggplants, and other crops. |
| Cucurbits | It represents a gourd family consisting of about 965 species in around 95 genera. The major crops considered for this study include Cucumber & Gherkin, Pumpkin and squash, and other crops. |
| Brassicas | It is a genus of plants in the cabbage and mustard family. It includes crops such as carrots, cabbage, cauliflower & broccoli. |
| Roots & Bulbs | The roots and bulbs segment includes onion, garlic, potato, and other crops. |
| Unclassified Vegetables | This segment in the report includes the crops which don’t belong to any of the above-mentioned categories. These include crops such as okra, asparagus, lettuce, peas, spinach, and others. |
| Hybrid Seed | It is the first generation of the seed produced by controlling cross-pollination and by combining two or more varieties, or species. |
| Transgenic Seed | It is a seed that is genetically modified to contain certain desirable input and/or output traits. |
| Non-Transgenic Seed | The seed produced through cross-pollination without any genetic modification. |
| Open-Pollinated Varieties & Hybrid Derivatives | Open-pollinated varieties produce seeds true to type as they cross-pollinate only with other plants of the same variety. |
| Other Solanaceae | The crops considered under other Solanaceae include bell peppers and other different peppers based on the locality of the respective countries. |
| Other Brassicaceae | The crops considered under other brassicas include radishes, turnips, Brussels sprouts, and kale. |
| Other Roots & Bulbs | The crops considered under other roots & bulbs include Sweet Potatoes and cassava. |
| Other Cucurbits | The crops considered under other cucurbits include gourds (bottle gourd, bitter gourd, ridge gourd, Snake gourd, and others). |
| Other Grains & Cereals | The crops considered under other grains & cereals include Barley, Buck Wheat, Canary Seed, Triticale, Oats, Millets, and Rye. |
| Other Fibre Crops | The crops considered under other fibers include Hemp, Jute, Agave fibers, Flax, Kenaf, Ramie, Abaca, Sisal, and Kapok. |
| Other Oilseeds | The crops considered under other oilseeds include Ground nut, Hempseed, Mustard seed, Castor seeds, safflower seeds, Sesame seeds, and Linseeds. |
| Other Forage Crops | The crops considered under other forages include Napier grass, Oat grass, White clover, Ryegrass, and Timothy. Other forage crops were considered based on the locality of the respective countries. |
| Pulses | Pigeon peas, Lentils, Broad and horse beans, Vetches, Chickpeas, Cowpeas, Lupins, and Bambara beans are the crops considered under pulses. |
| Other Unclassified Vegetables | The crops considered under other unclassified vegetables include Artichokes, Cassava Leaves, Leeks, Chicory, and String beans. |


Research Methodology
Mordor Intelligence follows a four-step methodology in all our reports.
- Step-1: IDENTIFY KEY VARIABLES: In order to build a robust forecasting methodology, the variables and factors identified in Step-1 are tested against available historical market numbers. Through an iterative process, the variables required for market forecast are set and the model is built on the basis of these variables.
- Step-2: Build a Market Model: Market-size estimations for the forecast years are in nominal terms. Inflation is not a part of the pricing, and the average selling price (ASP) is kept constant throughout the forecast period.
- Step-3: Validate and Finalize: In this important step, all market numbers, variables and analyst calls are validated through an extensive network of primary research experts from the market studied. The respondents are selected across levels and functions to generate a holistic picture of the market studied.
- Step-4: Research Outputs: Syndicated Reports, Custom Consulting Assignments, Databases, and Subscription Platforms


