Market Overview
| Study Period | 2018 - 2031 |
|---|---|
| Forecast Data Period | 2026 - 2031 |
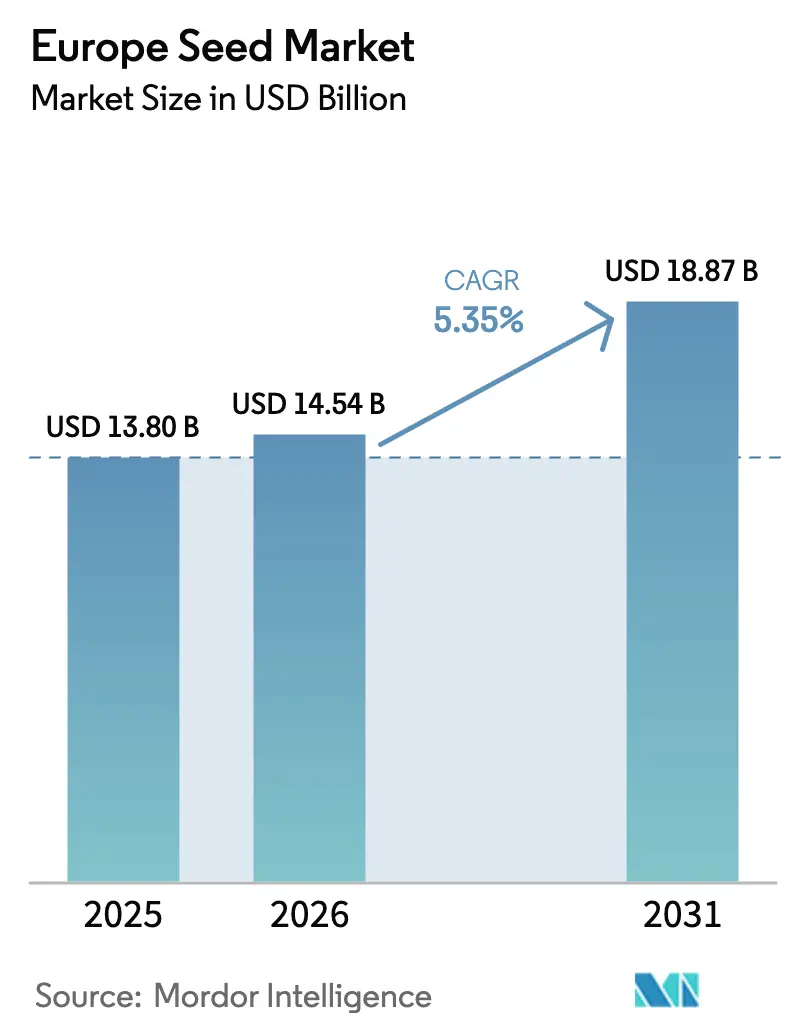
| Base Year Market Size (2025) | USD 13.8 Billion |
| Market Size (2026) | USD 14.54 Billion |
| Market Size (2031) | USD 18.87 Billion |
| Growth Rate (2026 - 2031) | 5.35% CAGR |
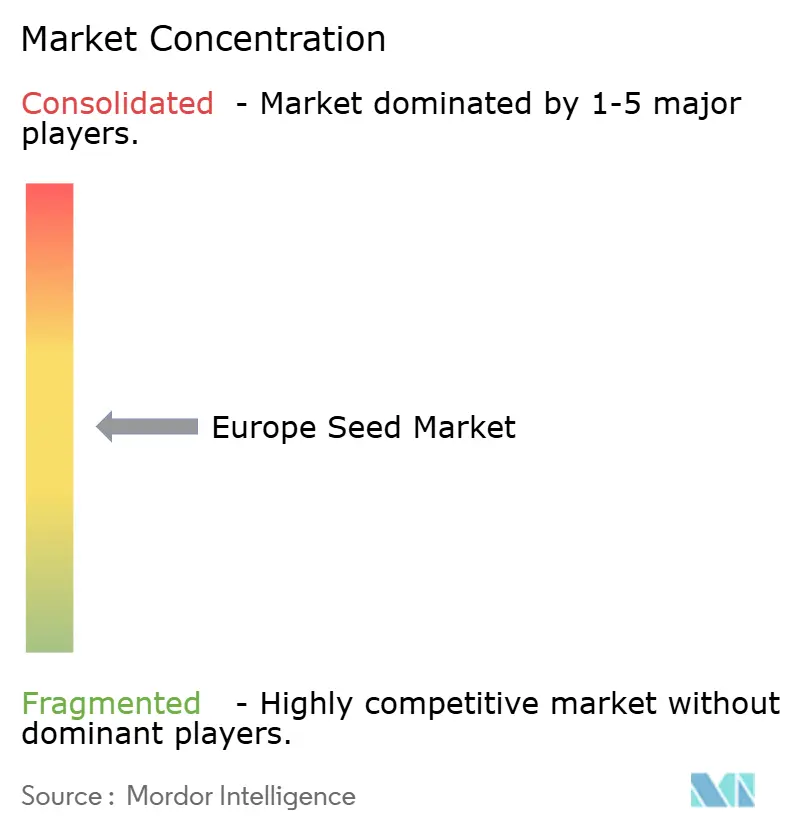
| Market Concentration | Medium |
Major Players *Disclaimer: Major Players sorted in no particular order Image © Mordor Intelligence. Reuse requires attribution under CC BY 4.0. | |
Europe Seed Market Analysis by Mordor Intelligence
The Europe seed market size was valued at USD 13.8 billion in 2025 and estimated to grow from USD 14.54 billion in 2026 to reach USD 18.87 billion by 2031, at a CAGR of 5.35% during the forecast period (2026-2031). This expansion reflects rising demand for climate-resilient certified varieties as European Union sustainability mandates favor seeds that support the Green Deal targets. Regulatory reforms that restrict conventional genetically modified organisms while fast-tracking gene-edited traits under the New Genomic Techniques framework have reshaped breeding priorities across the continent. Rapid mechanization in Eastern Europe, the surge of organic demand in Western Europe, and precision-farming adoption across high-technology growers further reinforce momentum in the Europe seed market. Competitive intensity remains moderate, with the top five companies holding significant share, which leaves ample space for regional specialists that tailor genetics to local agronomic needs. Robust Common Agricultural Policy incentives steer growers toward pulse and cover-crop seed, while climate volatility in Southern Europe accelerates a shift of production to cooler Northern zones.
Key Report Takeaways
- By breeding technology, hybrid seeds captured 59.68% of Europe seed market share in 2025, while hybrids are forecast to expand at a 5.61% CAGR to 2031.
- By cultivation mechanism, open-field systems held 99.74% revenue share in 2025, while protected cultivation is advancing at an 8.15% CAGR through 2031.
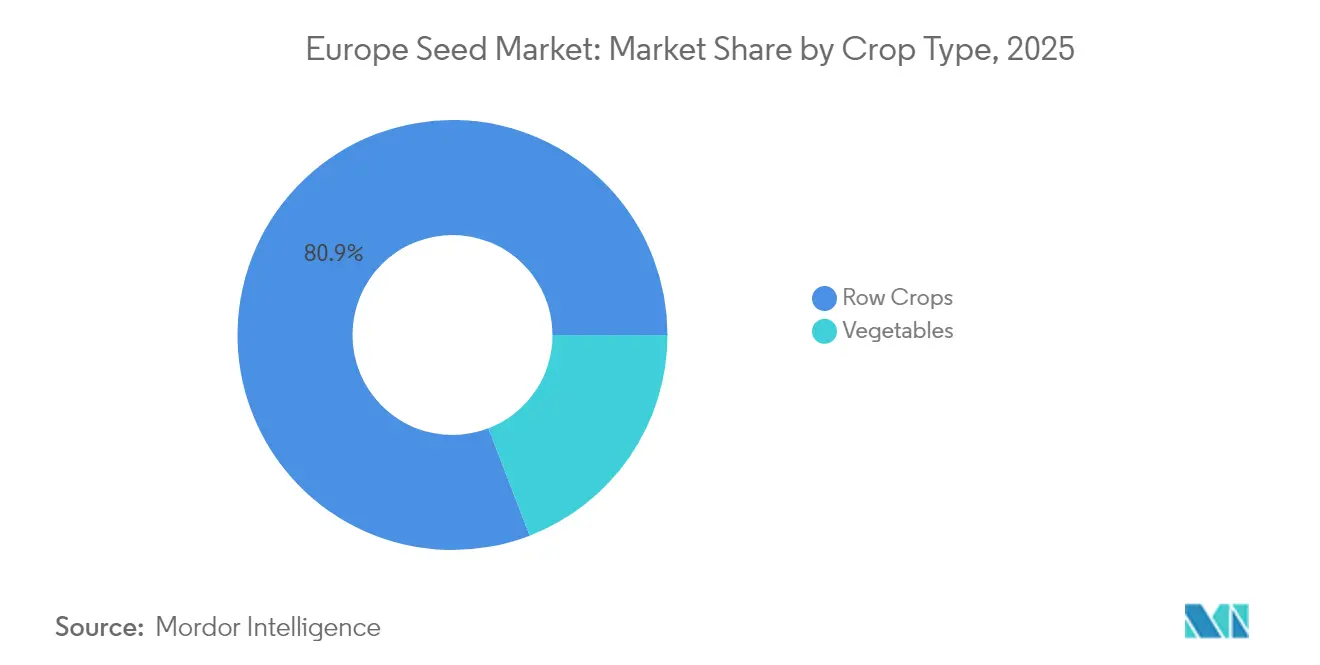
- By crop type, row crops accounted for 80.85% of the Europe seed market size in 2025, whereas vegetables are projected to register a 6.67% CAGR to 2031.
- By geography, France led with 20.33% share of the Europe seed market size in 2025 and Russia is progressing at an 8.02% CAGR through 2031.
Note: Market size and forecast figures in this report are generated using Mordor Intelligence’s proprietary estimation framework, updated with the latest available data and insights as of 2026.
Europe Seed Market Trends and Insights
Drivers Impact Analysis*
| Driver | (~) % Impact on CAGR Forecast | Geographic Relevance | Impact Timeline |
|---|---|---|---|
| Stringent European Union sustainability policies driving demand for climate-resilient certified seed | +1.2% | EU-27, with strongest impact in Germany, France, and Netherlands | Medium term (2-4 years) |
| Accelerating adoption of hybrid seed in Eastern Europe as mechanization rises | +0.8% | Poland, Romania, Czech Republic, and Hungary | Short term (≤ 2 years) |
| Growth in organic/non-GMO segment underpinned by consumer preferences | +0.6% | Western Europe, particularly Germany, Austria, and Denmark | Long term (≥ 4 years) |
| Digitally enabled on-farm decision tools boosting seed replacement rate | +0.5% | Netherlands, Germany, France, expanding to Eastern Europe | Medium term (2-4 years) |
| European Union CAP eco-schemes increasing pulse/cover-crop seed demand | +0.7% | EU-27, strongest in regions with intensive agriculture | Short term (≤ 2 years) |
| Expansion of gene-edited (CRISPR) varieties skirting GMO regulations | +0.9% | EU-27, early adoption in Netherlands, Germany, and France | Long term (≥ 4 years) |
| Source: Mordor Intelligence | |||
Stringent European Union sustainability policies driving demand for climate-resilient certified seed
European Green Deal initiatives such as the Farm to Fork strategy and the Nature Restoration Law transform purchase criteria for the 10.5 million farms operating across the Europe seed market. These policies mandate 25% organic acreage by 2030 and encourage biodiversity, which boosts demand for certified drought-tolerant and pest-resistant genetics. Major breeders redirected budgets toward climate adaptation, illustrated by Bayer allocating EUR 1.2 billion (USD 1.28 billion) in 2024 to develop stress-tolerant lines.[1]Source: European Commission, “Common Agricultural Policy Strategic Plans,” Ec.europa.eu Firms with strong compliance pipelines gain market share, highlighting competitive gaps in certification requirements. Meanwhile, smaller regional players carve out niches by supplying local ecotypes.
Accelerating adoption of hybrid seed in Eastern Europe as mechanization rises
Rising labor costs and government-backed equipment subsidies have fueled mechanization, pushing hybrid seed uptake across Eastern European fields. The adoption of hybrid corn in Poland grew from 45% to 68% during 2022-2024. Similarly, Romania's farmers increased their use of hybrid sunflower seeds to 82% after implementing precision planting equipment.[2]Source: European Investment Bank, “Agriculture Transformation in Eastern Europe,” Eib.org This mechanization wave creates sustained demand growth for hybrid varieties that deliver uniform plant architecture and synchronized maturity essential for machine harvesting efficiency. Seed companies capitalize by establishing regional breeding centers that develop hybrids specifically adapted to Eastern European growing conditions and farming systems.
Growth in organic/non-GMO segment underpinned by consumer preferences
Western European shoppers remain willing to pay premium prices for organic produce, propelling seed demand that meets European Union Organic Regulation standards. Germany's organic seed sales expanded significantly as retailers embedded strict organic sourcing requirements. Seed brands with accredited production pipelines gain a durable margin advantage, and the Europe seed industry deploys marker-assisted selection to deliver yield stability without synthetic inputs. Long-term policy certainty attracts continual breeding investment despite higher production costs.
Digitally enabled on-farm decision tools boosting seed replacement rate
Data-rich field analytics from platforms such as Climate FieldView enable variable-rate seeding and quick feedback on genetic performance. Dutch farms using digital prescriptions posted 12% higher seed replacement rates in 2024 compared with conventional management. Rapid turnover stretches market value because growers adopt new hybrids and varieties sooner, helping the Europe seed market capture technology rents. Companies bundle agronomic software alongside seed, transforming traditional sales relationships into service-oriented partnerships that enhance stickiness.
Restraints Impact Analysis*
| Restraint | (~) % Impact on CAGR Forecast | Geographic Relevance | Impact Timeline |
|---|---|---|---|
| Fragmented national IP enforcement raising counterfeit seed risk | -0.4% | Eastern Europe, Southern Europe, with highest impact in Romania, Bulgaria | Short term (≤ 2 years) |
| Climate-induced seed-production volatility in Southern Europe | -0.6% | Spain, Italy, Greece, and Southern France | Medium term (2-4 years) |
| Post-Brexit regulatory divergence complicating pan-EU varietal registration | -0.3% | UK-EU trade corridors and Northern Ireland | Long term (≥ 4 years) |
| Venture-capital pullback limiting early-stage European seed-tech startups | -0.5% | Netherlands, Germany, and France startup ecosystems | Medium term (2-4 years) |
| Source: Mordor Intelligence | |||
Fragmented national IP enforcement raising counterfeit seed risk
Inconsistent enforcement of plant variety rights across Europe allows gray-market (unauthorized distribution channel) seeds to undermine R&D returns. Inconsistent protection of plant variety rights across European jurisdictions enables gray-market seeds that dilute returns on R&D. Romania reported that 23% of sampled lots contained unauthorized genetics in 2024, and Bulgaria lacks the resources to monitor rural trade channels effectively.[3]Source: European Seed Association, “Intellectual Property Protection in Plant Breeding,” Euroseeds.eu Premium-priced hybrid and organic lines suffer the most from piracy, so legitimate companies deploy tamper-proof packaging, DNA barcoding, and dealer audits, which raise operating expenses in the Europe seed market.
Climate-induced seed-production volatility in Southern Europe
Prolonged drought in Spain cut overall seed production 28% during 2024, while excessive heat knocked 35% off Italy’s corn seed harvest. Breeders diversify multiplication sites toward Northern Europe and explore controlled-environment facilities. Such redundancy adds logistics cost and capital burden, challenging smaller enterprises and altering sourcing patterns inside the Europe seed market.
*Our forecasts treat driver/restraint impacts as directional, not additive. The impact forecasts reflect baseline growth, mix effects, and variable interactions.
Segment Analysis
By Breeding Technology: Hybrids Anchor Growth While Open-Pollinated Lines Retain Niches
Hybrid seeds dominated revenue with a 59.68% Europe seed market share in 2025, largely because mechanized harvesting relies on uniform plant stature and synchronized maturity. The segment is poised for a 5.61% CAGR through 2031, reflecting steady penetration of hybrid corn, sunflower, and sugar beet in Eastern Europe. Non-transgenic hybrids remain the default, as European Union restrictions keep transgenic acres small, though a limited niche for insect-resistant events persists. Companies use marker-assisted selection and doubled-haploid techniques to accelerate new hybrid launches, reducing time to market by as much as two years. Non-hybrid open-pollinated varieties and hybrid derivatives endure in organic programs and subsistence plots where farmers value seed saving. Breeders craft hybrid derivatives that allow one-time farm-level reproduction, balancing intellectual property control and grower autonomy. These derivatives address sustainability goals by preserving genetic diversity, so their inclusion also satisfies Common Agricultural Policy biodiversity metrics.
Hybrid leadership intertwines with digital agronomy services. Data analytics validate yield uplift and feed into decision platforms that recommend field-specific hybrid selections, encouraging frequent upgrading. Hybrid seeds command higher gross margins because performance evidence supports premium price positioning across the Europe seed market. Meanwhile, companies hedge risk by offering selected open-pollinated lines for heritage and culinary niches. Organic certifiers prioritize genetically diverse material, pushing breeders to invest in open-pollinated research even as hybrids expand. This dual-portfolio strategy maximizes reach while meeting diverging policy and consumer requirements.


By Cultivation Mechanism: Protected Systems Accelerate Despite Open-Field Dominance
Open-field farming accounted for 99.74% of the Europe seed market size in 2025, underscoring the continent’s reliance on traditional arable systems. Yet protected cultivation recorded 8.15% CAGR, the fastest across all mechanisms, and is forecast to gain incremental revenue through 2031. Urban food strategies in cities like Paris, Berlin, and Amsterdam promote vertical farms and rooftop greenhouses, which in turn require varieties optimized for high-density production. Netherlands illustrates the protected trend with 10,500 hectares of advanced glasshouses that rely on compact, disease-resistant tomato and pepper lines. Breeding programs targeting low-light efficiency, short internodes, and closed-roof humidity tolerance command premium royalty fees in the Europe seed market.
Adoption of protected environments also serves as a hedge against climatic shocks. Southern European growers increasingly pivot to net-house structures to mitigate heat waves, widening the customer base for greenhouse-specialized germplasm. Companies such as KWS SAAT and Groupe Limagrain invest in phenotyping platforms located inside climate-controlled tunnels, capturing trait performance under elevated temperature and carbon dioxide conditions. Beyond vegetables, breeders test dwarf cereal lines for indoor fodder production, hinting at future diversification. As protected hectares expand, sales of high-value seed formats such as grafted seedlings and coated pellets boost average selling prices, lifting the revenue mix for the Europe seed market.
By Crop Type: Row Crops Dominate, Vegetables Rise on Urban Demand
Row crops generated 80.85% of sales in 2025, confirming that staples like wheat, corn, barley, and rapeseed underpin the Europe seed market. Biofuel policy supports rapeseed expansion, while dairy sector intensification in Netherlands and Denmark stimulates forage seed. Pulse acreage benefits from nitrogen-fixing incentives under eco-scheme rules, increasing by 25% since 2024 and offering resilient rotation options for growers facing fertilizer cost spikes. Fiber crops remain regionally concentrated but show renewed interest as textile makers explore regenerative sourcing. Within grains, breeders accelerate selection for disease resistance, particularly for rusts in wheat and mycotoxin control in corn, to safeguard food-safety standards.
Vegetables exhibit a 6.67% CAGR forecast to 2031, outpacing staples as urban consumers pay premiums for locally produced fresh produce. Tomatoes, peppers, and cucumbers dominate protected systems, while brassicas thrive in cooler outdoor zones. Gene-edited lettuce resistant to downy mildew is anticipated to debut under NGT-1 rules, potentially unlocking a larger share of the Europe seed market. Vegetable breeders leverage rapid generation advancement to cut release cycles to three years, meeting chef and retailer preferences for novel flavor and color profiles. The cross-pollination of culinary trends and controlled-environment agriculture adds resilience to this segment even when row-crop revenues plateau.
Geography Analysis
France held 20.33% of Europe seed market share in 2025, riding on 27.8 million hectares of farmland that range from Mediterranean vegetables to northern cereals. Long-standing breeder–farmer networks and public-private research investments anchor a steady pipeline of wheat and maize genetics. Germany ranks second, where high-technology adoption drives hybrid corn and oilseed rape upgrades, helped by widespread digital farming tools that integrate seeding prescriptions. The Netherlands leverages limited land through greenhouse leadership and export-oriented seed multiplication services that supply global horticulture chains. Western Europe as a block reveals mature volume yet diversifies value through premium organic, digital, and gene-edited niches, thereby sustaining revenue even on flat acreage.
Eastern Europe contributes the most dynamic expansion to the Europe seed market. Russia is anticipated to experience the fastest compound annual growth rate (CAGR) of 8.02% until 2031, driven by reforms in domestic seed legislation and policies aimed at substituting imports that encourage localized hybrid production. Poland, Romania, and Hungary speed up mechanization with the aid of European Investment Bank credit lines and Common Agricultural Policy rural development funds. Hybrid penetration climbs every year, lifting average revenue per hectare. National governments court multinational breeders to build research stations that tailor hybrids to continental climate gradients. Ongoing geopolitical uncertainty induces firms to employ flexible supply chains, yet demand fundamentals remain intact as rising incomes and feed grain requirements expand seeded area.
Southern Europe faces hotter summers and erratic rainfall, driving adoption of heat-tolerant and drought-resistant lines. Spain experienced a 28% seed production decline in 2024, prompting suppliers to transfer multiplication contracts to Northern France and Denmark for risk balance. Italy’s diversified farms pivot to stress-tolerant corn and specialty vegetables suited for coastal markets. Greece, despite its smaller size, serves as a testing ground for ultra-drought germplasm, with potential for broader northern expansion. Climate adaptation capitalizes on gene editing and precision phenotyping to deliver varieties that secure yields amid water scarcity, preserving market continuity and creating specialized premium categories within the Europe seed market.
Competitive Landscape
The Europe seed market shows moderate concentration accounting for around 54% of market share, with major companies being Bayer, Corteva, Syngenta, KWS SAAT, and Groupe Limagrain. Bayer invests substantially in German and Dutch Clustered Regularly Interspaced Short Palindromic Repeats (CRISPR) centers to speed climate-resilient varieties. Corteva rolls out Pioneer Climate Resilient Corn across multiple European countries, emphasizing drought tolerance confirmed through marker-assisted selection. Syngenta funds European agricultural-technology startups through a dedicated venture vehicle to tap digital breeding innovations. These strategies underscore a pivot from purely germplasm competition toward integrated platform offerings that blend genetics, data, and advisory services.
Regional players exploit agility and regulatory familiarity to penetrate white-space segments. KWS SAAT's acquisition of Nunhems vegetable assets in May 2025 enhances greenhouse portfolio breadth, reinforcing competitiveness in high-value protected crops. In addition, in June 2025, Groupe Limagrain collaborates with INRAE on organic wheat to meet sustainability mandates and specialty baker demand. DLF secures organic certification for Danish clover and grass production, securing price premiums in forage markets. Such moves demonstrate how medium-sized firms leverage local assets and niche expertise to thrive alongside multinationals in the Europe seed market.
Barriers to entry remain formidable via patent portfolios and advanced phenotyping infrastructure. Clustered Regularly Interspaced Short Palindromic Repeats pipelines require heavy capital, which favors incumbents that already run global genomics programs. Still, the withdrawal of venture funding for startups reduces disruptive pressure, enabling large companies to consolidate intellectual property. Market share shifts will hinge on speed of gene-edited trait delivery, depth of digital agronomy services, and ability to meet complex regulatory mosaics from the European Union, national authorities, and the United Kingdom.
Europe Seed Industry Leaders
Bayer AG
Corteva Agriscience
Groupe Limagrain
KWS SAAT SE & Co. KGaA
Syngenta Group
- *Disclaimer: Major Players sorted in no particular order

Recent Industry Developments
- June 2025: Advanta Seeds acquired temperate corn assets from Italy-based K-Adriatica to expand its European portfolio. This acquisition strengthens Advanta's breeding operations and market presence in European corn-growing regions.
- May 2025: KWS SAAT SE has renewed its bid to acquire Bayer AG's vegetable seed business, which includes the Nunhems brand. This acquisition would expand KWS's global horticulture operations and support its strategy to diversify beyond field crops while increasing its presence in the European vegetable seed market.
- December 2024: Corteva UK's 2024-2025 portfolio includes new maize and cereal seed varieties developed for United Kingdom and Irish farmers. The company has also added biological products BlueN and Kinsidro Grow+ to enhance sustainable agricultural practices.


Europe Seed Market Report Scope
Hybrids, Open Pollinated Varieties & Hybrid Derivatives are covered as segments by Breeding Technology. Open Field, Protected Cultivation are covered as segments by Cultivation Mechanism. Row Crops, Vegetables are covered as segments by Crop Type. France, Germany, Italy, Netherlands, Poland, Romania, Russia, Spain, Turkey, Ukraine, United Kingdom are covered as segments by Country.By Breeding Technology
| Hybrids | Non-Transgenic Hybrids | |
| Transgenic Hybrids | Insect Resistant Hybrids | |
| Open Pollinated Varieties and Hybrid Derivatives | ||
By Cultivation Mechanism
| Open-Field |
| Protected Cultivation |
By Crop Type
| Row Crops | Fiber Crops | Cotton |
| Other Fiber Crops | ||
| Forage Crops | Alfalfa | |
| Forage Corn | ||
| Forage Sorghum | ||
| Other Forage Crops | ||
| Grains and Cereals | Corn | |
| Rice | ||
| Sorghum | ||
| Wheat | ||
| Other Grains and Cereals | ||
| Oilseeds | Canola, Rapeseed and Mustard | |
| Soybean | ||
| Sunflower | ||
| Other Oilseeds | ||
| Pulses | Pulses | |
| Vegetables | Brassicas | Cabbage |
| Carrot | ||
| Cauliflower and Broccoli | ||
| Other Brassicas | ||
| Cucurbits | Cucumber and Gherkin | |
| Pumpkin and Squash | ||
| Other Cucurbits | ||
| Roots and Bulbs | Garlic | |
| Onion | ||
| Potato | ||
| Other Roots and Bulbs | ||
| Solanaceae | Chilli | |
| Eggplant | ||
| Tomato | ||
| Other Solanaceae | ||
| Unclassified Vegetables | Asparagus | |
| Lettuce | ||
| Okra | ||
| Peas | ||
| Spinach | ||
| Other Unclassified Vegetables | ||
By Country
| France |
| Germany |
| Italy |
| Netherlands |
| Poland |
| Romania |
| Russia |
| Spain |
| Turkey |
| Ukraine |
| United Kingdom |
| Rest of Europe |
| By Breeding Technology | Hybrids | Non-Transgenic Hybrids | |
| Transgenic Hybrids | Insect Resistant Hybrids | ||
| Open Pollinated Varieties and Hybrid Derivatives | |||
| By Cultivation Mechanism | Open-Field | ||
| Protected Cultivation | |||
| By Crop Type | Row Crops | Fiber Crops | Cotton |
| Other Fiber Crops | |||
| Forage Crops | Alfalfa | ||
| Forage Corn | |||
| Forage Sorghum | |||
| Other Forage Crops | |||
| Grains and Cereals | Corn | ||
| Rice | |||
| Sorghum | |||
| Wheat | |||
| Other Grains and Cereals | |||
| Oilseeds | Canola, Rapeseed and Mustard | ||
| Soybean | |||
| Sunflower | |||
| Other Oilseeds | |||
| Pulses | Pulses | ||
| Vegetables | Brassicas | Cabbage | |
| Carrot | |||
| Cauliflower and Broccoli | |||
| Other Brassicas | |||
| Cucurbits | Cucumber and Gherkin | ||
| Pumpkin and Squash | |||
| Other Cucurbits | |||
| Roots and Bulbs | Garlic | ||
| Onion | |||
| Potato | |||
| Other Roots and Bulbs | |||
| Solanaceae | Chilli | ||
| Eggplant | |||
| Tomato | |||
| Other Solanaceae | |||
| Unclassified Vegetables | Asparagus | ||
| Lettuce | |||
| Okra | |||
| Peas | |||
| Spinach | |||
| Other Unclassified Vegetables | |||
| By Country | France | ||
| Germany | |||
| Italy | |||
| Netherlands | |||
| Poland | |||
| Romania | |||
| Russia | |||
| Spain | |||
| Turkey | |||
| Ukraine | |||
| United Kingdom | |||
| Rest of Europe | |||


Market Definition
- Commercial Seed - For the purpose of this study, only commercial seeds have been included as part of the scope. Farm-saved Seeds, which are not commercially labeled are excluded from scope, even though a minor percentage of farm-saved seeds are exchanged commercially among farmers. The scope also excludes vegetatively reproduced crops and plant parts, which may be commercially sold in the market.
- Crop Acreage - While calculating the acreage under different crops, the Gross Cropped Area has been considered. Also known as Area Harvested, according to the Food & Agricultural Organization (FAO), this includes the total area cultivated under a particular crop across seasons.
- Seed Replacement Rate - Seed Replacement Rate is the percentage of area sown out of the total area of crop planted in the season by using certified/quality seeds other than the farm-saved seed.
- Protected Cultivation - The report defines protected cultivation as the process of growing crops in a controlled environment. This includes greenhouses, glasshouses, hydroponics, aeroponics, or any other cultivation system that protects the crop against any abiotic stress. However, cultivation in an open field using plastic mulch is excluded from this definition and is included under open field.
| Keyword | Definition |
|---|---|
| Row Crops | These are usually the field crops which include the different crop categories like grains & cereals, oilseeds, fiber crops like cotton, pulses, and forage crops. |
| Solanaceae | These are the family of flowering plants which includes tomato, chili, eggplants, and other crops. |
| Cucurbits | It represents a gourd family consisting of about 965 species in around 95 genera. The major crops considered for this study include Cucumber & Gherkin, Pumpkin and squash, and other crops. |
| Brassicas | It is a genus of plants in the cabbage and mustard family. It includes crops such as carrots, cabbage, cauliflower & broccoli. |
| Roots & Bulbs | The roots and bulbs segment includes onion, garlic, potato, and other crops. |
| Unclassified Vegetables | This segment in the report includes the crops which don’t belong to any of the above-mentioned categories. These include crops such as okra, asparagus, lettuce, peas, spinach, and others. |
| Hybrid Seed | It is the first generation of the seed produced by controlling cross-pollination and by combining two or more varieties, or species. |
| Transgenic Seed | It is a seed that is genetically modified to contain certain desirable input and/or output traits. |
| Non-Transgenic Seed | The seed produced through cross-pollination without any genetic modification. |
| Open-Pollinated Varieties & Hybrid Derivatives | Open-pollinated varieties produce seeds true to type as they cross-pollinate only with other plants of the same variety. |
| Other Solanaceae | The crops considered under other Solanaceae include bell peppers and other different peppers based on the locality of the respective countries. |
| Other Brassicaceae | The crops considered under other brassicas include radishes, turnips, Brussels sprouts, and kale. |
| Other Roots & Bulbs | The crops considered under other roots & bulbs include Sweet Potatoes and cassava. |
| Other Cucurbits | The crops considered under other cucurbits include gourds (bottle gourd, bitter gourd, ridge gourd, Snake gourd, and others). |
| Other Grains & Cereals | The crops considered under other grains & cereals include Barley, Buck Wheat, Canary Seed, Triticale, Oats, Millets, and Rye. |
| Other Fibre Crops | The crops considered under other fibers include Hemp, Jute, Agave fibers, Flax, Kenaf, Ramie, Abaca, Sisal, and Kapok. |
| Other Oilseeds | The crops considered under other oilseeds include Ground nut, Hempseed, Mustard seed, Castor seeds, safflower seeds, Sesame seeds, and Linseeds. |
| Other Forage Crops | The crops considered under other forages include Napier grass, Oat grass, White clover, Ryegrass, and Timothy. Other forage crops were considered based on the locality of the respective countries. |
| Pulses | Pigeon peas, Lentils, Broad and horse beans, Vetches, Chickpeas, Cowpeas, Lupins, and Bambara beans are the crops considered under pulses. |
| Other Unclassified Vegetables | The crops considered under other unclassified vegetables include Artichokes, Cassava Leaves, Leeks, Chicory, and String beans. |


Research Methodology
Mordor Intelligence follows a four-step methodology in all our reports.
- Step-1: IDENTIFY KEY VARIABLES: In order to build a robust forecasting methodology, the variables and factors identified in Step-1 are tested against available historical market numbers. Through an iterative process, the variables required for market forecast are set and the model is built on the basis of these variables.
- Step-2: Build a Market Model: Market-size estimations for the forecast years are in nominal terms. Inflation is not a part of the pricing, and the average selling price (ASP) is kept constant throughout the forecast period.
- Step-3: Validate and Finalize: In this important step, all market numbers, variables and analyst calls are validated through an extensive network of primary research experts from the market studied. The respondents are selected across levels and functions to generate a holistic picture of the market studied.
- Step-4: Research Outputs: Syndicated Reports, Custom Consulting Assignments, Databases, and Subscription Platforms


