Market Overview
| Study Period | 2020 - 2031 |
|---|---|
| Forecast Data Period | 2026 - 2031 |
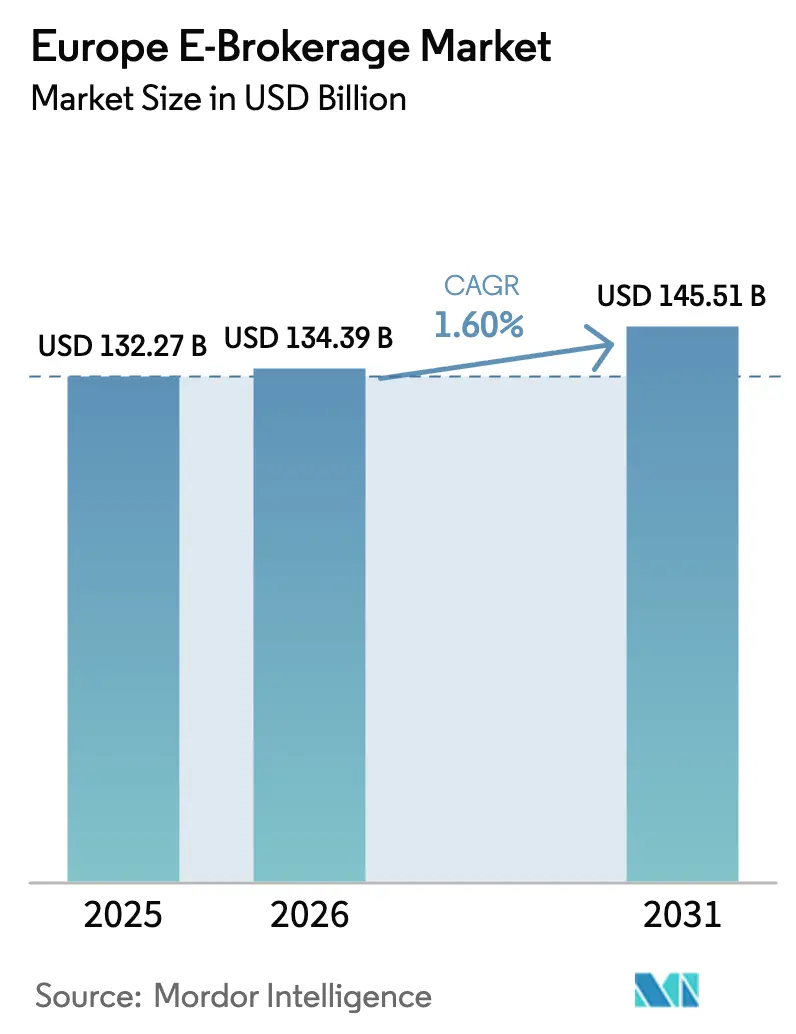
| Base Year Market Size (2025) | USD 132.27 Billion |
| Market Size (2026) | USD 134.39 Billion |
| Market Size (2031) | USD 145.51 Billion |
| Growth Rate (2026 - 2031) | 1.60% CAGR |
| Market Concentration | Low |
Major Players *Disclaimer: Major Players sorted in no particular order Image © Mordor Intelligence. Reuse requires attribution under CC BY 4.0. | |
Europe E-Brokerage Market Analysis by Mordor Intelligence
The Europe E-Brokerage Market size is expected to grow from USD 132.27 billion in 2025 to USD 134.39 billion in 2026 and is forecast to reach USD 145.51 billion by 2031 at 1.60% CAGR over 2026-2031.
Growth in the European e-brokerage market has slowed from the post-pandemic spike to a steadier pace as regulatory costs and price competition reset revenue models across both discount and full-service platforms. Competitive momentum favors firms that integrate banking services, scale across borders with EU passporting, and modernize stacks with cloud-native cores to reduce unit costs in execution and operations.
Key Report Takeaways
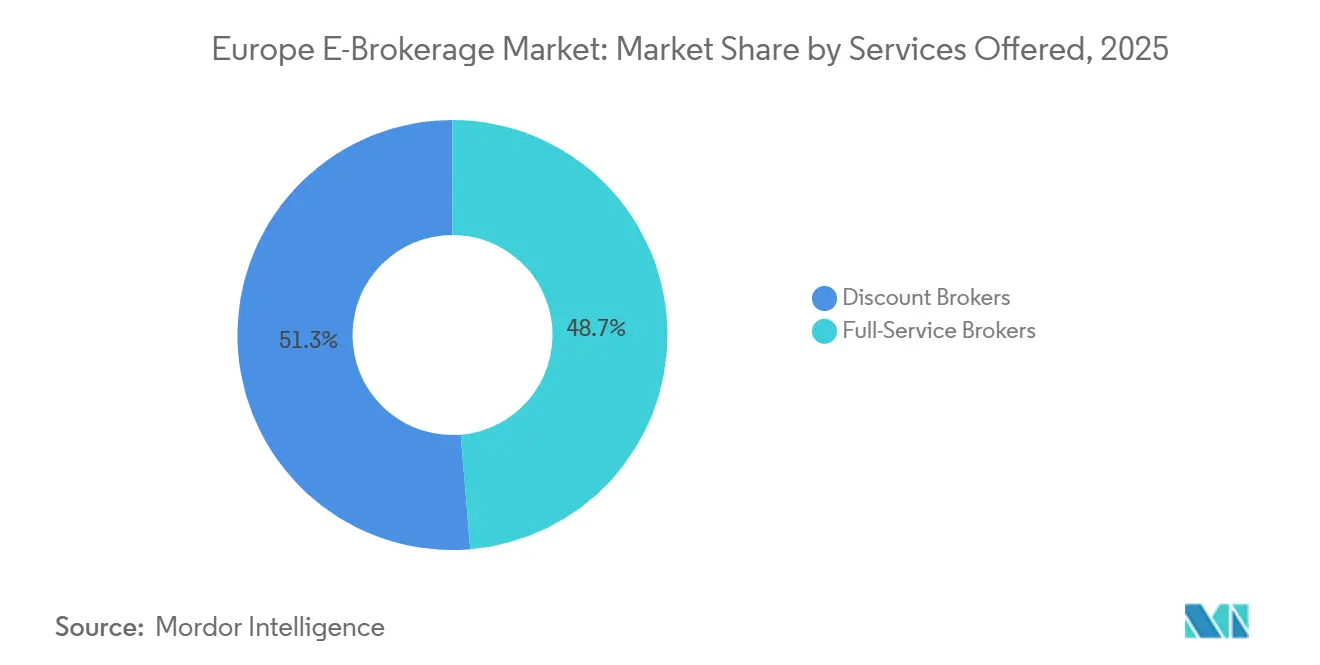
- By services offered, discount brokers led with 51.31% of the European e-brokerage market share in 2025, while discount brokers are projected to post the fastest 12.29% CAGR to 2031.
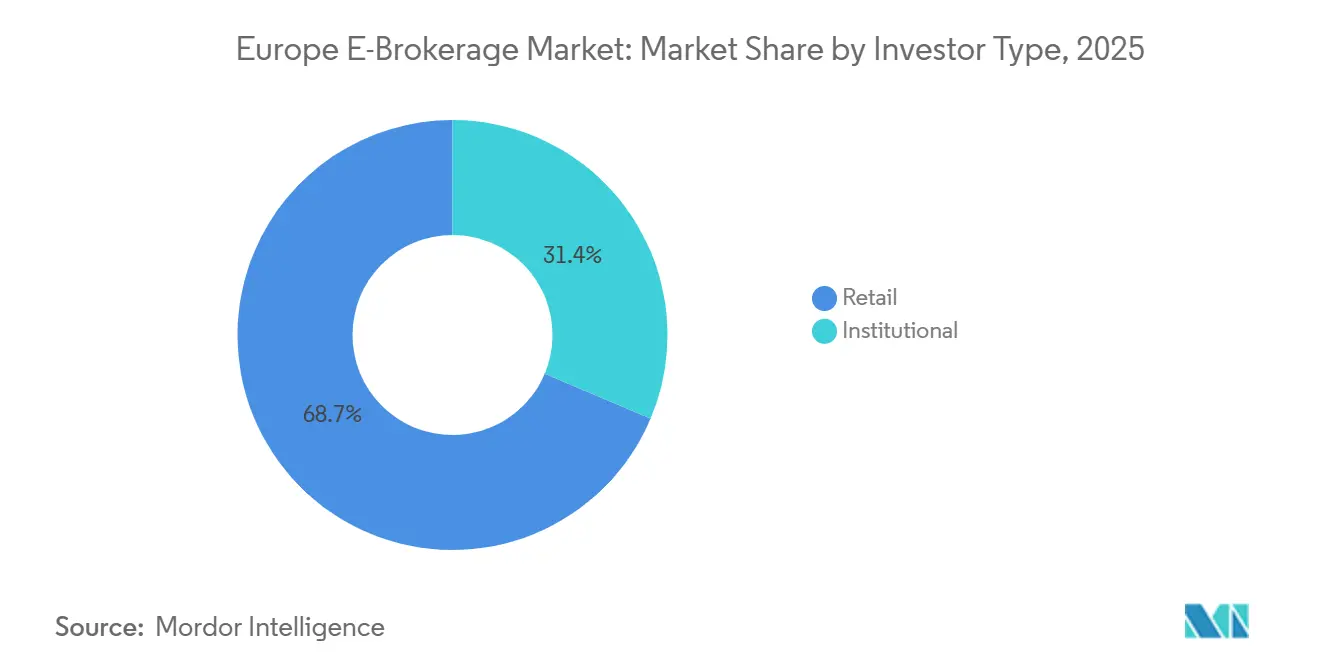
- By investor type, retail investors commanded 68.65% of the European e-brokerage market in 2025 and are projected to grow at an 8.23% CAGR through 2031.
- By operation, domestic platforms held 62.64% of the European e-brokerage market in 2025, while foreign operations are projected to expand at a 9.79% CAGR to 2031.
- By geography, the United Kingdom accounted for 22.38% of the European e-brokerage market share in 2025, while Spain is projected to record the fastest 9.33% CAGR through 2031.
Note: Market size and forecast figures in this report are generated using Mordor Intelligence’s proprietary estimation framework, updated with the latest available data and insights as of 2026.
Europe E-Brokerage Market Trends and Insights
Drivers Impact Analysis*
| Driver | (~) % Impact on CAGR Forecast | Geographic Relevance | Impact Timeline |
|---|---|---|---|
| PSD-2–driven account aggregation adoption | +0.3% | EU-wide, the strongest uptake is in the Netherlands and Germany | Medium term (2-4 years) |
| MiFID II–fueled demand for commission transparency | +0.4% | EU-wide | Medium term (2-4 years) |
| Rise of zero-commission "freemium" pricing models | +0.5% | Pan-European, led by German neo brokers | Short term (≤ 2 years) |
| Cloud-native trading cores are lowering the barrier to entry | +0.2% | Global relevance for EU brokers | Long term (≥ 4 years) |
| Embedded-brokerage APIs in neobanks and super-apps | +0.2% | EU with Nordic early adopters | Long term (≥ 4 years) |
| Tokenized securities pilots on DLT rails | +0.1% | EU core markets | Long term (≥ 4 years) |
| Source: Mordor Intelligence | |||
PSD-2–driven account aggregation adoption
Open banking is expanding from payments to broader financial data in 2026, which strengthens customer onboarding and tailoring in the European e-brokerage market. As of late 2025, licensed third-party providers numbered in the thousands across the EU and enabled reliable portfolio views across multiple banks, which lowered acquisition costs for brokers that integrated mature account aggregation flows [1]Aisyah Munir, “The Unfinished Story of European Open Banking: Progress, Gaps and the Road to Open Finance,” Konsentus, konsentus.com. The Netherlands and Germany showed the strongest penetration among digitally active consumers in 2025, which created natural hubs for cross-sell and savings-plan adoption within the European e-brokerage market. The proposed Framework for Financial Data Access is expected to widen the data perimeter to savings, investments, and insurance in the next legislative phase, which could improve risk profiling and dynamic suitability checks for retail accounts. Platforms still operate within strong consent and privacy controls under GDPR, which means raw data monetization is constrained unless users opt in with clear preferences that permit analytics-driven offers.
MiFID II–Fueled Demand for Commission Transparency
The 2024 MiFID II and MiFIR review increased the emphasis on ex-ante and ex-post disclosure of costs for retail clients, which accelerated the shift toward simple fee menus and clearer pricing in the European e-brokerage market. The EU-level ban on payment for order flow, with a temporary exception that expires in mid-2026 for Germany, is pushing platforms to subscription plans, interest on idle cash, and internal venues that keep economics in-house when matching orders. Trade Republic obtained authorization to run a multilateral trading facility in early 2026, which demonstrates how leading brokers expect to sustain unit economics as they move away from third-party market-maker fees. Scalable Capital continues to scale PRIME memberships that bundle zero-commission trading with premium benefits, which helps diversify revenue while maintaining a competitive offer for price-sensitive clients. The regulatory trend rewards scale and operational discipline, which opens room for consolidation as small brokers face fixed-cost pressure from reporting, testing, and product governance requirements across the European e-brokerage market.
Rise of Zero-Commission "Freemium" Pricing Models
Zero-commission equity and ETF execution remains the default acquisition lever in 2026 for many platforms in the European e-brokerage market, while the revenue mix tilts toward subscription tiers and interest income on uninvested cash. Scalable Capital reports continued uptake of its monthly PRIME plan, which combines free execution with rate advantages and faster settlement that resonate with active but fee-conscious users. IG Group has expanded commission-free propositions in select EU markets alongside its derivatives capabilities, which shows full-service players also leveraging freemium entry points to broaden their retail reach in the European e-brokerage market [2]IG Group, “Trading Update 16 Dec 2025,” IG Group, iggroup.com. The EU-wide rule change on payment for order flow is accelerating investments in internal matching and routing that can protect spreads when platform order books are deep enough to support two-sided liquidity. As the pricing bar keeps dropping, successful platforms are building yield-bearing cash accounts and savings plans that reduce revenue volatility and support longer customer lifetimes in the European e-brokerage market.
Cloud-Native Trading Cores Are Lowering the Barrier to Entry
Cloud-native architecture helps new entrants deploy scalable order management and account services with lower up-front spend, which has widened the field of competitors in the European e-brokerage market. The operating leverage at scale is visible when brokers process tens of millions of transactions a year and maintain high uptime for retail sessions across asset classes. Development velocity is also higher when microservices and continuous delivery pipelines allow weekly feature releases without heavy downtime windows, which supports the rapid rollout of new products like fractional bonds or expanded ETF lineups. The Digital Operational Resilience Act, which now applies across the EU, requires robust exit strategies for critical ICT providers and tighter incident reporting, so leading brokers are designing multi-cloud and failover capabilities into their core systems [3]European Insurance and Occupational Pensions Authority, “Digital Operational Resilience Act (DORA),” EIOPA, eiopa.europa.eu. These requirements add governance and testing overhead in the near term, but they should strengthen consumer trust over time and favor platforms with the resources to run resilient, audited infrastructure in the European e-brokerage market.
Restraints Impact Analysis*
| Restraint | (~) % Impact on CAGR Forecast | Geographic Relevance | Impact Timeline |
|---|---|---|---|
| Proposed EU FTT (Financial-Transaction-Tax) | -0.4% | EU-wide, pending the 2026 Commission withdrawal signal | Medium term (2-4 years) |
| Heightened cyber-resilience mandates (DORA) are raising compliance costs | -0.2% | EU-wide, in force from January 17, 2025 | Short term (≤ 2 years) |
| Declining order-flow payments amid regulatory scrutiny | -0.1% | Germany through June 30, 2026, then EU-wide | Short term (≤ 2 years) |
| Retail order-execution quality investigations | -0.05% | EU-wide supervisory coordination | Medium term (2-4 years) |
| Source: Mordor Intelligence | |||
Proposed EU FTT (Financial-Transaction-Tax)
The proposed EU financial transaction tax would impose a levy on equity and bond transfers and a lower rate on derivatives, which could dampen retail trading volumes and reduce intraday activity in the European e-brokerage market if adopted. The European Commission signaled limited prospects for agreement in its 2026 work planning, yet some national governments continue to weigh revenue measures that would place new costs on transactions. A pan-EU tax without carve-outs for market-making or hedging could shift liquidity toward untaxed venues and reduce depth on local exchanges, which would raise execution costs for retail brokers. Corporate and pension stakeholders warn that such a levy would erode household returns by adding friction that compounds over time in savings plans. Platforms with meaningful cross-border flows are especially exposed, because their customers regularly move between local and United States securities, which could face different rules and tax interfaces within the same portfolio in the European e-brokerage market.
Heightened Cyber-Resilience Mandates (DORA) are Raising Compliance Costs
The Digital Operational Resilience Act harmonizes cybersecurity and ICT risk standards across EU financial entities, and now mandates incident reporting, resilience testing, and third-party oversight for brokers and their critical service providers. Firms must maintain a live register of ICT arrangements, monitor concentration risks from large cloud providers, and document clear exit pathways, which increase fixed operating costs in the short term. Supervisory scrutiny has intensified in 2026 as BaFin and other national authorities ramp up event reporting pipelines and coordinate oversight for cross-border incidents that could affect retail execution quality in the European e-brokerage market. The cumulative effect is higher run-rate spending on security operations, disaster recovery, and vendor audits, which small brokers may struggle to absorb without scale benefits. Over the long term, stronger resilience should lift trust and reduce systemic outages, but the near-term margin impact is a meaningful headwind for subscale firms in the European e-brokerage market.
*Our forecasts treat driver/restraint impacts as directional, not additive. The impact forecasts reflect baseline growth, mix effects, and variable interactions.
Segment Analysis
By Investor Type: Retail Surge Driven by Gen-Z Fractional Portfolios and Tax-Wrapper Uptake
Retail investors accounted for 68.65% of the European e-brokerage market in 2025 and are forecast to grow at an 8.23% CAGR through 2031, while the institutional cohort expands at a slower pace from a lower base of client accounts. The Europe e-brokerage market continues to benefit from mobile-first design, fractional investing, and ETF-centric portfolios that fit regular savings behavior, which together raise engagement and reduce churn as balances build over time. AJ Bell reported record annual results in 2025 with strong net inflows and customer growth, which reinforces evidence that retail adoption remains robust even as volatility normalizes from the pandemic years. Nordnet’s savings plans base increased further in 2025, and that cohort now supports persistent monthly contributions across funds and equities that stabilize platform activity in the European e-brokerage market. National wrappers help push long-term participation, with United Kingdom ISAs and European equivalents making it easier for first-time investors to shift from cash to diversified holdings on compliant, transparent platforms.
The institutional segment grows at a slower clip, given direct market access and algorithmic execution that compresses reliance on intermediated retail-style brokerage flows. Within the European e-brokerage industry, platforms increasingly tailor journeys and services by customer tier, which can range from self-directed investors to advised clients with complex planning needs and larger portfolios. The Europe e-brokerage market size at the retail end is reinforced by the continued expansion of automated savings plans and promotional rate offers on cash balances that add a yield component to the value proposition. Regulatory guardrails keep speculative leverage in check for retail users, and Spain’s supervisor continues to enforce strict advertising controls on complex CFDs that push flows toward simpler instruments and diversified ETFs. Italy’s Individual Savings Plans remained a meaningful feature of the domestic landscape in 2025, which shows how targeted tax regimes can support equity and bond holdings when tied to holding periods and portfolio requirements.


By Services Offered: Discount Brokers Triple Commission Income Via Subscription and Embedded Yield
Discount brokers held 51.31% of the European e-brokerage market in 2025 and are expected to post a 12.29% CAGR through 2031 as zero-commission execution, fractional share access, and cash-yield features broaden their appeal. Scalable Capital’s 2025 funding round underscored investor confidence in its blend of subscription brokerage and digital wealth services, which has supported geographic expansion and product depth across ETFs, bonds, and digital assets within the European e-brokerage market. As the payment for order flow channel closes across the EU, the economics of discount platforms are shifting to internal venues, membership tiers, and interest income that can offset the decline in order routing fees. Trade Republic received authorization to run a multilateral trading facility in 2026, which is a concrete example of the pivot toward capturing more of the trading stack inside the platform in the European e-brokerage market. IG Group is also running commission-free propositions alongside core derivatives offerings in select markets, which reflects the broader shift toward low headline fees and diversified monetization models.
Full-service brokers balance advisory-led services with competitive execution and integrate tax-advantaged wrappers on a scale. AJ Bell’s 2025 results highlight how the advice-led and direct-to-consumer channels can reinforce each other when platforms keep fees competitive and service levels high for higher-balance customers. The Europe e-brokerage market size at this end of the spectrum is supported by predictable asset-based fees, which can cushion transaction revenue swings while platforms streamline product shelves and compliance workflows. Portfolio construction support, guided investment solutions, and curated fund ranges continue to be differentiators for customers who seek planning and tax optimization beyond pure execution in the European e-brokerage industry. As the regulatory perimeter tightens, scale benefits and resilient infrastructure will likely widen the gap between leading brands and smaller entrants that struggle to fund both innovation and compliance programs.
By Operation: Cross-Border Flows Accelerate as EU Passporting and Instant Settlements Converge
Domestic operations accounted for 62.64% of the European e-brokerage market in 2025, while foreign operations are projected to grow at a 9.79% CAGR as cross-border trading demand and EU passporting drive multi-country expansion strategies. flatexDEGIRO’s footprint across more than a dozen countries shows how platforms localize onboarding, product, and content while maintaining a shared technology base for scale. Nordnet’s cross-border activity comprises a large share of trades in the Nordics, which underscores retail appetite for international diversification and access to United States securities inside EU-cleared channels in the European e-brokerage market. Equiduct plans to extend access to United States equities for European retail investors during 2026 with an on-exchange, EU-cleared model that settles directly in DTCC, which may reduce frictions for brokers that route client orders to that venue. These developments strengthen the value of multi-currency accounts and real-time FX handling within the European e-brokerage market as cross-border volumes continue to rise.
The European e-brokerage market benefits when platforms monetize cross-border flows through FX spreads, financing, and custodial options, which add stable income streams during periods of low equity turnover. IG Group’s strategy in 2025 and 2026 combined international expansion with acquisitions that strengthened crypto and retail franchises, which shows how cross-border scale can reinforce product breadth. National enforcement still matters, as Italy’s securities regulator blocked hundreds of unauthorized online operators in 2025 and Spain’s supervisor maintained restrictions on the retail promotion of leveraged CFDs, which together raised the bar for foreign participants entering those markets. FX and derivatives activity can spike during macro events, which boosts episodic transaction revenue for multi-asset platforms even when spot equity trading slows in the European e-brokerage market. As settlement cycles shorten and liquidity windows compress across time zones, brokers with mature treasury, pre-funding, and collateral processes will hold operational advantages in cross-border workflows.
Geography Analysis
The United Kingdom accounted for 22.38% of the European e-brokerage market in 2025 and remained an anchor for scaled platforms that combine self-directed trading with wealth solutions. AJ Bell reported record revenue, profit, and customer growth in FY25, which confirms that the United Kingdom’s mature client base continues to add accounts and assets despite fee compression and rising compliance costs. IG Group advanced an M&A and expansion agenda that consolidated a commission-free franchise and prepared the ground for broader crypto and APAC exposure, which strengthens a cross-market growth engine for 2026. The Europe e-brokerage market size in the United Kingdom is shaped by established adviser channels that secure retention for high-balance customers, while low-cost mobile offerings continue to attract first-time investors. Spain stands out for growth as enforcement against abusive operators and clearer rules on complex products push activity toward transparent, authorized platforms in the European e-brokerage market.
Germany anchors two of the leading neobroker brands and a strong retail savings culture, and both factors support regional expansion into adjacent EU markets in 2026. Supervisors have highlighted crypto assets and retail speculation as top risks in 2026, which indicates a continued focus on marketing, onboarding, and anti-abuse controls in the European e-brokerage market. France continues to emphasize oversight of digital onboarding and crypto services in 2026, and the regulator’s priorities point to close monitoring of client communications, influencer activity, and market abuse prevention around retail flows. Italy intensified enforcement during 2025 by blocking a large number of unauthorized websites and coordinating with app stores for takedowns, which helps narrow regulatory arbitrage as EU rules on crypto and digital assets phase in. These national actions knit into EU-level changes that are altering fee structures, disclosure, and ICT risk management, and they collectively strengthen long-term conditions for retail participation in the European e-brokerage market.
The Nordics and Benelux maintain high digital adoption and strong savings behavior, which sustains above-average engagement in savings plans and cross-border allocations in the Europe e-brokerage market. Nordnet continued to scale customers and assets in 2025 and started the formal process to enter Germany, which reflects a strong pipeline for geographic expansion in the region. Eastern Europe remains underpenetrated relative to Western centers, yet product access is improving as low-cost brokers expand and domestic reforms raise incentives for long-term saving. The entry of pan-European venues that target retail flows, such as Equiduct’s on-exchange United States equities model, could further reduce frictions in cross-border execution for EU investors in 2026. These shifts point to a gradual convergence in product access and digital experience quality across regions, even as national tax treatments and local wrappers preserve meaningful country-level differences in the Europe e-brokerage market.
Competitive Landscape
Competition in the European e-brokerage market is defined by a mix of regional specialists and global brokers, with no single player able to dominate across all major geographies and product sets in 2026. United Kingdom incumbents such as AJ Bell continue to show scale advantages in customer retention and multi-channel growth, which reflects brand strength and operational discipline in a mature setting. Pan-Nordic leaders like Nordnet are leveraging strong digital engagement and savings momentum to enter larger markets, which shows how regional champions can scale their operating model beyond their home base in the European e-brokerage market. German-origin neobrokers are pushing further into Southern and Eastern Europe in 2026, while European units of global brokers maintain a presence among more sophisticated retail and institutional traders. Product breadth and mobile experience remain central to acquisition and engagement in the European e-brokerage market.
Strategic moves in 2025 and 2026 show consolidation and vertical integration moving in tandem across the European e-brokerage market. IG Group completed the acquisition of Freetrade and pursued a regulated crypto exchange stake to support broader product agendas in 2026, while extending buybacks that signal confidence in capital generation. flatexDEGIRO adopted a new capital allocation policy in early 2026 that introduced a regular dividend and preserved flexibility for organic expansion and selective M&A, which suggests a balanced approach to growth and shareholder returns. The launch of pan-European infrastructure such as Euronext’s ETF marketplace aims to unify fragmented pools and enhance liquidity, which could reduce execution costs and improve spread quality for end investors over time. Venue innovation and broker internalization strategies are likely to coexist as firms tune routing logic to optimize client outcomes and platform-level economics in the European e-brokerage market.
Technology capabilities continue to differentiate leaders in the European e-brokerage market. Interactive Brokers offers access to a wide set of markets and products through a single account and continues to enhance desktop and routing tools for active clients in European hubs. Nordnet’s community and content programs have grown alongside core brokerage services, which align with high engagement and systematically increasing savings in the Nordics. Trade Republic’s early 2026 authorization to run an internal trading venue demonstrates a trend toward deeper control of the execution stack among scaled retail platforms in the European e-brokerage market. As regulatory and cost headwinds persist, capability moats increasingly come from reliable execution, strong treasury, and data-driven personalization, supported by resilient infrastructure that meets DORA standards.
Europe E-Brokerage Industry Leaders
eToro Ltd.
DEGIRO / flatexDEGIRO AG
Saxo Bank A/S
IG Group Holdings plc
Interactive Brokers LLC
- *Disclaimer: Major Players sorted in no particular order

Recent Industry Developments
- February 2026: flatexDEGIRO SE adopted a new capital allocation policy emphasizing growth-oriented principles, including a regular dividend distribution of 20% of net income for 2025 and flexibility for organic growth, consolidation steps, and opportunistic buybacks.
- February 2026: IG Group Holdings, following MAS approval, completed its acquisition of Independent Reserve to enhance cryptocurrency trading services in Singapore, Australia, and the UAE by utilizing the acquired platform's infrastructure.
- November 2025: AJ Bell plc divested its Platinum SIPP and SSAS business to InvestAcc, streamlining operations and enabling a sharper focus on its core advised and direct-to-consumer platform segments.
- May 2025: Equiduct launched its Swiss equity segment, offering Apex retail brokers access to 138 liquid Swiss-listed stocks priced in CHF, supported by market makers and interoperable clearing via pan-European CCPs.


Europe E-Brokerage Market Report Scope
E-brokerage facilitates the trading of financial securities, including stocks, bonds, and mutual funds, via digital platforms, enabling investors to execute trades, access real-time data, and manage portfolios independently.
By Investor Type
| Retail |
| Institutional |
By Services Offered
| Full-Service Brokers |
| Discount Brokers |
By Operation
| Domestic |
| Foreign |
By Geography
| United Kingdom |
| Germany |
| France |
| Spain |
| Italy |
| BENELUX (BE, NL, LU) |
| NORDICS (DK, FI, IS, NO, SE) |
| Rest of Europe |
| By Investor Type | Retail |
| Institutional | |
| By Services Offered | Full-Service Brokers |
| Discount Brokers | |
| By Operation | Domestic |
| Foreign | |
| By Geography | United Kingdom |
| Germany | |
| France | |
| Spain | |
| Italy | |
| BENELUX (BE, NL, LU) | |
| NORDICS (DK, FI, IS, NO, SE) | |
| Rest of Europe |


Key Questions Answered in the Report
What is the projected size and growth of the European e-brokerage market through 2031?
The Europe e-brokerage market size is expected at USD 134.39 billion in 2026 and is projected to reach USD 145.51 billion by 2031 at a 1.6% CAGR.
Which investor segment leads the European e-brokerage market in 2026?
Retail investors lead, after holding 68.65% share in 2025, and they continue to expand on mobile-first access and tax-wrapped savings plans across the region.
Which service model is growing the fastest in the European e-brokerage market?
Discount brokers are the fastest-growing service model, supported by freemium pricing, membership tiers, and interest income strategies that stabilize revenue.
Which geographies are most important in the European e-brokerage market today?
The United Kingdom is the largest by value with a 22.38% share in 2025, while Spain is the fastest growing with a projected 9.33% CAGR to 2031.
How are regulations shaping broker strategies in Europe in 2026?
MiFID II transparency, the EU ban on payment for order flow, and DORA's resilience rules are pushing brokers to subscriptions, internal venues, and stronger ICT governance.
What recent corporate moves signal momentum in the European e-brokerage market?
IG Group’s acquisition of Freetrade and flatexDEGIRO’s new capital allocation policy show consolidation and disciplined growth, while Scalable Capital’s 2025 funding round supports expansion and product depth.
Page last updated on:


