Market Overview
| Study Period | 2020 - 2031 |
|---|---|
| Forecast Data Period | 2026 - 2031 |
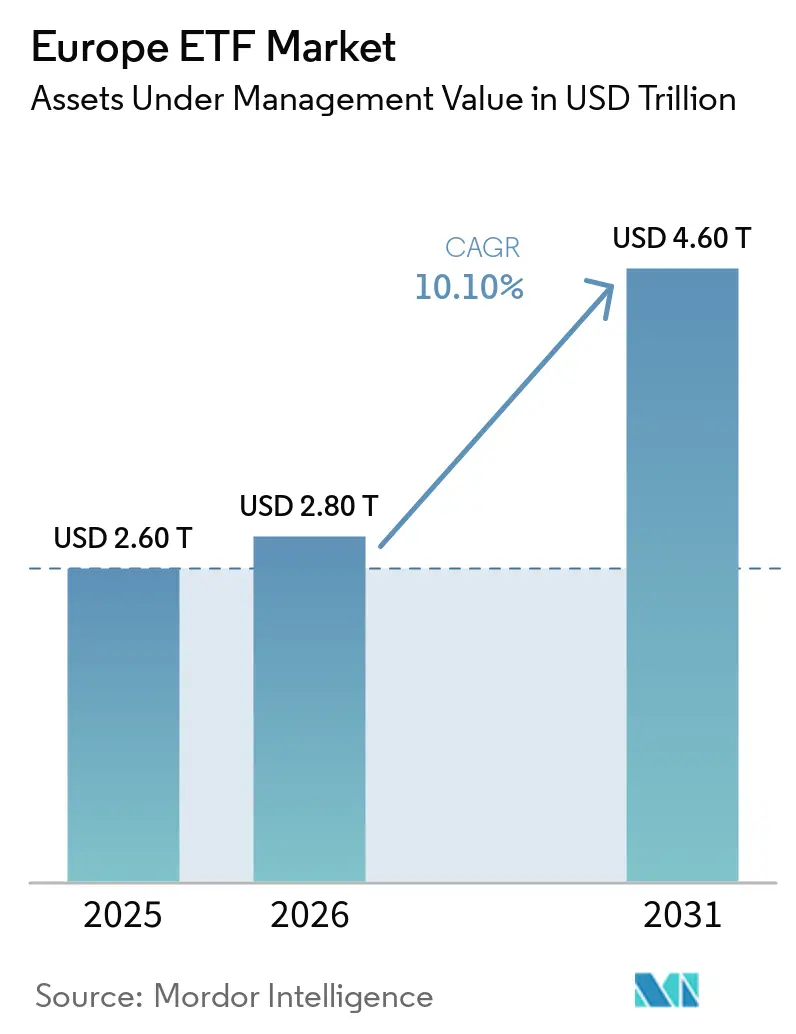
| Base Year Market Size (2025) | USD 2.60 Trillion |
| Market Size (2026) | USD 2.80 Trillion |
| Market Size (2031) | USD 4.60 Trillion |
| Growth Rate (2026 - 2031) | 10.10% CAGR |
| Market Concentration | Medium |
Major Players *Disclaimer: Major Players sorted in no particular order Image © Mordor Intelligence. Reuse requires attribution under CC BY 4.0. | |
Europe ETF Market Analysis by Mordor Intelligence
The Europe ETF Market size in terms of assets under management value is expected to increase from USD 2.60 trillion in 2025 to USD 2.80 trillion in 2026 and reach USD 4.60 trillion by 2031, growing at a CAGR of 10.10% over 2026-2031.
The Europe ETF market is benefiting from clear rulemaking on sustainability classifications, the rollout of a consolidated tape that aims to reduce data fragmentation, and lower total cost of ownership for investors as market data access improves. The Europe ETF market is also seeing steady growth in passive allocations within the UCITS framework as fees compress, while systematic active ETFs widen institutional use cases under more accommodating disclosure regimes in Ireland and Luxembourg. The Europe ETF market is capturing stronger flows into short-duration corporate bonds and selected European equity exposures, with asset gathering shaped by monetary policy expectations and sector rotation. The Europe ETF market remains operationally anchored in Ireland and Luxembourg, whose UCITS domiciles and fund administration depth support cross-border distribution at scale.
Key Report Takeaways
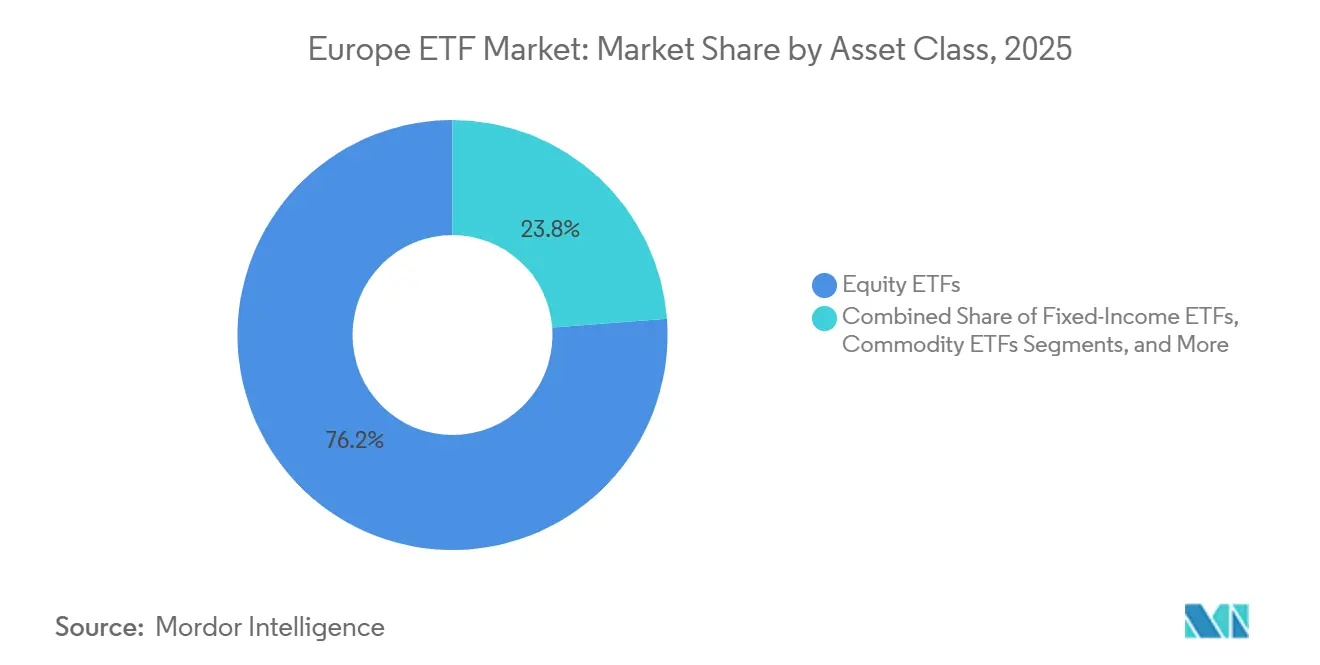
- By asset class, equity led the Europe ETF market with 76.2% of the Europe ETF market share in 2025; fixed income is projected to expand at a 10.1% CAGR through 2031.
- By investment strategy, passive products held 97.7% of the Europe ETF market in 2025; active strategies are projected to record the highest 18.1% CAGR through 2031.
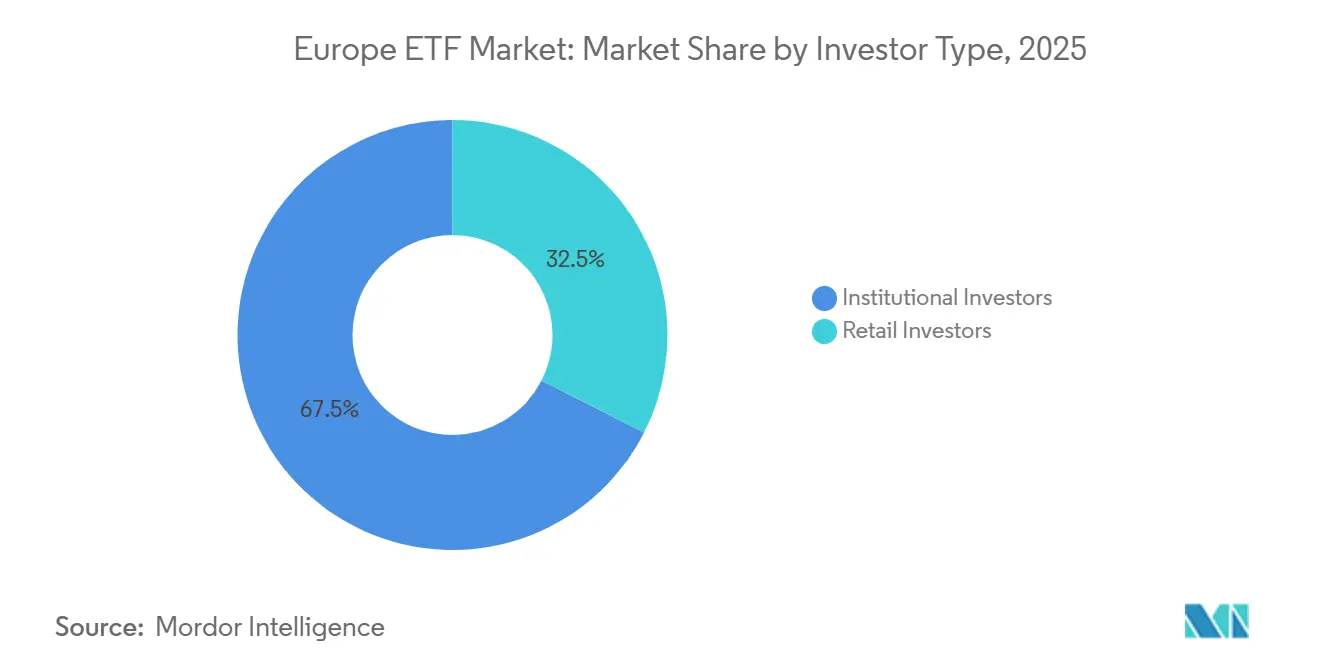
- By investor type, institutional investors accounted for 67.5% of the Europe ETF market in 2025; retail is projected to grow at a 13.0% CAGR through 2031 for the Europe ETF market size.
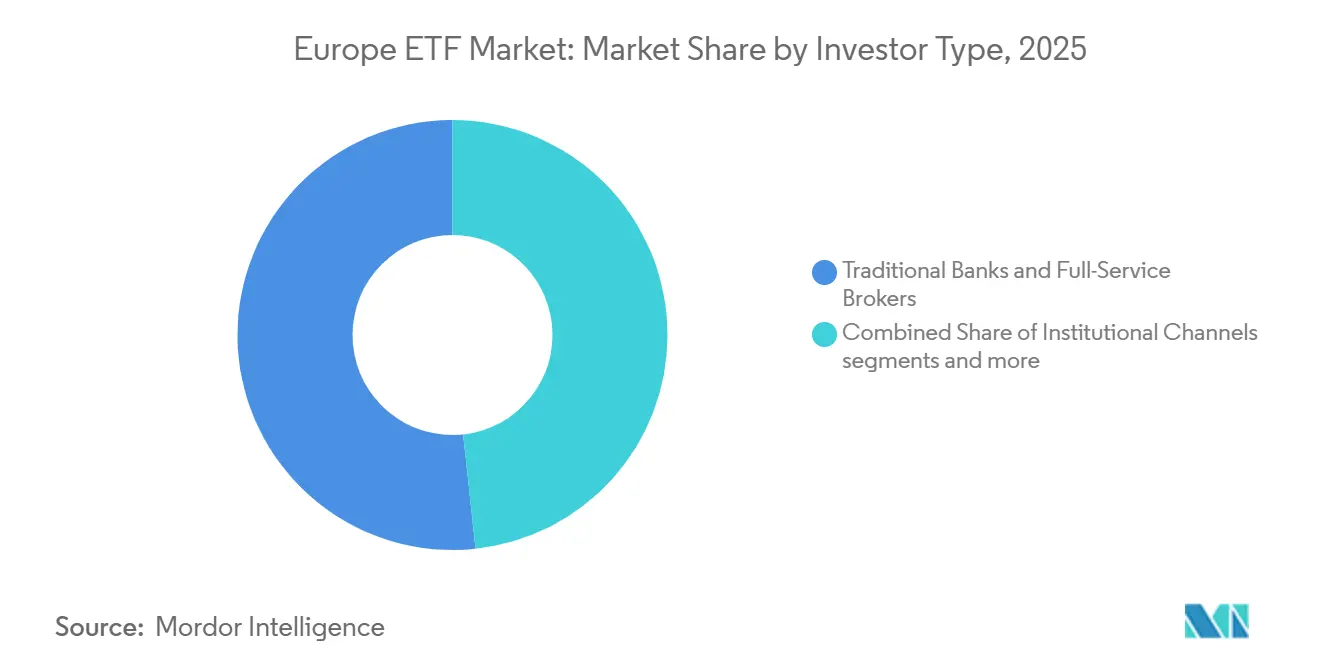
- By distribution channel, traditional banks and full-service brokers held 51.7% of the Europe ETF market in 2025; direct and digital retail platforms are projected to grow at a 15.8% CAGR through 2031 for the Europe ETF market size.
- By geography, the Netherlands led the Europe ETF market with a 52.8% share in 2025; Italy is projected to expand at an 11.8% CAGR through 2031, driving the Europe ETF market.
Note: Market size and forecast figures in this report are generated using Mordor Intelligence’s proprietary estimation framework, updated with the latest available data and insights as of 2026.
Europe ETF Market Trends and Insights
Drivers Impact Analysis*
| Driver | (~) % Impact on CAGR Forecast | Geographic Relevance | Impact Timeline |
|---|---|---|---|
| Record inflows and AUM highs in Europe ETFs | +3.2% | Global, with strongest momentum in Germany, Ireland, France | Short term (≤ 2 years) |
| Passive share expansion and retail adoption via online platforms | +2.8% | Germany, Netherlands, France core, spill-over to Nordics and Benelux | Medium term (2-4 years) |
| SFDR 2.0 clarity and EU Climate Benchmarks catalyzing climate ETFs | +1.5% | EU-wide, especially Ireland and Luxembourg domiciled funds | Medium term (2-4 years) |
| Consolidated tape and venue innovation reducing fragmentation and TCO | +1.8% | EU-wide, with EuroCTP infrastructure | Medium term (2-4 years) |
| Systematic active ETFs broadening use-cases | +1.9% | Global institutional, early adoption in UK, Netherlands, Nordics | Long term (≥ 4 years) |
| Thematic surges in defense and resources attracting new adopters | +1.1% | Europe-wide, concentrated in France, Germany, Italy | Short term (≤ 2 years) |
| Source: Mordor Intelligence | |||
Record Inflows and AUM Highs Reflect Structural Adoption
Europe’s exchange-traded vehicles have accelerated since 2024 as UCITS platforms lifted cross-border sales, and Ireland and Luxembourg remained the two dominant ETF domiciles by net assets. The Europe ETF market is seeing broad-based participation across equities and fixed income, with investors tactically extending duration in government bonds and redeploying risk into select regional equity exposures. Ireland’s regulatory flexibility on portfolio disclosure for ETFs since April 2025 has reduced barriers for active product launches and improved operational predictability for issuers. The Europe ETF market is also benefiting from UCITS fund administration depth and distribution networks that support efficient passporting across member states[1]EFAMA Research Team, “Trends in European Investment Funds Fact Book 2025,” European Fund and Asset Management Association, efama.org. These operational features underpin network effects and steady inflows, reinforcing the structural nature of adoption rather than a short-term beta swing.
Passive Share Expansion Driven by Retail Digitalization
Index UCITS and UCITS ETFs expanded their footprint in 2024, supported by fee compression that continues to lower the hurdle for long-term allocation. The Europe ETF market has gained from online brokerage and standardized digital platforms that deliver more consistent costs across member states than legacy channels. Neo-brokers remain small in assets but are growing quickly and are most influential among younger cohorts who favor automated savings plans and online investing[2]ESMA Staff, “MiFIR Review Final Report on Derivatives, Transparency, Packages, and CTP Input Output,” European Securities and Markets Authority, esma.europa.eu. Retail penetration remains uneven across major markets, which preserves a long runway for growth as investor education and digital access continue to improve. As fees converge and product breadth improves, the Europe ETF market is positioned to capture a larger share of household financial assets across the region.
SFDR 2.0 Recalibration Clarifies Climate ETF Positioning
The European Commission’s SFDR 2.0 proposal introduces new Transition, ESG Basics, and Sustainable categories and sets clearer investment alignment thresholds, which reduces ambiguity for product labeling. The Europe ETF market stands to benefit from this taxonomy through better product comparability and more predictable flows into climate benchmarks that align with Paris Agreement norms and the EU Climate Benchmarks standards. The new rules expand the perimeter to products distributed to professional and retail investors alike, which widens the addressable base for sustainable ETFs. Implementation choices, such as asset-level versus portfolio-level assessment, will shape data requirements and operational processes for issuers. Clearer policy signals have already supported defense allocations that meet ESG policies under EU guidance while excluding controversial weapons, a change reflected in new defense-themed products and flows.
Consolidated Tape Infrastructure Promises TCO Reduction
ESMA’s MiFIR review and technical standards outline how a consolidated tape provider will harmonize trade data and improve transparency across venues for shares and ETFs. The Europe ETF market should see lower data fragmentation costs and a fairer depiction of liquidity which can support better execution outcomes for both retail and institutions. Broader access to standardized, real-time data improves order routing, best execution practices, and cross-border flows within UCITS distribution. Post-trade transparency will make price discovery more robust in a landscape where a significant share of trading occurs away from lit exchanges. The effectiveness of the tape will depend on the breadth of coverage and the depth of pre-trade information, which are key to commercial viability for market makers and end investors.
Restraints Impact Analysis*
| Restraint | (~) % Impact on CAGR Forecast | Geographic Relevance | Impact Timeline |
|---|---|---|---|
| Inducement-driven distribution dampens low-cost ETF uptake | -1.4% | France, Belgium, Southern Europe, Dutch ban already in effect | Medium term (2-4 years) |
| Fragmented pre and post-trade data and off-exchange trading opacity | -0.9% | EU-wide fragmentation across many exchanges | Medium term (2-4 years) |
| UCITS eligible-assets review curbs alternative exposures | -0.8% | Ireland and Luxembourg domiciled funds, EU-wide impact | Long term (≥ 4 years) |
| Benchmarks Regulation scope changes create index continuity risk | -0.6% | EU-wide, third-country regime implications | Medium term (2-4 years) |
| Source: Mordor Intelligence | |||
Inducement-Driven Distribution Model Under Regulatory Pressure
ESMA’s analysis shows inducements account for a large share of ongoing costs for retail fund distribution in UCITS and AIFs, creating conflicts of interest risks and opacity in pricing. The Netherlands has banned retail inducements which creates asymmetry within the single market and encourages direct and digital channels that align well with ETFs. In France, recent supervisory actions require management companies to evidence that inducements improve service quality for clients rather than serve as embedded commissions. Such scrutiny tightens the economics for distributors that rely on retrocessions which can slow uptake of higher touch products that need advisor explanation. The Europe ETF market stands to gain in low-cost segments even as active ETF distribution may face headwinds in markets where inducements remain central to revenue models.
Off-Exchange Trading Fragments Liquidity Depiction
A large share of European ETF trading occurs off-exchange through RFQ platforms and systematic internalizers, which reduces visibility into true liquidity for end investors. Market participants navigate many execution venues, which raises complexity for best execution and policy design for buy-side firms. The Europe ETF market should benefit from the consolidated tape as it adds standardized, high-quality post-trade data that can improve routing and pricing. Minimum quote size proposals and scope refinements under MiFIR for equities and ETFs aim to reduce opacity and harmonize practices. Improved transparency is essential to attract more international participation and to fairly represent ETF liquidity in Europe.
*Our forecasts treat driver/restraint impacts as directional, not additive. The impact forecasts reflect baseline growth, mix effects, and variable interactions.
Segment Analysis
By Asset Class: Equity Dominance Persists Amid Fixed-Income Acceleration
Equity ETFs held 76.2% in 2025, anchoring the Europe ETF market share at the asset class level while fixed income is projected to grow at 10.1% CAGR through 2031 for the Europe ETF market size. Within equities, flows since 2025 have increasingly favored European exposures, all-world blends, and selective emerging markets, showing diversification beyond mega-cap U.S. concentration[3]Amundi Editorial Team, “2025 Record Year for European ETFs,” Amundi, etfexpress.com. European equity ETFs drew record annual net new assets with notable tilts toward industrials, information technology, and financials, while defense-related strategies gathered meaningful allocations. Income-oriented equity approaches also saw traction as investors balanced risk with yield and volatility considerations during policy transitions. These patterns support a more balanced regional risk budget and a tilt toward sectors aligned with strategic autonomy and capital investment needs in Europe.
Short-duration euro corporate bonds and targeted exposure to U.S. Treasuries along the front end of the curve characterize fixed-income momentum. Investors favored one to five-year corporate maturities and ultra-short strategies, which captured a large share of 2025 inflows as duration risk was managed carefully. Government bonds saw renewed demand across Europe and the U.S. as rate expectations evolved and investors sought balance within multi-asset portfolios. ESG-linked fixed income strategies maintained strong traction, representing an increased portion of flows in the asset class compared to ESG equity allocations. Commodity exposures contributed to portfolio ballast as gold demand recovered, aligning with a broader appetite for diversification within the Europe ETF market.


By Investment Strategy: Passive Supremacy With Active Insurgency
Passive ETFs represented 97.7% of assets in 2025, illustrating the cost and simplicity advantages that underpin adoption in the European ETF market. Ongoing charges for UCITS ETFs continued to decline through 2024, which widened the gap versus traditional active mutual funds and reinforced the value case for passive under UCITS. Growth in index UCITS and ETFs has been a defining feature of the UCITS ecosystem with fee competition fostering scale benefits across cross-border platforms. These dynamics support continued share stability for passive products in core asset allocation roles within retail and institutional portfolios[4]Investment Company Institute Authors, “Ongoing Charges for UCITS in the European Union, 2024,” Investment Company Institute, ici.org. As the consolidated tape improves data access and transparency, passive strategies could achieve even better execution quality, which may further cement their role.
Active ETFs are projected to grow at 18.1% CAGR through 2031 for the Europe ETF market size as systematic approaches address transparency and governance preferences for institutions. Investors increasingly value enhanced indexing and rules-based strategies that target factors or inefficiencies within a low-cost wrapper that trades intraday. Adoption remains subject to product availability and track record needs, with many buyers seeking three to five years of live performance before allocating at scale. Portfolio disclosure frameworks in Ireland and Luxembourg have reduced perceived front-running risks and encouraged more traditional managers to consider ETF share classes. The Europe ETF market will likely see a broader lineup of active funds across equities and fixed income as larger managers and new entrants expand their UCITS ranges.
By Investor Type: Institutional Core With Retail Momentum
Institutional investors held 67.5% share in 2025 which reflects long-standing usage of ETFs for rebalancing, transition management, and liquidity sleeves in the Europe ETF market. Central banks, pension funds, and insurance companies increasingly rely on ETFs for tactical and strategic exposures under UCITS due to operational simplicity and transparency. Returns to strategic asset allocation frameworks and robust execution standards have reinforced ETFs as building blocks for policy portfolios. In parallel, defined contribution growth in several European jurisdictions is creating fertile ground for ETF usage in retirement wrappers. Institutional demand remains especially strong in fixed income, where ETFs support liquidity and price discovery in markets that historically traded over the counter.
Retail investors are projected to grow at 13.0% CAGR through 2031 within the Europe ETF market size as digital savings plans and online brokerage compress access frictions. UCITS fee transparency and standardized disclosures support retail confidence while digital channels lower minimums and enable systematic investing behavior. Northern European markets show deeper digital usage, which indicates ample runway for convergence across countries with lower penetration. Country-specific tax-advantaged savings accounts and pension reforms can further catalyze retail participation where infrastructure and regulation align. As investor education scales, the European ETF market should continue to gain household share in diversified, low-cost portfolios.
By Distribution Channel: Digital Disruption Accelerates
Traditional banks and full-service brokers held 51.7% share in 2025 and remain central distribution nodes for the European ETF market. Their role is shaped by inducement rules and national guidance, which influence economics for advisory engagement and product selection. Credit institutions and investment firms dominate retail distribution in many EEA countries, with significant cross-country variation due to regulatory and cultural factors. For high-net-worth and mass affluent investors, advisors and wealth managers remain key in portfolio construction and tax optimization using UCITS ETFs. Institutional channels, including consultants and fiduciary managers, continue to integrate ETFs into strategic mandates.
Direct and digital retail platforms are projected to grow at 15.8% CAGR through 2031, reflecting a shift toward online brokers, robo-advisors, and mobile-first investing in the Europe ETF market. Neo-brokers, while still small in assets, have lower and more uniform costs across countries and are expanding their role in ETF distribution. Issuers are increasingly partnering with digital platforms to embed ETF access into day-to-day financial apps and monthly savings mechanisms. These channels are particularly effective among younger investors who value automation and low minimums, which supports steady dollar-cost averaging behavior. As inducement reforms advance, direct digital platforms should consolidate their share within the European ETF market by aligning incentives with low-cost products.
Geography Analysis
The Netherlands held 52.8% country-level share in 2025 for the Europe ETF market which reflects the concentration of UCITS domicile and trading infrastructure rather than ultimate investor domicile. Ireland and Luxembourg together represented the vast majority of cross-border fund assets by the end of 2024, which underpins the region’s distribution efficiency. Ireland strengthened competitiveness with portfolio disclosure flexibility for ETFs in 2025 under the Central Bank of Ireland which is supportive for active strategies. Luxembourg maintained a leading domicile position while modernizing its supervisory regime for non-retail products and refining tax and operational policies relevant to ETFs and share classes. ETF share class structures managed within mutual funds continue to evolve in Luxembourg, supported by custody and administration depth.
Italy is projected to be the fastest-growing country at 11.8% CAGR through 2031 within the Europe ETF market size, helped by digital savings adoption and regulatory simplification for fund vehicles. Germany’s growing base of monthly ETF savings accounts contributes sizable inflows to UCITS bonds and equity ETFs and illustrates how retail behavior supports structural growth. The UK continues to deepen investor access through the Overseas Funds Regime which gives UCITS ETFs a clear marketing pathway despite local domiciles remaining limited for ETFs. UCITS index trackers have reached record assets in the UK, which signals mainstream adoption of low-cost exposures within the investment funds universe. Spain and Portugal are also active fund markets where UCITS distribution is subject to national supervision and exchange listing protocols that support ETF liquidity.
The Nordics show high financial literacy and substantial retail securities ownership with active exchange ecosystems such as Nasdaq Stockholm supporting listings and liquidity for ETFs and ETNs. Denmark’s tax-advantaged accounts and growing household ETF participation underscore the retail runway in Northern Europe. The rest of Europe includes several high-growth markets in Central and Eastern Europe, where UCITS assets expanded rapidly in 2024 under favorable inflows and currency effects. Switzerland remains a significant cross-border investor base with robust online platform usage for ETFs and strong participation in the UCITS complex. Across these geographies, the Europe ETF market is supported by domicile strengths, regulatory clarity, and increasingly digital investor journeys.
Competitive Landscape
The Europe ETF market remains concentrated with a small group of large issuers holding a majority of assets, while a long tail of providers expands product choice through white-label and ETF-as-a-Service models. Competition is shifting from fee-only battles to innovation in active strategies, thematics aligned with policy themes, and alternative access via UCITS-compliant structures. Strategic moves by large managers include launching swap-based and factor-targeted products and broadening fixed-maturity bond ETFs to meet yield and laddering needs.
Issuers are tailoring approaches by client segment with some emphasizing retail distribution breadth and low-cost cores and others advancing white-label partnerships to onboard new managers into UCITS. The Europe ETF market is also seeing new defense and strategic autonomy products that respond to policy and fiscal signals in the region. Technology investments in cloud-native infrastructure and data services are key differentiators for scalability and low-cost operations across cross-border markets. As the consolidated tape improves market data access, smaller issuers could compete more effectively on execution quality and transparency.
Unmet demand remains in small and mid-cap European equity inclusion, active fixed income segments such as high yield and securitized credit, and structured outcome strategies for downside cushioning and income. White-label platforms and partnerships will likely continue to fragment the long tail by easing capital markets setup and distribution entry, which broadens the Europe ETF market for specialized exposures. Regulatory timelines and domicile expertise in Ireland and Luxembourg remain tangible advantages for established issuers that can navigate approvals efficiently.
Europe ETF Industry Leaders
BlackRock – iShares
Amundi (incl. Lyxor)
DWS – Xtrackers
UBS Asset Management
Vanguard
- *Disclaimer: Major Players sorted in no particular order

Recent Industry Developments
- March 2026: DWS’s Xtrackers launched the Xtrackers Europe Defense Technologies ETF that tracks a STOXX index focused on defense and cybersecurity innovators.
- November 2025: Amundi partnered with Euronext to launch the Amundi European Strategic Autonomy UCITS ETF providing equal-weighted exposure to ten themes spanning energy, grids, infrastructure, logistics, food security, pharmaceuticals and chemicals, software, semiconductors, financials, and aerospace and defense.
- November 2025: Amundi announced its 2025-2028 strategic plan with commitments to launch 100 new ETFs, enhance active and white-label capabilities, and deepen technology investments.
- November 2025: UBS Asset Management launched two Indian equity UCITS ETFs, one swap-based and one physically replicating, listed on SIX Swiss Exchange, Xetra, and Borsa Italiana.


Research Methodology Framework and Report Scope
Market Definitions and Key Coverage
Our study defines the Europe ETF market as the combined assets under management (AUM) of exchange-traded funds authorized under European regimes (primarily UCITS) and listed on at least one European exchange; all equity, fixed-income, commodity, money-market, mixed-asset, and alternative strategy ETFs are counted. We convert local currency disclosures into year-average USD so readers view like-for-like values.
Scope Exclusion: We intentionally leave out leveraged or inverse ETPs, exchange-traded notes, and commodity vehicles that are not structured as ETFs.
Segmentation Overview
- By Asset Class
- Equity ETFs
- Fixed-Income ETFs
- Commodity ETFs
- Currency ETFs
- Real-Estate ETFs
- Alternative ETFs
- By Investment Strategy
- Active
- Passive
- By Investor Type
- Retail
- Institutional
- By Distribution Channel
- Direct and Digital Retail Platforms
- Financial Advisors and Wealth Managers
- Institutional Channels
- Traditional Banks and Full-Service Brokers
- By Country
- United Kingdom
- Germany
- France
- Spain
- Italy
- Benelux (Belgium, Netherlands, and Luxembourg)
- Nordics (Sweden, Norway, Denmark, Finland, and Iceland)
- Rest of Europe
Detailed Research Methodology and Data Validation
Primary Research
We spoke with ETF issuers, authorized participants, robo-advisers, and custodians across the United Kingdom, Germany, Ireland, and the Nordics. Their insights let us stress-test preliminary numbers, refine fee-compression assumptions, and verify retail-account growth rates.
Desk Research
We draw daily AUM and flow files released by trading venues such as Euronext, Xetra, and SIX; review UCITS filings on the ESMA register; and pull household securities-holding data from the European Central Bank. Trade associations such as EFAMA, BVI, and AFG help us gauge distribution patterns, while company reports, investor presentations, and Dow Jones Factiva news feeds confirm issuer revenues and launches. D&B Hoovers supplies promoter-level financials. These references are illustrative; many additional public and proprietary records inform our desk work.
Market-Sizing & Forecasting
We begin with a top-down build that averages monthly exchange-reported AUM, rebases every figure to USD, and allocates totals by asset class, strategy, and domicile. Bottom-up checks, sampled promoter roll-ups, and indicative average-price-times-units act as guardrails. Key variables include net flow momentum, secondary-market turnover, savings-plan penetration, fee trends, and regulatory shifts such as SFDR Level 2. A multivariate regression on these drivers projects assets through 2030, while scenario analysis captures pending rule changes. Missing data, for example, on private platforms, is bridged with peer ratios validated in interviews.
Data Validation & Update Cycle
We run variance screens that flag movements beyond two standard deviations, after which a senior reviewer audits each model. Reports refresh annually, and we issue interim updates when material events, like a MiFID amendment, alter market fundamentals. Clients therefore receive the latest vetted view.
Why Mordor's Europe ETF Industry Size & Share Analysis Baseline Stand Up to Scrutiny
We recognize published ETF figures often diverge because firms use different asset scopes, snapshot dates, or currency bases.
Mordor Intelligence applies a rolling average, adds cross-listings back to home assets, and locks year-end dollar rates, lowering noise and boosting comparability.
Benchmark comparison
| Market Size | Anonymized source | Primary gap driver |
|---|---|---|
| USD 2.58 T (2025) | Mordor Intelligence | |
| USD 2.37 T (2025) | Regional Consultancy A | Mid-year snapshot; leaves out active ETF share classes and commodity ETPs |
| USD 2.30 T (2024) | Industry Association B | Uses year-end point; covers only Ireland and Luxembourg domiciles; no currency normalization |
These comparisons show that our disciplined scope choices, consistent currency treatment, and annualized smoothing give decision-makers a dependable, transparent baseline they can trace to verifiable exchange prints and issuer filings.


Key Questions Answered in the Report
What is the Europe ETF market outlook through 2031?
The Europe ETF market size is expected to grow from USD 2.6 trillion in 2025 to USD 4.6 trillion by 2031 at 10.0% CAGR over 2026-2031.
Which asset class leads allocations in the Europe ETF market?
Equity remains the largest with 76.2% share in 2025 while fixed income is the fastest growing with a projected 10.1% CAGR through 2031.
How is regulation shaping the Europe ETF market in 2026?
SFDR 2.0 clarifies sustainability categories and the consolidated tape under MiFIR will improve data transparency which together strengthen product labeling and execution.
What is driving retail adoption in the Europe ETF market?
Fee compression under UCITS and the rise of direct digital platforms and savings plans are enabling systematic retail participation across markets.
Which countries are most pivotal for ETF domiciles in Europe?
Ireland and Luxembourg together account for the vast majority of cross-border fund assets and provide the leading UCITS infrastructure for ETFs.
How are active ETFs evolving in the Europe ETF market?
Systematic active ETFs are gaining traction with institutions due to transparency and governance fit while quarterly or monthly disclosure frameworks reduce operational barriers.
Page last updated on:


