
UK Pension Funds Market Size and Share
Market Overview
| Study Period | 2020 - 2031 |
|---|---|
| Forecast Data Period | 2026 - 2031 |
| Base Year Market Size (2025) | USD 3.23 Trillion |
| Market Size (2026) | USD 3.36 Trillion |
| Market Size (2031) | USD 4.09 Trillion |
| Growth Rate (2026 - 2031) | 4.01 % |
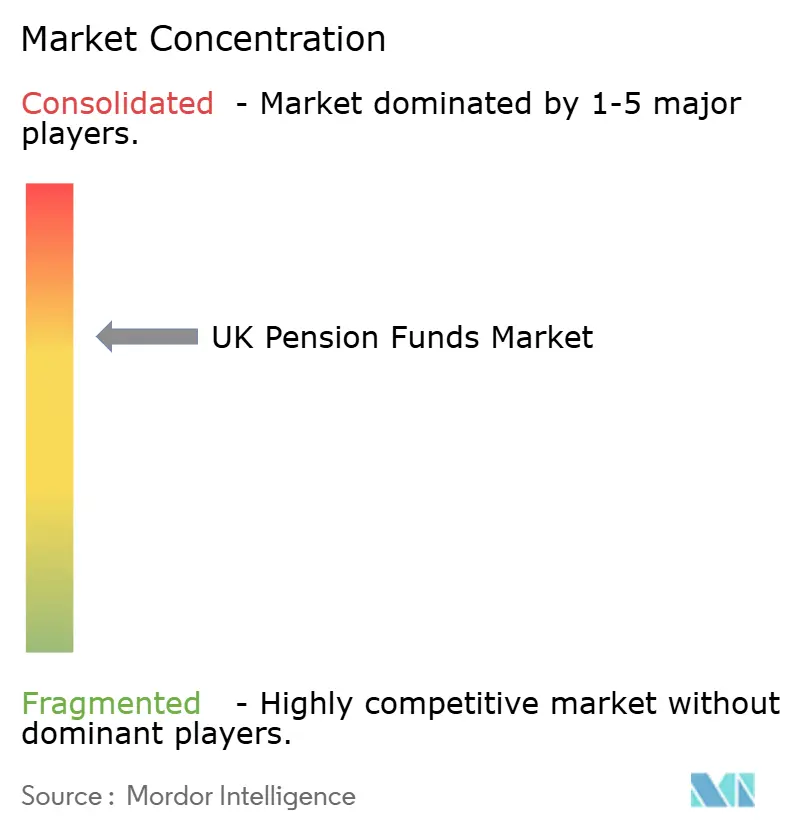
| Market Concentration | Medium |
Major Players *Disclaimer: Major Players sorted in no particular order Image © Mordor Intelligence. Reuse requires attribution under CC BY 4.0. | |
UK Pension Funds Market Analysis by Mordor Intelligence
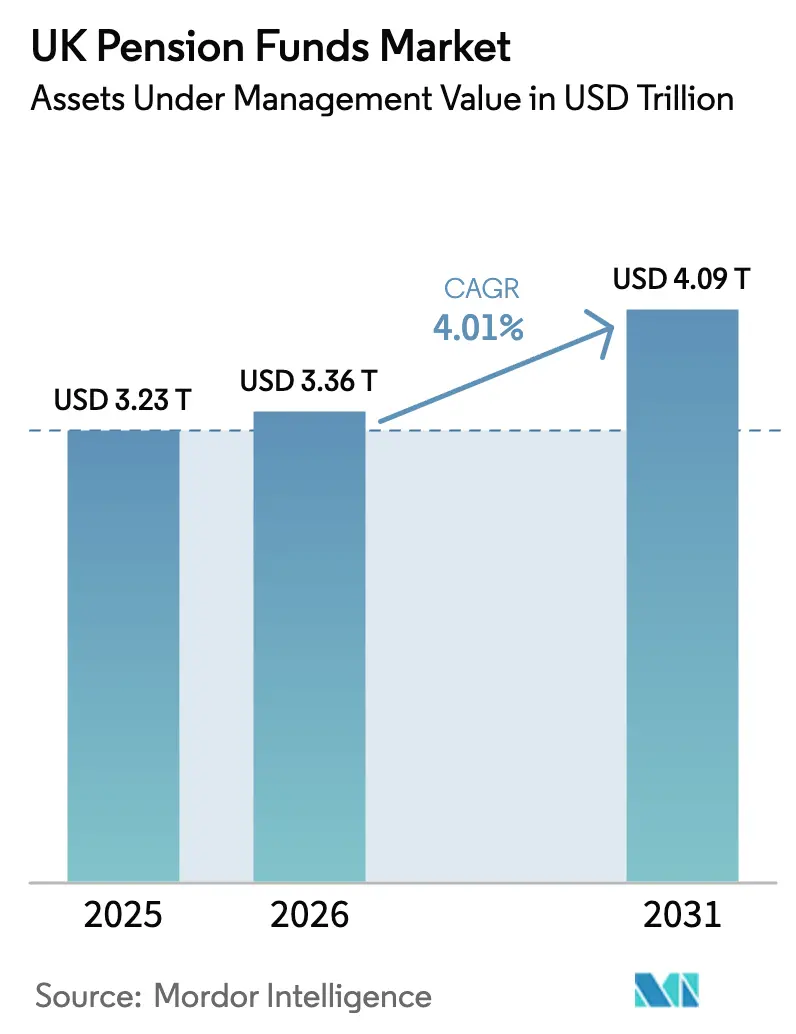
The UK pension funds market size was valued at USD 3.23 trillion in 2025 and estimated to grow from USD 3.36 trillion in 2026 to reach USD 4.09 trillion by 2031, at a CAGR of 4.01% during the forecast period (2026-2031). Ongoing policy reforms, mounting consolidation pressure, and the Mansion House Accord are reshaping investment appetites, steering fresh capital toward private markets and domestic infrastructure. Bulk-annuity activity is intensifying, de-risking mature defined benefit (DB) schemes while releasing corporate balance-sheet capacity for growth projects. Meanwhile, auto-enrolment keeps enlarging the contributor base, lifting defined contribution (DC) assets and compelling master trusts to refine digital member services. Although offshore allocations remain significant, a visible pivot toward onshore assets signals renewed confidence in the UK growth story.
Key Report Takeaways
- By plan type, defined benefit schemes held 54.02% of the UK pension funds market share in 2025, while defined contribution assets are set to expand at a 6.92% CAGR through 2031.
- By investment strategy, active mandates controlled 63.05% of the UK pension funds market share in 2025; passive strategies are forecasted to grow at 5.75% CAGR to 2031.
- By sponsor type, private-sector arrangements accounted for 63.68% of the UK pension funds market share in 2025, whereas public-sector schemes are projected to rise at a 5.51% CAGR through 2031.
- By geography of investment, offshore portfolios captured 56.54% share of the UK pension funds market size in 2025, and onshore allocations are advancing at a 4.97% CAGR toward 2031.
Note: Market size and forecast figures in this report are generated using Mordor Intelligence’s proprietary estimation framework, updated with the latest available data and insights as of 2026.
Market Trends and Insights
Drivers Impact Analysis of UK Pension Funds Market*
| Driver | (~) % Impact on CAGR Forecast | Geographic Relevance | Impact Timeline |
|---|---|---|---|
| Auto-enrolment expansion & rising minimum contributions | +1.2% | National, concentrated in England and Wales | Medium term (2-4 years) |
| Bulk-annuity buy-out momentum & risk-transfer deals | +0.8% | National, higher activity in private sector schemes | Long term (≥ 4 years) |
| Technology-enabled member engagement & digital advice | +0.4% | National, early adoption in master trusts | Medium term (2-4 years) |
| Shift from DB to DC schemes reshaping asset flows | +0.6% | National, accelerated in private sector | Long term (≥ 4 years) |
| Mansion House reforms channelling assets to productive UK finance | +0.7% | National, with focus on infrastructure and growth assets | Long term (≥ 4 years) |
| Consolidation into “mega-funds” enabling alternative-asset access | +0.5% | National, affecting LGPS and DC schemes | Long term (≥ 4 years) |
| Source: Mordor Intelligence | |||
Auto-enrolment Expansion & Rising Minimum Contributions
Auto-enrolment thresholds remain unchanged for 2025-26, but the steady cadence of re-enrolment every three years keeps participation levels high [1]. The minimum 8% contribution rate, coupled with salary-sacrifice options that blunt higher National Insurance charges, is lifting cash inflows across master trusts. Providers enjoy scale benefits in administration and investment sourcing, which helps them maintain low charging structures even as member numbers rise. The UK pension funds market gains resilience from this predictable contribution stream, enabling longer-dated investments in illiquid assets. Regulatory oversight remains tight, yet it leaves room for design tweaks that sharpen member outcomes.
Bulk-annuity Buy-out Momentum & Risk-transfer Deals
Record funding levels and healthy gilt yields continue to unlock jumbo risk-transfer deals. Legal & General’s GBP 4.8 billion buy-in of the Boots Pension Scheme in June 2024 exemplified the appetite for comprehensive de-risking solutions. Multi-scheme transactions, such as Anglo American’s GBP 785 million package in March 2025, illustrate the search for operational efficiency and pricing certainty. Insurers are expanding underwriting capacity, intensifying competition, and compressing spreads paid by sponsors. Whole-scheme buy-ins now form a larger share of the pipeline, signaling confidence in surplus durability. This wave of activity funnels premium volumes into the UK pension funds market and encourages insurers to broaden risk-pooling strategies.
Technology-enabled Member Engagement & Digital Advice
Artificial-intelligence pilots, dashboard connectivity deadlines, and robo-advice integration are converging in 2025. Smart Pension joined an Innovate UK consortium to test AI-driven personalized nudges that could lift contribution rates and improve retirement adequacy. The Pensions Regulator’s data strategy calls for predictive analytics that safeguard savers while enabling dynamic communications. Pension dashboards will compel schemes to cleanse data and standardize interfaces, fostering industry interoperability. Master trusts exploit these tools to automate lifecycle rebalancing and cut operational overhead. Persistent cybersecurity vigilance remains mandatory to sustain member trust.
Shift from DB to DC Schemes Reshaping Asset Flows
With most private DB plans closed to new accrual, fresh contributions flow predominantly into DC vehicles, changing asset-mix demands. DC portfolios typically tilt toward equities and private market co-investments, contrasting with the liability-matching posture of maturing DB funds. Master trusts amass the scale needed to enter infrastructure and venture-capital arenas once reserved for larger DB peers. The UK pension funds market thus witnesses a redistribution of risk appetites, prompting asset managers to tailor growth-oriented strategies. Hybrid collective DC models are also gaining attention as policymakers explore avenues to improve risk sharing.
Restraints Impact Analysis of UK Pension Funds Market*
| Restraint | (~) % Impact on CAGR Forecast | Geographic Relevance | Impact Timeline |
|---|---|---|---|
| Interest-rate shocks & LDI-driven market-volatility risk | −0.6% | National, concentrated in DB schemes using LDI strategies | Short term (≤ 2 years) |
| Ageing demographics leading to higher benefit outflows than contributions | −0.4% | National, regional demographic variations | Long term (≥ 4 years) |
| DC charge-cap limits hindering private-market allocations | −0.3% | National, affecting DC schemes and master trusts | Medium term (2-4 years) |
| Data-intensive ESG/TCFD reporting cost burden | −0.2% | National, higher impact on smaller schemes | Medium term (2-4 years) |
| Source: Mordor Intelligence | |||
Interest-rate Shocks & LDI-Driven Market-volatility Risk
The January 2025 gilt sell-off pushed 10-year yields near 4.93%, triggering collateral calls for liability-driven investment (LDI) portfolios. Although improved buffers and a Bank of England repo backstop limited forced selling, the episode reminded trustees of liquidity fragilities. Pooled LDI funds still hold material leverage, and sudden rate jumps could require rapid asset sales. The UK pension funds market, therefore, remains exposed to mark-to-market volatility, demanding vigilant monitoring of leverage and liquidity.
Ageing Demographics Leading to Higher Benefit Outflows than Contributions
Pensioner numbers are set to climb 14% between 2025 and 2035, moving from 12.6 million to 14.4 million retirees [2]. Mature DB schemes already experience negative cash flow, forcing sales of liquid assets to cover benefits. A shrinking working-age population narrows the contribution base and weighs on payroll tax receipts, adding pressure on public finances. Long-dated liability profiles restrict investment flexibility and heighten the need for resilient liquidity planning. These demographic forces temper the growth potential of the UK pension funds market.
*Our forecasts treat driver/restraint impacts as directional, not additive. The impact forecasts reflect baseline growth, mix effects, and variable interactions.
UK Pension Funds Market Segment Analysis
By Plan Type:
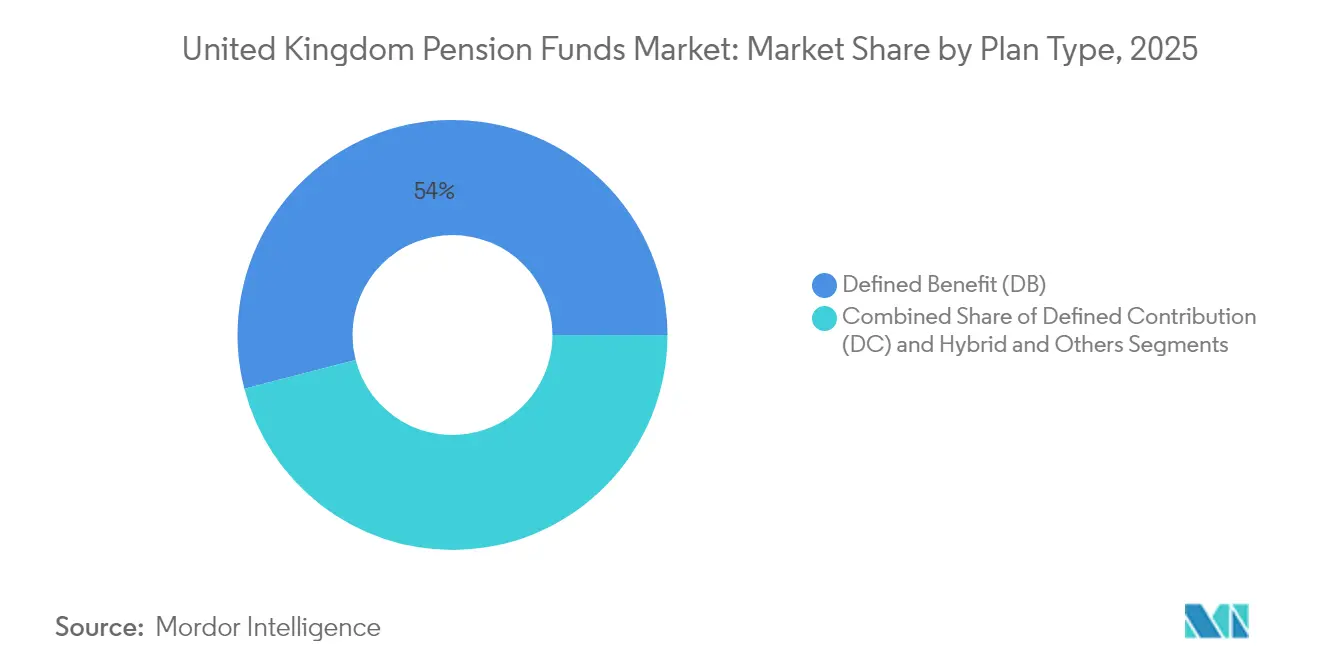
DC Growth Accelerates Despite DB DominanceDefined Benefit plans controlled 54.02% of the UK pension funds market size in 2025, illustrating the historical weight they carry within the UK pension funds market. Many schemes now enjoy near-full funding and are pursuing bulk-annuity solutions to hard-lock liabilities, which gradually shrink the pool yet preserve their sizeable footprint. Large public plans such as Universities Superannuation Scheme recorded GBP 77.9 billion in assets and a 114% funding level during 2024, underscoring the segment’s balance-sheet strength.
Defined Contribution assets, propelled by auto-enrolment and master-trust consolidation, are projected to expand at a 6.92% CAGR to 2031. That trajectory positions DC as the principal growth engine for the UK pension funds market, with collective DC experiments adding further momentum. The Mansion House Accord channels 10% of default DC assets into private markets, potentially enhancing long-term performance and engaging savers through tangible domestic-investment narratives. Hybrid structures provide transitional pathways for sponsors migrating away from DB obligations, yet the dominant flow of new money clearly sits with the DC side.

By Investment Strategy:
Passive Gains Ground in Active-dominated MarketActive management accounted for 63.05% of the UK pension funds market size in 2025, fortified by complex liability hedging and bespoke ESG overlays in DB portfolios. Large schemes still rely on specialist duration and credit managers to navigate macro volatility and stewardship objectives. This preference sustains a robust revenue base for active shops, ensuring a steady pipeline of mandate renewals.
Passive strategies, however, are expected to grow 5.75% annually, driven by fee sensitivity and the regulator’s focus on value metrics. Master trusts often default to index funds to keep charges well below the cap, reinforcing scale benefits as membership balloons. The UK pension funds market size for passive vehicles is likely to swell alongside DC contributions, while active boutiques differentiate through private-market access, transition-aligned benchmarks, and deeper stewardship programmes. Mansion House reforms may revive demand for specialist active skills in illiquid assets where indexing remains impractical.
By Sponsor Type:
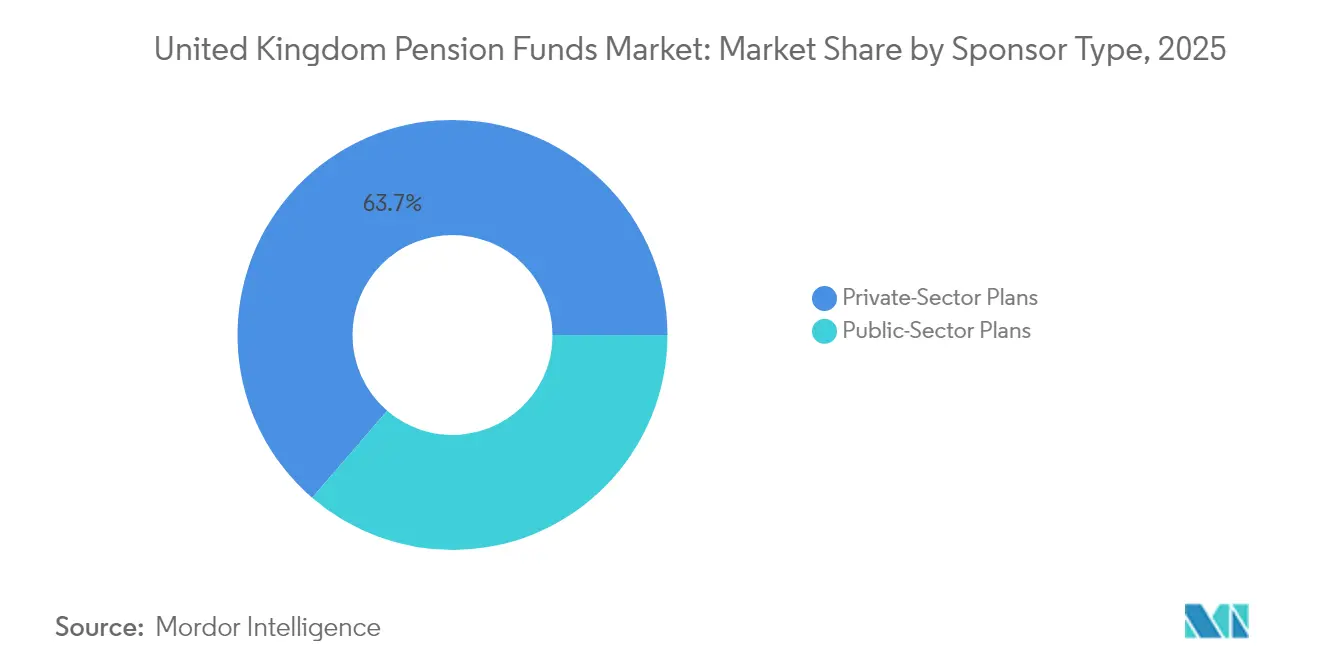
Private Sector Leadership with Public Sector MomentumPrivate-sector schemes accounted for 63.68% of the UK pension funds market size in 2025, reflecting decades of corporate provision and the surge in master-trust enrolments. Corporate sponsors leverage bulk annuity deals to eliminate balance-sheet volatility, freeing capital for core business investment. DC master trusts augment this dominance through targeted technology investment and white-label solutions for smaller employers.
Public-sector assets are projected to expand at a 5.51% CAGR through 2031, supported by Local Government Pension Scheme pooling and revised contribution frameworks. LGPS Central’s stewardship growth to GBP 29.9 billion highlights momentum generated by scale pooling . NHS Pension Scheme changes, including a rise in employer contributions to 23.7%, demonstrate the government's willingness to ensure sustainability. As consolidation gathers pace, public funds gain enhanced access to alternative assets and cost efficiencies, further enriching the UK pension funds market.
By Geography of Investment:
Onshore Momentum Challenges Offshore PreferenceOffshore holdings held 56.54% of the UK pension funds market size in 2025, a legacy of the search for diversification and a prolonged underweight to domestic equities. Many trustees value currency dispersion and exposure to high-growth overseas sectors absent in local indices. However, the Mansion House Accord mandates at least 5% of DC default assets in UK private markets, setting a roadmap for renewed domestic allocation.
Onshore investments are projected to grow at 4.97% CAGR as large players such as Phoenix Group and Schroders commit up to GBP 20 billion to high-growth UK businesses. British Growth Partnership support from Aegon UK further signals the directional shift. Trustees must balance fiduciary duty with policy nudges, ensuring domestic commitments do not compromise return objectives. Successful implementation will diversify capital sources for national infrastructure and scale start-ups, reinforcing the relevance of the UK pension funds market to broader economic strategy.
Geography Analysis
London and the Southeast remain the gravitational centre of pension assets, thanks to the concentration of financial headquarters, asset managers, and administrator hubs. Defined contribution master trusts tend to base decision-making functions in the capital, though member footprints span every region. Northern England and the Midlands rely heavily on Local Government Pension Schemes, whose pooling exercises aim to replicate the risk-adjusted returns achieved by larger sovereign peers.
Regional demographic disparities shape cash-flow profiles. Post-industrial areas with net outflows of younger workers see lower contribution inflows relative to benefit payments, raising liquidity management challenges for local schemes. Government “levelling up” policies nudge pension pools to consider regional infrastructure, housing, and private-equity projects. LGPS Central, for instance, has earmarked GBP 5.2 billion for UK investments, a portion of which targets real-asset projects that stimulate local job creation.
Cross-border considerations have grown since Brexit. The Finance Act 2025 introduced overseas transfer taxes and residency rules for scheme administrators, complicating operations for internationally mobile savers. Simultaneously, European consolidation, such as Allianz’s role in the EUR 3.5 billion Viridium Group transaction, highlights the scale race underway worldwide. The UK pension funds market thus balances domestic integration with global opportunity, ensuring its schemes remain competitive and diversified.
Regulatory Landscape
The UK pension funds market operates under a dual-regulator model, with The Pensions Regulator (TPR) supervising trust-based schemes and the Financial Conduct Authority (FCA) overseeing contract-based workplace pensions. Policy focus has centered on consolidation and member outcomes. The Pension Schemes Act 2026 (enacted 29 April 2026) introduced new requirements around DC value for money (VFM) assessments and set a statutory framework for superfund authorization, reinforcing the shift toward fewer, larger vehicles.
In parallel with consolidation levers, government actions have expanded product design options in decumulation. A regulatory order enabling Nest to offer flexi-access drawdown came into force in May 2026, pointing to continued movement toward default retirement pathways and integrated member journeys, particularly within large master trusts that already dominate DC memberships.
Value Chain Analysis
The UK pension funds value chain starts with employers and members generating contributions (notably through auto-enrolment) and is governed by trustees (for trust-based schemes) or Independent Governance Committees for contract-based arrangements. Scale-focused master trusts, including Nest, Aviva Master Trust, and Legal & General Mastertrust, sit at the center, combining administration, member communications, and default investment design. Consultants (for example Mercer, WTW, and Aon) support scheme selection, governance processes, and manager oversight.
Downstream, investment implementation is delivered through a mix of vertically integrated and outsourced models, spanning fiduciary management, asset management, custody, and specialist mandates (for example private credit/direct lending and LDI in DB). The operating layer is increasingly platform-driven and outsourced to specialist administrators and technology providers to lower unit costs. Emerging policy direction toward default decumulation solutions is also pushing master trusts to extend the chain beyond accumulation into drawdown and retirement support.
Competitive Landscape
The master-trust arena illustrates rising concentration: 84% of DC memberships sit with a handful of authorized providers. Nest, Aviva Master Trust, Legal & General Mastertrust, and The People’s Pension dominate inflows, leveraging technology and ESG frameworks to distinguish value propositions. Selective authorization keeps entry barriers high, prompting smaller trusts either to merge or exit.
Bulk annuity insurers compete intensely for jumbo transactions, with Legal & General strengthening its franchise through overseas partnerships that extend underwriting reach. Scottish Widows, meanwhile, has rolled out an open-architecture LTAF to satisfy private-market appetite from its 4 million workplace savers. Technology disruptors like Smart Pension experiment with AI-driven engagement, compressing administrative costs, and improving member experience.
Scale advantages manifest in fee negotiation, access to co-investments, and risk-pooling capabilities. Yet white-space remains around bespoke ESG integration, mid-market private credit, and post-retirement drawdown solutions. Providers that blend robust governance, competitive charges, and innovative investment design are poised to capture incremental share within the expanding UK pension funds market.
UK Pension Funds Industry Leaders
-
Nest Corporation
-
Aviva Master Trust
-
Legal & General Mastertrust
-
The People’s Pension (B&CE)
-
Scottish Widows Master Trust
- *Disclaimer: Major Players sorted in no particular order
UK Pension Funds Market Companies Covered in this Report
- Universities Superannuation Scheme (USS)
- BT Pension Scheme (BTPS)
- Local Government Pension Scheme (LGPS Pools)
- NatWest Group Pension Fund
- HSBC Bank Pension Scheme
- Greater Manchester Pension Fund (GMPF)
- Barclays Retirement Fund
- Lloyds Bank Pension Scheme
- Electricity Supply Pension Scheme (ESPS)
- Railways Pension Scheme (RPIL)
- BAE Systems Pension Scheme
- Nest Corporation
- Aviva Master Trust
- The People's Pension (B&CE)
- Legal & General Mastertrust
- Scottish Widows Master Trust
- Smart Pension Master Trust
- Brunel Pension Partnership
- Aon MasterTrust
- Standard Life Master Trust
Market Opportunities and Future Outlook
Consolidation policy and governance standards create openings for scaled operating models, data tooling, and default designs that can pass tighter value-for-money scrutiny. The Pension Schemes Act 2026 strengthened the framework around DC VFM assessments and superfund authorization, while government consolidation objectives, including a push toward a smaller set of DC megafunds and minimum scale expectations for defaults, raise demand for integrated administration, institutional-grade investment access, and robust member communications.
Private-markets access inside DC defaults is becoming more tangible through named allocations and product structures rather than concept pilots. Nest formalized a GBP 200 million venture capital sleeve with Schroders Capital in July 2026, with a stated ambition to reach GBP 1 billion by 2030. Scottish Widows launched an open-architecture LTAF in April 2025 to provide exposure to private equity, social housing, and private credit. On the decumulation side, the May 2026 change allowing Nest to offer flexi-access drawdown expands the addressable market for default retirement pathways and post-retirement guidance, supporting product innovation around drawdown, communications, and governance for large master trusts.
Recent Industry Developments in UK Pension Funds Market
- June 2026: Nest published the inaugural report of its Member Assembly, aimed at integrating member feedback into retirement decision-making. This strengthens master-trust member engagement frameworks and member-centric governance, which can shift product design toward improved retirement outcomes within UK pension funds.
- May 2026: Nest awarded a new £450 million Direct Lending Mandate to Crescent Capital. The mandate expands master-trust exposure to private markets, supporting scale and diversification of Nest's investment framework and reinforcing private markets allocation in UK pension funds.
- April 2026: Nest awarded a new Direct Lending Mandate to Crescent Capital for £450 million. This expands master-trust exposure to private markets and strengthens the role of private-market strategies within UK pension funds.
UK Pension Funds Market Report Scope and Research Methodology
Market Definition and Coverage
This market is defined as the total value of assets held and managed within UK pension funds, measured at market value and expressed in USD for consistent year-to-year comparison. It reflects the investable pool linked to pension schemes operating within the UK system.
Scope exclusions: This sizing does not treat pension liabilities, funding deficits, or insurance company balance sheets as market value, and it excludes unfunded public arrangements where assets are not invested in a dedicated fund.
Segments Covered in This Report
- By Plan Type
- Defined Contribution (DC)
- Defined Benefit (DB)
- Hybrid and Others
- By Investment Strategy
- Active
- Passive
- By Sponsor Type
- Public-Sector Plans
- Private-Sector Plans
- By Geography of Investment
- Onshore
- Offshore
Data Sources, Market Sizing, and Validation
Desk Research
Desk research was used to set the market boundary and build clean starting points for asset totals and scheme structure. We relied on public datasets and methods, such as Office for National Statistics releases from the Financial Survey of Pension Schemes, The Pensions Regulator publications on the DB universe, and Bank of England and HM Treasury materials that explain macro drivers and policy direction. Where helpful, guidance and datasets from the Financial Conduct Authority and relevant industry bodies were also reviewed to understand plan design and ongoing consolidation.
To sanity check asset movement, we used supporting items like annual reports, scheme accounts, and investor presentations to understand allocation shifts, de-risking actions, and pooled vehicle usage. Paid subscriptions for company financials and intelligence, news and financials, and patent databases were used in a limited way to confirm reported AUM exposures, corporate actions, and product innovation themes that can affect asset flows. The sources listed here are illustrative and not exhaustive, and many other public and paid references were also used for data collection, validation, and clarification.
Primary Interviews and Surveys
Primary work focused on interviews and structured surveys with pension trustees, investment decision makers, consultants, and operational leaders who manage member servicing and administration. We used these conversations to confirm how AUM is reported (market value versus actuarial bases), how bulk annuity activity and consolidation affect reported assets, and what assumptions are realistic for contributions, benefit outflows, and allocation shifts across the United Kingdom.
Distribution of primary research fieldwork respondents
| Company type | Respondent position |
|---|---|
| Top tier: 31% | CXOs: 12% |
| Mid tier: 55% | Functional/Unit leaders: 35% |
| Smaller Players: 14% | Managers: 53% |
Market-Sizing & Forecasting
Market sizing started with a top-down build where national pension scheme asset series and reported market values were used to reconstruct the total investable pool, then mapped into a consistent USD view using aligned currency timing. We then corroborated results with selective bottom-up approximations, such as sampled scheme AUM disclosures, channel checks on master trust and DB scheme consolidation, and simple AUM movement logic (opening assets plus net contributions plus investment return).
Key inputs in the model included net contribution trends, benefit payout pressure as schemes mature, asset allocation shifts across equities, debt securities, and pooled investment vehicles, and the pace of bulk annuity and de-risking in DB schemes. We also used indicators like scheme consolidation activity and policy signals that can affect the share of assets kept in UK versus overseas markets. For forecasting, scenario analysis was applied around return assumptions, contribution persistence, and de-risking speed, and the chosen path was adjusted using consensus ranges from primary respondents so the forward view remains practical.
Data Validation & Update Cycle
Validation relied on triangulation across independent signals, where model outputs were compared with official asset series, scheme universe snapshots, and observed allocation changes. When a value looked out of line, we checked currency conversion timing, market movement periods, and whether the source reported an actuarial basis versus market value. A second analyst review followed before sign-off.
Reports are refreshed annually, and interim updates are made when material events can shift AUM, such as major policy changes or large consolidation and buyout waves. Before delivery, a final pass is done to catch late published public statistics and to re-contact selected experts if key assumptions move.
Mordor Intelligence's United Kingdom Pension Fund Market Size Compared With Other Published Estimates
Published market sizes for UK pension funds often differ because the underlying data can be reported on different bases, in different currencies, and for different slices of the pension system. Some sources focus mainly on occupational schemes, while others blend in broader retirement assets, which can shift totals even when the direction of change looks similar.
The table shows a noticeable spread that mainly comes from what is counted as pension fund assets, and how the value is converted and timed across the year. In Mordor Intelligence's model, the market is treated as pension fund AUM at market value in USD, and it is kept separate from DB funding level statistics built on technical provisions or buyout bases, which are useful but not the same as an investable asset pool.
Benchmark comparison
| Source | Market Size | Gaps in Research Methodology |
|---|---|---|
| Mordor Intelligence | USD 3.23 T (2025) | |
| Official Statistics Series A | USD 2.60 T (2024) | Uses a funded occupational schemes framework and reports market values in GBP for specific survey dates, which can exclude other pension asset pools and will not line up with a single USD annualized base year. |
| Regulatory Dataset B | USD 1.44 T (2025) | Tracks the defined benefit universe on a technical provisions funding basis, which is designed for funding assessment and not for total pension AUM, so it can understate the broader pension fund asset pool. |
Looking across the three figures, most of the difference can be explained by scope and measurement basis rather than true disagreement on market direction. By keeping the model tied to market value AUM, aligning currency timing, and checking movement logic with practitioner inputs, the estimate stays traceable to repeatable steps that users can follow and test.
Key Questions Answered in the Report
What is the current size of the UK pension funds market?
The market holds USD 3.36 trillion in assets as of 2026 and is forecasted to reach USD 4.09 trillion by 2031.
How fast is the defined contribution segment growing?
Defined Contribution assets are expanding at 6.92% CAGR, the fastest among all plan types.
Why is there a push toward onshore investment?
The Mansion House Accord requires at least 5% of DC default assets to be invested in UK private markets, aiming to channel capital into domestic businesses and infrastructure.
What role do bulk-annuity deals play in the market?
Bulk annuities transfer pension liabilities to insurers, allowing corporate sponsors to remove risk from balance sheets and fueling insurer competition for large transactions.
How is technology changing member engagement?
AI-driven tools, pension dashboards, and robo-advice platforms are improving data clarity, personalizing communications, and reducing administrative costs across schemes.
What are the main risks facing DB schemes?
Interest-rate volatility exposes liability-driven investment strategies to collateral calls, while an ageing demographic pressures cash flow as benefit payments outpace contributions.