Market Overview
| Study Period | 2021 - 2031 |
|---|---|
| Forecast Data Period | 2026 - 2031 |
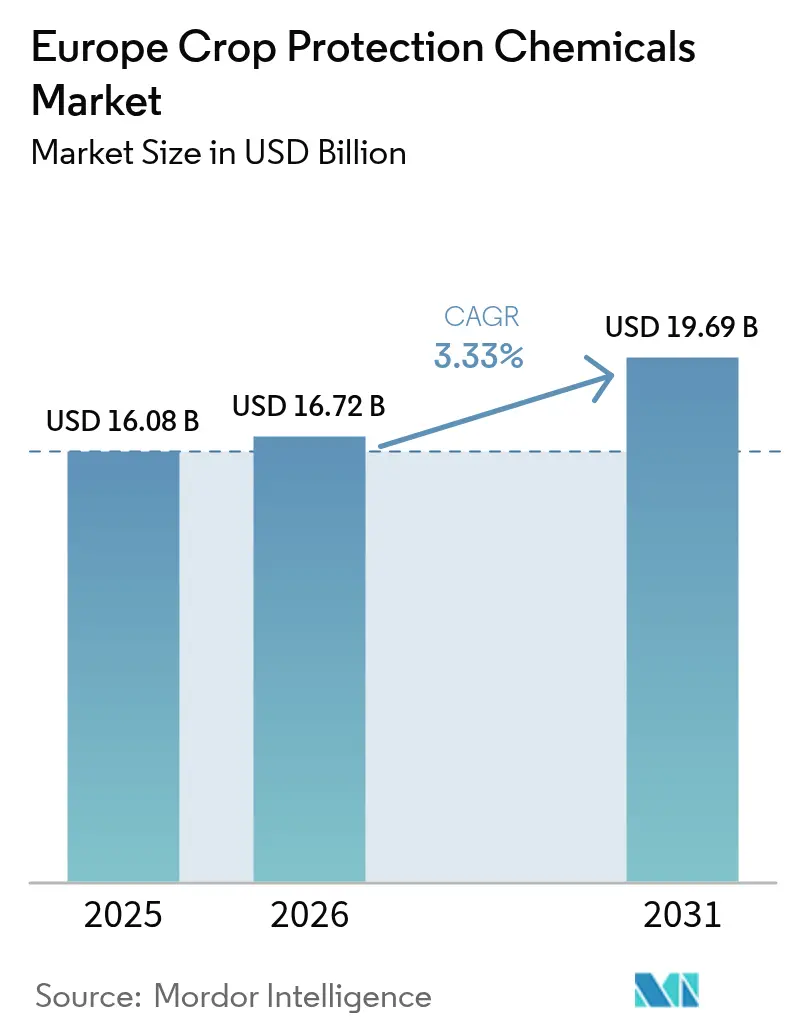
| Base Year Market Size (2025) | USD 16.08 Billion |
| Market Size (2026) | USD 16.72 Billion |
| Market Size (2031) | USD 19.69 Billion |
| Growth Rate (2026 - 2031) | 3.33% CAGR |
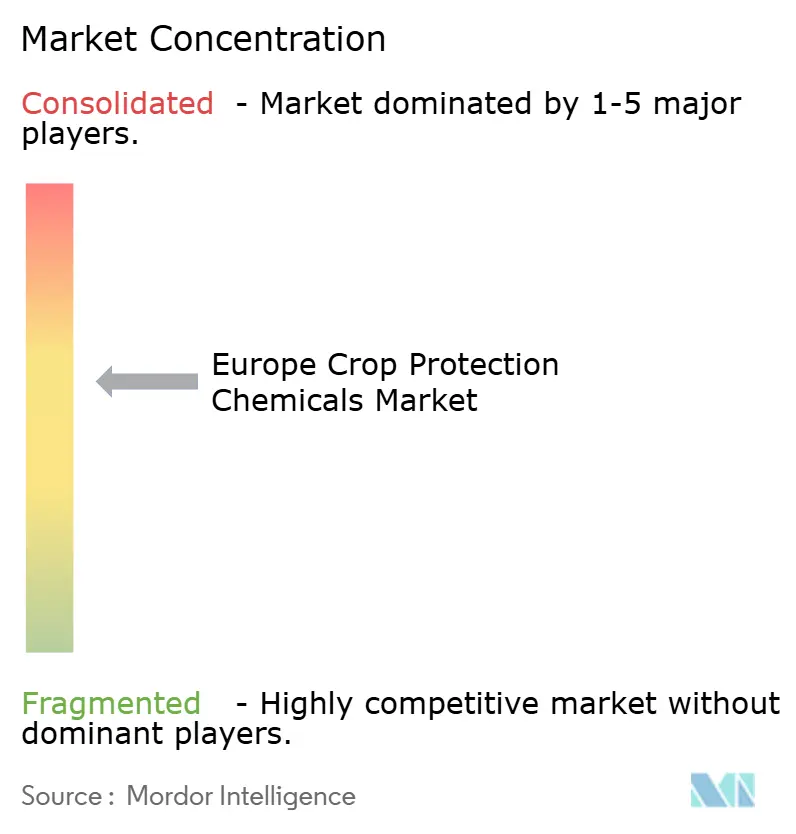
| Market Concentration | Medium |
Major Players *Disclaimer: Major Players sorted in no particular order Image © Mordor Intelligence. Reuse requires attribution under CC BY 4.0. | |
Europe Crop Protection Chemicals Market Analysis by Mordor Intelligence
The Europe crop protection chemicals market size is estimated at USD 16.08 billion in 2025 and is projected to reach USD 16.72 billion in 2026, further expanding to USD 19.69 billion by 2031, registering a CAGR of 3.33% during the forecast period from 2026 to 2031. The European crop protection chemicals market is undergoing significant changes due to the adoption of integrated pest management practices, the introduction of precision spraying technologies, and increasing climate-related pest challenges. Germany remains a key revenue contributor, driven by intensive cereal rotations, while France is advancing rapidly as Common Agricultural Policy eco-schemes promote the use of more selective and lower-residue chemical applications. Herbicides continue to dominate the market for grains and cereals on European arable land. However, molluscicides and seed treatment chemicals are experiencing the fastest growth, driven by warmer winters that prolong slug activity and the adoption of conservation tillage, which increases the risk of soilborne pathogens. Competitive intensity in the market is moderate, with the top five suppliers collectively holding a majority share. Nonetheless, post-patent chemical manufacturers and niche formulators focusing on advanced chemistries are gaining incremental volumes in high-value segments, exerting margin pressure on branded portfolios.
Key Report Takeaways
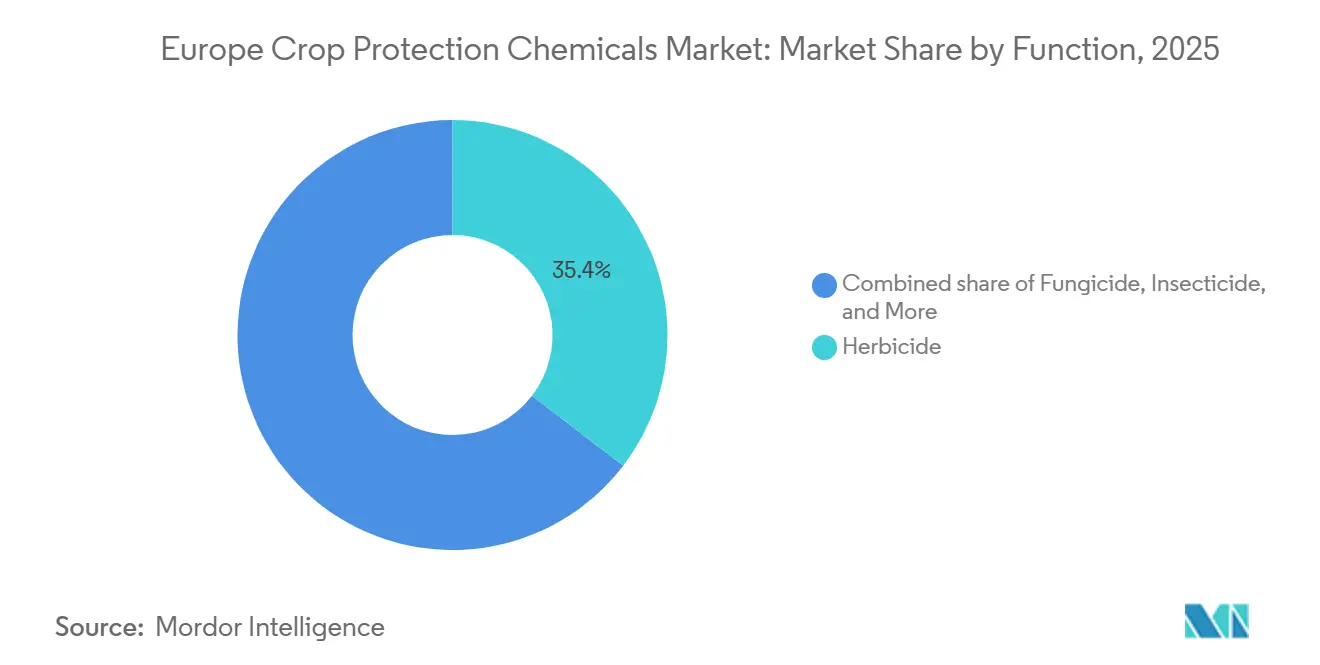
- By function, herbicides led with a 35.4% revenue share of the Europe crop protection chemicals market in 2025, while molluscicides are advancing at a 4.4% CAGR through 2031.
- By application mode, foliar sprays accounted for 47.8% of the Europe crop protection chemicals market size in 2025, whereas seed treatment is the fastest-growing channel, with a 3.5% CAGR.
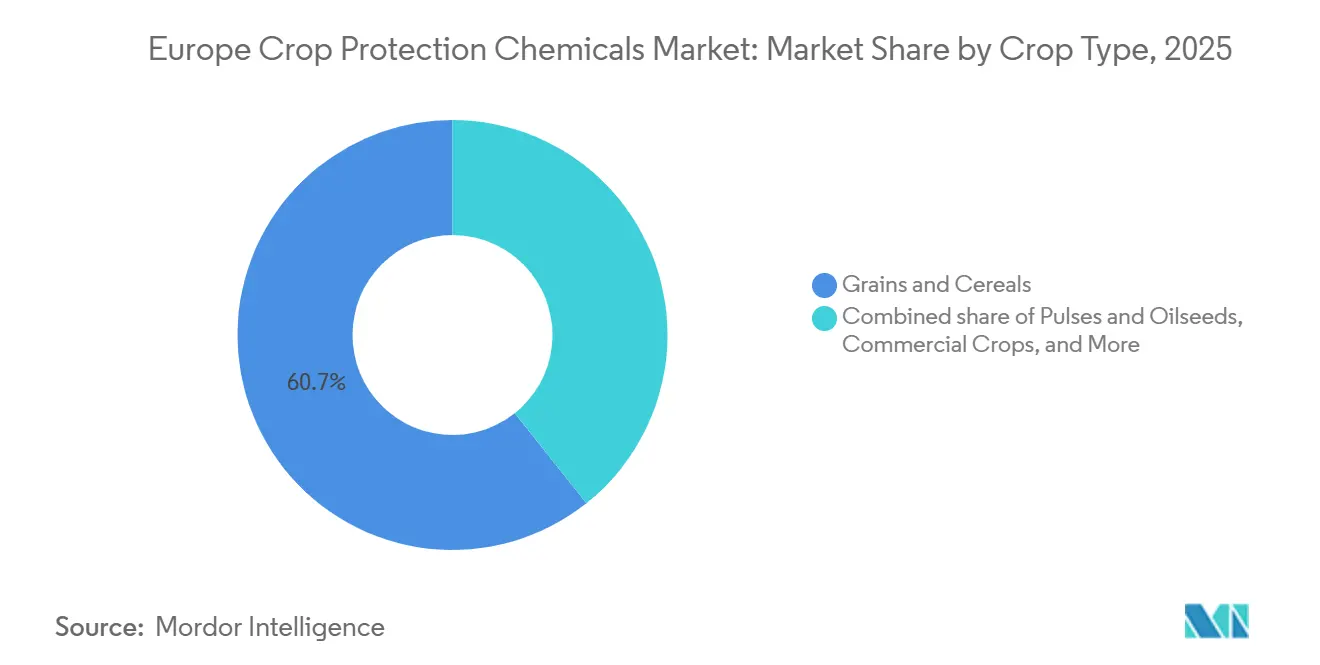
- By crop type, grains and cereals accounted for 60.7% of the Europe crop protection chemicals market share in 2025, but turf and ornamental uses are expanding at a 3.6% CAGR.
- By geography, Germany commanded a 21.4% share of the Europe crop protection chemicals market in 2025, and France is forecast to record the highest national CAGR at 4.8% to 2031.
Note: Market size and forecast figures in this report are generated using Mordor Intelligence’s proprietary estimation framework, updated with the latest available data and insights as of 2026.
Europe Crop Protection Chemicals Market Trends and Insights
Drivers Impact Analysis*
| Driver | (~) % Impact on CAGR Forecast | Geographic Relevance | Impact Timeline |
|---|---|---|---|
| Expanding integrated pest management adoption | +0.8% | France, Germany, the Netherlands, Italy, and Spain | Medium term (2-4 years) |
| Surge in conservation-tillage practices | +0.6% | Germany, Poland, and Ukraine | Medium term (2-4 years) |
| Climate-change-driven pest pressure | +0.5% | France, Germany, and Spain | Long term (≥ 4 years) |
| Artificial Intelligence (AI)-based prescription spraying platforms | +0.4% | Germany, France, the United Kingdom, Poland, and the Czech Republic | Medium term (2-4 years) |
| Rising cereal acreage in Eastern Europe | +0.3% | Ukraine, Poland, and Romania | Short term (≤ 2 years) |
| Drone-enabled aerial spraying approvals | +0.3% | Ukraine, Poland, and Romania | Short term (≤ 2 years) |
| Source: Mordor Intelligence | |||
Expanding Integrated Pest Management (IPM) Adoption
Mandatory Integrated Pest Management (IPM) clauses inside new Common Agricultural Policy eco-schemes are replacing routine calendar spraying with threshold-triggered interventions in the Europe crop protection chemicals market. France requires documented scouting before any broad-spectrum insecticide is applied, shifting 15% to 20% of legacy volume toward narrow-spectrum products[1]Source: French Ministry of Agriculture, “Eco-Schemes 2025,” agriculture.gouv.fr. Germany recorded a double-digit rise in IPM-compliant product registrations during 2025, confirming that formulation pipelines are realigning around the incentive structure. The Netherlands extended IPM mandates to ornamentals, compelling growers to adopt sensor-driven disease models that cut spray counts by roughly one-quarter without yield loss. Italy and Spain are following, with a brief lag, as fragmented advisory networks slow the rollout, yet both markets are on course for material demand swings within two seasons. The driver materially increases demand for selective chemistries and digital decision tools while suppressing broad-spectrum commodity insecticide volume.
Surge in Conservation-Tillage Practices
Low-till and no-till adoption jumped 8% in 2025 as growers chase soil-health incentives and diesel savings across the Europe crop protection chemicals market. In Germany, 3.2 million hectares are managed using conservation tillage. The lack of soil inversion in this method often results in weed seeds remaining in the upper soil layers, requiring residual herbicide application rates 20% to 30% higher for effective control. A similar pattern is observed in Eastern Europe, where Poland and Ukraine have collectively added around 400,000 hectares of no-till farming. This expansion has led to a 6% to 8% increase in regional herbicide demand to manage untilled seedbeds effectively[2]Source: European Conservation Agriculture Federation, “Conservation Agriculture in Europe,” ecaf.org. Mediterranean farms trail because shallow soils dry quickly, limiting the agronomic payoff. Reduced tillage also heightens soil-borne disease risk, spurring broader use of metalaxyl and fludioxonil seed dressings that protect seedlings during slow emergence.
Climate-Change-Driven Pest Pressure
A 1.2 °C rise in average winter temperature between 2020 and 2025 shortened pest diapause and enabled extra generations, a structural tailwind for insecticide sales in the Europe crop protection chemicals market[3]Source: European Environment Agency, “Climate Change Impacts on Agriculture,” eea.europa.eu. France logged three aphid generations in cereals during 2025, up from two historically, driving an unplanned late-season pyrethroid application that lifts per-hectare spend. Germany’s cabbage stem flea beetle is now active four weeks earlier, doubling demand for neonicotinoid alternatives despite partial bans. Olive fruit fly survival in Spain and Italy also increased as milder winters reduced natural mortality, prompting renewed use of organophosphates and spinosad. Extended slug activity through December across northern latitudes is increasing the frequency of molluscicide applications, reinforcing the growth trajectory of ferric phosphate baits.
Rising Cereal Acreage in Eastern Europe
Supported by stable export corridors and drought-resilient crop planning, Ukraine has increased its winter wheat area to 5.2 million hectares for the 2026 harvest, a 9% increase from 2025. Alongside Poland's record 13.4 million-tonne harvest, this development highlights the region's recovery as a key global wheat supplier. Romania is set to lead the European Union (EU) in barley exports for the 2025/26 season, driven by a 150,000-hectare expansion in cultivation. This growth has increased demand for specialized herbicides such as pendimethalin and flufenacet. According to data from the Ministry of Agriculture, this trend highlights a shift toward winter cereals as a climate-resilient alternative to summer crops. Western acreage is maxed out, so Eastern growth remains the only real area lever. Although the driver is price-sensitive and cyclical, strong Middle Eastern grain demand should keep hectares elevated at least through 2027.
Restraints Impact Analysis*
| Restraint | (~) % Impact on CAGR Forecast | Geographic Relevance | Impact Timeline |
|---|---|---|---|
| Fast-track bans on key actives | -0.7% | EU-wide; most aggressive in France, Germany, and Netherlands | Short term (≤ 2 years) |
| Escalating registration costs under Registration, Evaluation, Authorisation and Restriction of Chemicals (REACH) | -0.4% | Germany, France, and Netherlands highest burden | Medium term (2 to 4 years) |
| Growing vegan and organic consumer lobby | -0.3% | The United Kingdom, the Netherlands, and Germany lead | Long term (≥ 4 years) |
| Counterfeit pesticide penetration via gray imports | -0.2% | Poland, Romania, and Bulgaria entry points | Medium term (2 to 4 years) |
| Source: Mordor Intelligence | |||
Fast-Track Bans on Key Actives
After the European Union (EU) mandatory pesticide reduction targets were withdrawn in 2024, the Farm to Fork goals transitioned to focus on incentive-based innovation. The Netherlands' ban on glufosinate, effective January 2026, has disrupted potato desiccation practices, necessitating a shift to mechanical haulm destruction. This transition incurs an additional operational cost of up to EUR 125 (USD 147.7) per hectare, based on benchmarks from the Netherlands Food and Consumer Product Safety Authority (NVWA). In contrast, Southern European regulators provide longer transition periods; however, sustainability mandates driven by supermarkets are accelerating the phase-out by delisting products before legal deadlines. This regulatory shift is compelling global suppliers to accelerate reformulation investments, as the revenue window for new chemistries continues to shrink under the European Union's stringent renewal cycles.
Escalating Registration Costs Under Registration, Evaluation, Authorisation and Restriction of Chemicals (REACH)
Compliance with Registration, Evaluation, Authorisation and Restriction of Chemicals (REACH) demands EUR 8 million to EUR 12 million (USD 8.5 million to USD 12.7 million) per molecule, an outlay that sidelines small and medium enterprises from new active launches. Ecotoxicology studies now account for 60% of dossier costs, as regulators require multi-species, multi-generational data, and France extended review cycles to 36 months on average in 2025. The Netherlands mandates extra pollinator risk work, adding another USD 1.6 million to USD 2.1 million, narrowing viable candidates and lowering the approval count to just three to five new actives per year across Europe. Larger innovators can absorb the burden, but they are prioritizing blockbuster crops, leaving minor uses underserved and exposing growers to the buildup of resistance. The bottleneck slows replacement chemistry for banned actives, compounding the impact of withdrawal policies.
*Our forecasts treat driver/restraint impacts as directional, not additive. The impact forecasts reflect baseline growth, mix effects, and variable interactions.
Segment Analysis
By Function: Herbicide Leadership and Molluscicide Momentum
Herbicides commanded 35.4% of functional revenue in 2025, cementing their position as the largest slice of the Europe crop protection chemicals market. Dependence on grains and cereals keeps glyphosate, pendimethalin, and flufenacet at the core of farm practices, especially in Germany, France, and Poland, where combined use accounts for more than half of regional volume. Molluscicides, though starting from a low base, are the fastest-growing category, with a 4.4% CAGR, as extended wet winters elevate slug pressure across France and the United Kingdom. The widening gap between weed and slug control requirements is compelling formulators to retain herbicide R&D while simultaneously scaling ferric phosphate production to capture emerging molluscicide demand.
Insecticides and fungicides round out the major segments, with fungicides benefiting from rising Septoria and rust incidents in northern cereals. Insecticide demand is waning, as neonicotinoid bans have reduced seed-treatment volumes, though vegetable pyrethroid sprays remain steady. Nematicides represent niche segments but maintain stable value in protected horticulture and potato rotations, where soil-borne pests pose a high economic risk. Regulatory scrutiny is uneven; fungicides and herbicides face the tightest re-approval timelines, elevating reformulation costs, yet they continue to anchor overall spending within the Europe crop protection chemicals market.


By Application Mode: Foliar Dominance and Seed-Treatment Upswing
Foliar sprays delivered 47.8% of 2025 revenue, reflecting the historical reliance on broadcast fungicide and herbicide programs in large-scale cereal and oilseed systems. Germany and France alone accounted for nearly half of the foliar volume, with application peaks around April to June for disease control and September for pre-emergence weed management. Seed treatment is expanding at a 3.5% CAGR through 2031, driven by co-formulated insecticide-coatings that deliver both pest suppression and vigor enhancement under a single registration, creating premium price capture opportunities.
Soil drench and chemigation remain specialized, concentrated in the Netherlands and Italy’s greenhouse sector, where in-line injection cuts labor costs while improving uniformity. Fumigation is shrinking as the methyl bromide phaseout and tightening curbs on 1,3-dichloropropene curtail supply. The Sustainable Use Directive favors closed-system modes such as seed treatment and chemigation, reinforcing growth trajectories. Across all categories, mode selection is increasingly algorithm-driven as Artificial Intelligence (AI) platforms refine timing and dose, embedding digital decision tools deeper into the Europe crop protection chemicals market.
By Crop Type: Broad-Acre Grains Anchor Demand, Specialty Crops Drive Value
Grains and cereals captured 60.7% of the Europe crop protection chemicals market share in 2025, underscoring their role as the primary revenue anchor. This dominance reflects roughly 28 million hectares of wheat, barley, and maize across Germany, France, Poland, and Ukraine, where average application rates approach 2.8 kilograms of active ingredient per hectare despite policy pressure to trim overall use. Turf and ornamental uses start from a far smaller base yet are forecast to expand at a 3.6% CAGR from 2026 to 2031, the fastest clip in the segment mix, as municipalities embrace Global Positioning System (GPS)-guided spot spraying to meet pesticide-free park mandates. United Kingdom local councils alone earmarked GBP 45 million (USD 57 million) in 2025 for equipment retrofits that significantly reduced total herbicide volume while preserving visual standards on public greens.
Pulses and oilseeds sit in a mid-tier position, while intensive spring herbicide programs in French and German rapeseed and sunflower fields secure stand establishment against fast-germinating weeds. Fruits and vegetables command premium pricing because Spain and Italy’s greenhouse tomatoes, peppers, and cucumbers face persistently high disease and insect pressure that drives repeated fungicide and insecticide treatments. Commercial crops such as sugar beet and cotton represent only a small fraction of the Europe crop protection chemicals market size, yet neonicotinoid seed-treatment bans are pushing those growers toward more frequent foliar pyrethroid applications to maintain pest control. For every minor crop, the European Union’s Integrated Pest Management Directive applies crop-specific action plans, and retailer residue standards for high-value horticulture often exceed legal maximums, compelling formulators to keep developing reduced-risk options that satisfy both regulators and buyers.
Geography Analysis
Germany generated 21.4% of 2025 revenue, the highest national share in the Europe crop protection chemicals market. Intensive cereal, oilseed, and sugar beet rotations drive herbicide and fungicide loads averaging 2.6 kilograms of active per hectare, while precision sprayer subsidies are beginning to shift volume from commodity actives to selective formulations with stronger margins. France is the fastest-growing market at a projected 4.8% CAGR to 2031, as eco-scheme payments reward integrated pest management adoption and accelerate demand for premium selective chemistries. The structural shift raises spend per hectare even as total active ingredient volume faces regulatory caps, positioning France for above-region growth despite policy headwinds.
Spain and Italy produce mid-single-digit growth, anchored in greenhouse vegetables, where disease pressure drives higher fungicide intensity. The United Kingdom maintains regulatory alignment with European Union (EU) standards post-Brexit, stabilizing cereal fungicide loads near 1.9 kilograms per hectare. The Netherlands punches above its land weight because greenhouse horticulture consumes 10 to 15 times more energy per hectare than open-field crops, while Ukraine’s rebound depends on the stability of export corridors and infrastructure repairs. Russia remains opaque due to limited data, but acreage growth in southern oblasts likely supports herbicide demand, though sanction-driven supply constraints create unique local dynamics.
Eastern European acreage expansion and Western precision adoption jointly propel the Europe crop protection chemicals market upward. While Germany’s land base is mature, per-hectare spend may climb as Artificial Intelligence (AI)-guided applications favor premium products. France’s organic conversion poses a headwind, yet digital sales gains are anticipated to outpace volume losses. Southern regions will remain fungicide-intensive as greenhouse horticulture expands to meet year-round demand for produce. Regional convergence in regulatory enforcement is scheduled for 2028 to 2029, further harmonizing product portfolios and compliance costs across member states.
Competitive Landscape
The top five suppliers together held a majority share of the Europe crop protection chemicals market in 2025 sales, signaling a moderately concentrated European crop protection chemicals market. Syngenta Group Co., Ltd. and Bayer AG continue to anchor this block by pairing broad synthetic portfolios with in-house digital advisory platforms that lock in grower loyalty. Both firms redirected resources from commodity actives toward precision-ready herbicides and microencapsulated fungicides to defend margins even as price competition intensifies. Their ability to fund costly Registration, Evaluation, Authorisation and Restriction of Chemicals (REACH) dossiers keeps them at the forefront of registration pipelines, preserving scale advantages over smaller rivals.
Outside the top tier, BASF SE, Corteva Inc., and FMC Corporation are reinforcing competitive positions through seed-treatment capacity expansions, controlled-release insecticides, and ultra-low-volume cereal fungicides. Agile post-patent players such as UPL Limited and Nufarm Limited widened their footholds in 2025 by plugging gaps in glufosinate and chlorpyrifos at prices 20% to 30% below branded products, while Albaugh used proprietary adjuvants to turn generic herbicides into premium co-packs for conservation-till systems. Specialty formulators like Kwizda Agro target hillside vineyards with drone-compatible formulations, and Sipcam Oxon markets season-long resistance-rotation packs that bundle multiple modes of action for cereals and oilseeds. Logistics intermediaries such as Helm AG aggregate fragmented Eastern European demand, squeezing dealer margins and expanding the reach of secondary suppliers.
Growth momentum hinges on three levers that cut across corporate tiers. First, digital prescription tools and drone analytics are enabling outcome-based contracts in the United Kingdom wheat and French maize, shifting revenue models from liters sold to control guarantees. Second, emergency-use authorizations created by rapid active-ingredient bans open temporary supply windows that nimble formulators can exploit before incumbents complete full registrations. Third, vertically integrated manufacturers like Zhejiang Wynca Chemical Group Co., Ltd. are leveraging low-cost synthesis to underprice incumbents by up to 25% in glyphosate and pyrethroids, expanding share in budget-sensitive Eastern Europe. Collectively, these strategies suggest that both innovators and fast-moving generics will continue to reshape the competitive balance through 2031.
Europe Crop Protection Chemicals Industry Leaders
Bayer AG
BASF SE
Corteva, Inc.
FMC Corporation
Syngenta Group Co., Ltd.
- *Disclaimer: Major Players sorted in no particular order

Recent Industry Developments
- December 2025: ADAMA and BASF SE entered a strategic co-development and commercialization agreement for Gilboa, ADAMA’s new flumetylsulforim fungicide, aiming for first wheat launches in Great Britain in 2027 and wider European roll-out by 2029.
- March 2025: FMC Corporation and Bayer AG signed an agreement to bring FMC’s Isoflex active Group 13 herbicide to the European Union and Great Britain, targeting resistant grass weeds across 30 million hectares of winter cereals once European Union (EU) registration is secured in 2027.
- January 2025: Corteva Agriscience unveiled Broadway Ultra, a post-emergence herbicide that combines two leading grass-weed actives for enhanced control of annual meadow grass, ryegrass and brome in United Kingdom cereal rotations.


Europe Crop Protection Chemicals Market Report Scope
Crop protection chemicals are chemical substances used in agriculture to prevent, control, or eliminate pests, diseases, weeds, and other organisms that can damage crops and reduce yields. They include herbicides for weed control, insecticides for insect management, fungicides for disease prevention, and other specialized formulations designed to safeguard crop health, improve productivity, and ensure consistent agricultural output.
The Europe Crop Protection Chemicals Market Report provides a comprehensive analysis of the market across key functions such as fungicides, insecticides, herbicides, nematicides, and molluscicides. It further examines the market by application mode, covering foliar spraying, seed treatment, soil treatment, chemigation, and fumigation, and by crop type, including grains and cereals, pulses and oilseeds, fruits and vegetables, commercial crops, and turf and ornamental crops. Geographically, the report evaluates trends across Germany, France, Spain, Russia, Italy, the United Kingdom, the Netherlands, Ukraine, and the Rest of Europe. Market forecasts are presented in terms of value in USD and volume in metric tons.
By Function
| Fungicide |
| Insecticide |
| Herbicide |
| Nematicide |
| Molluscicide |
By Application Mode
| Foliar |
| Seed Treatment |
| Soil Treatment |
| Chemigation |
| Fumigation |
By Crop Type
| Grains and Cereals |
| Pulses and Oilseeds |
| Fruits and Vegetables |
| Commercial Crops |
| Turf and Ornamental |
By Region
| Germany |
| France |
| Spain |
| Russia |
| Italy |
| United Kingdom |
| Netherlands |
| Ukraine |
| Rest of Europe |
| By Function | Fungicide |
| Insecticide | |
| Herbicide | |
| Nematicide | |
| Molluscicide | |
| By Application Mode | Foliar |
| Seed Treatment | |
| Soil Treatment | |
| Chemigation | |
| Fumigation | |
| By Crop Type | Grains and Cereals |
| Pulses and Oilseeds | |
| Fruits and Vegetables | |
| Commercial Crops | |
| Turf and Ornamental | |
| By Region | Germany |
| France | |
| Spain | |
| Russia | |
| Italy | |
| United Kingdom | |
| Netherlands | |
| Ukraine | |
| Rest of Europe |


Market Definition
- Function - Crop Protection Chemicals are apllied to control or prevent pests, including insects, fungi, weeds, nematodes, and mollusks, from damaging the crop and to protect the crop yield.
- Application Mode - Foliar, Seed Treatment, Soil Treatment, Chemigation, and Fumigation are the different type of application modes through which crop protection chemicals are applied to the crops.
- Crop Type - This represents the consumption of crop protection chemicals by Cereals, Pulses, Oilseeds, Fruits, Vegetables, Turf, and Ornamental crops.
| Keyword | Definition |
|---|---|
| IWM | Integrated weed management (IWM) is an approach to incorporate multiple weed control techniques throughout the growing season to give producers the best opportunity to control problematic weeds. |
| Host | Hosts are the plants that form relationships with beneficial microorganisms and help them colonize. |
| Pathogen | A disease-causing organism. |
| Herbigation | Herbigation is an effective method of applying herbicides through irrigation systems. |
| Maximum residue levels (MRL) | Maximum Residue Limit (MRL) is the maximum allowed limit of pesticide residue in food or feed obtained from plants and animals. |
| IoT | The Internet of Things (IoT) is a network of interconnected devices that connect and exchange data with other IoT devices and the cloud. |
| Herbicide-tolerant varieties (HTVs) | Herbicide-tolerant varieties are plant species that have been genetically engineered to be resistant to herbicides used on crops. |
| Chemigation | Chemigation is a method of applying pesticides to crops through an irrigation system. |
| Crop Protection | Crop protection is a method of protecting crop yields from different pests, including insects, weeds, plant diseases, and others that cause damage to agricultural crops. |
| Seed Treatment | Seed treatment helps to disinfect seeds or seedlings from seed-borne or soil-borne pests. Crop protection chemicals, such as fungicides, insecticides, or nematicides, are commonly used for seed treatment. |
| Fumigation | Fumigation is the application of crop protection chemicals in gaseous form to control pests. |
| Bait | A bait is a food or other material used to lure a pest and kill it through various methods, including poisoning. |
| Contact Fungicide | Contact pesticides prevent crop contamination and combat fungal pathogens. They act on pests (fungi) only when they come in contact with the pests. |
| Systemic Fungicide | A systemic fungicide is a compound taken up by a plant and then translocated within the plant, thus protecting the plant from attack by pathogens. |
| Mass Drug Administration (MDA) | Mass drug administration is the strategy to control or eliminate many neglected tropical diseases. |
| Mollusks | Mollusks are pests that feed on crops, causing crop damage and yield loss. Mollusks include octopi, squid, snails, and slugs. |
| Pre-emergence Herbicide | Preemergence herbicides are a form of chemical weed control that prevents germinated weed seedlings from becoming established. |
| Post-emergence Herbicide | Postemergence herbicides are applied to the agricultural field to control weeds after emergence (germination) of seeds or seedlings. |
| Active Ingredients | Active ingredients are the chemicals in pesticide products that kill, control, or repel pests. |
| United States Department of Agriculture (USDA) | The Department of Agriculture provides leadership on food, agriculture, natural resources, and related issues. |
| Weed Science Society of America (WSSA) | The WSSA, a non-profit professional society, promotes research, education, and extension outreach activities related to weeds. |
| Suspension concentrate | Suspension concentrate (SC) is one of the formulations of crop protection chemicals with solid active ingredients dispersed in water. |
| Wettable powder | A wettable powder (WP) is a powder formulation that forms a suspension when mixed with water prior to spraying. |
| Emulsifiable concentrate | Emulsifiable concentrate (EC) is a concentrated liquid formulation of pesticide that needs to be diluted with water to create a spray solution. |
| Plant-parasitic nematodes | Parasitic Nematodes feed on the roots of crops, causing damage to the roots. These damages allow for easy plant infestation by soil-borne pathogens, which results in crop or yield loss. |
| Australian Weeds Strategy (AWS) | The Australian Weeds Strategy, owned by the Environment and Invasives Committee, provides national guidance on weed management. |
| Weed Science Society of Japan (WSSJ) | WSSJ aims to contribute to the prevention of weed damage and the utilization of weed value by providing the chance for research presentation and information exchange. |


Research Methodology
Mordor Intelligence follows a four-step methodology in all our reports.
- Step-1: Identify Key Variables: In order to build a robust forecasting methodology, the variables and factors identified in Step-1 are tested against available historical market numbers. Through an iterative process, the variables required for market forecast are set and the model is built on the basis of these variables.
- Step-2: Build a Market Model: Market-size estimations for the forecast years are in nominal terms. Inflation is not a part of the pricing, and the average selling price (ASP) is kept constant throughout the forecast period.
- Step-3: Validate and Finalize: In this important step, all market numbers, variables and analyst calls are validated through an extensive network of primary research experts from the market studied. The respondents are selected across levels and functions to generate a holistic picture of the market studied.
- Step-4: Research Outputs: Syndicated Reports, Custom Consulting Assignments, Databases & Subscription Platforms


