Market Overview
| Study Period | 2020 - 2031 |
|---|---|
| Forecast Data Period | 2026 - 2031 |
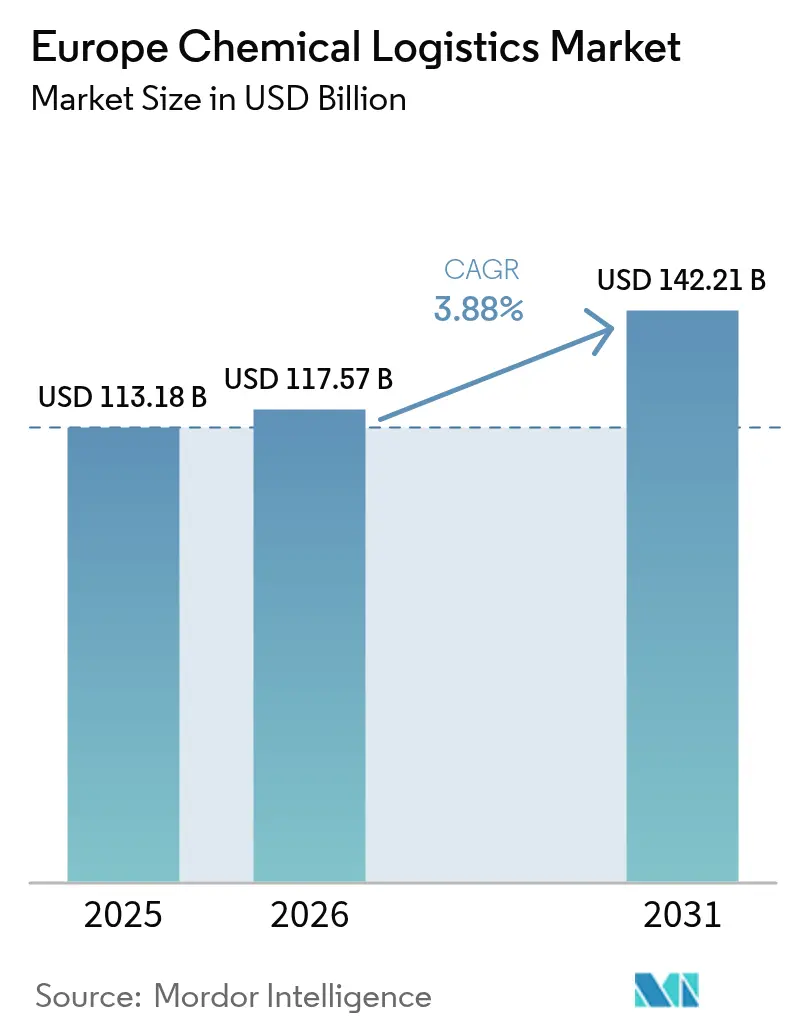
| Base Year Market Size (2025) | USD 113.18 Billion |
| Market Size (2026) | USD 117.57 Billion |
| Market Size (2031) | USD 142.21 Billion |
| Growth Rate (2026 - 2031) | 3.88% CAGR |
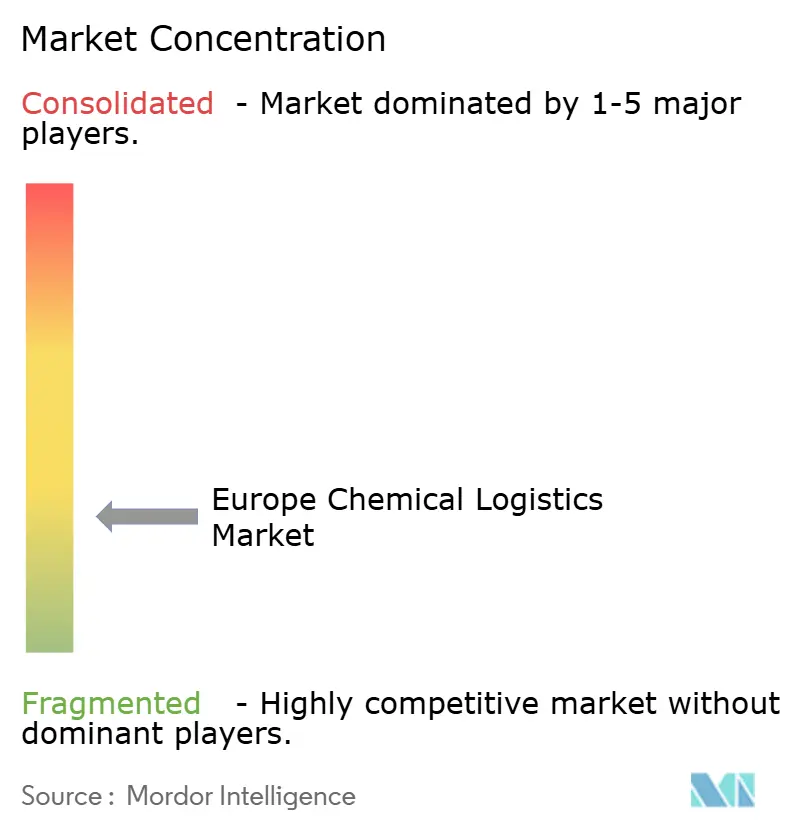
| Market Concentration | Low |
Major Players *Disclaimer: Major Players sorted in no particular order Image © Mordor Intelligence. Reuse requires attribution under CC BY 4.0. | |
Europe Chemical Logistics Market Analysis by Mordor Intelligence
The Europe chemical logistics market size was valued at USD 113.18 billion in 2025 and estimated to grow from USD 117.57 billion in 2026 to reach USD 142.21 billion by 2031, at a CAGR of 3.88% during the forecast period (2026-2031). Steady expansion stems from resilient chemical production clusters, continued government rail-freight incentives, and growing demand for temperature-controlled services that support green-chemistry and biologics production. Companies optimize cross-border routes to align with REPowerEU energy diversification mandates while strengthening hub-and-spoke networks around specialty manufacturing centers. Digital freight-matching platforms enhance asset utilization for hazardous cargo, and mergers among leading third-party logistics (3PL) providers accelerate network density. However, cost inflation from CO₂-indexed tolls and a shortage of ADR-certified drivers tighten capacity, making regulatory compliance and technology adoption critical for competitive positioning across the Europe chemical logistics market.
Key Report Takeaways
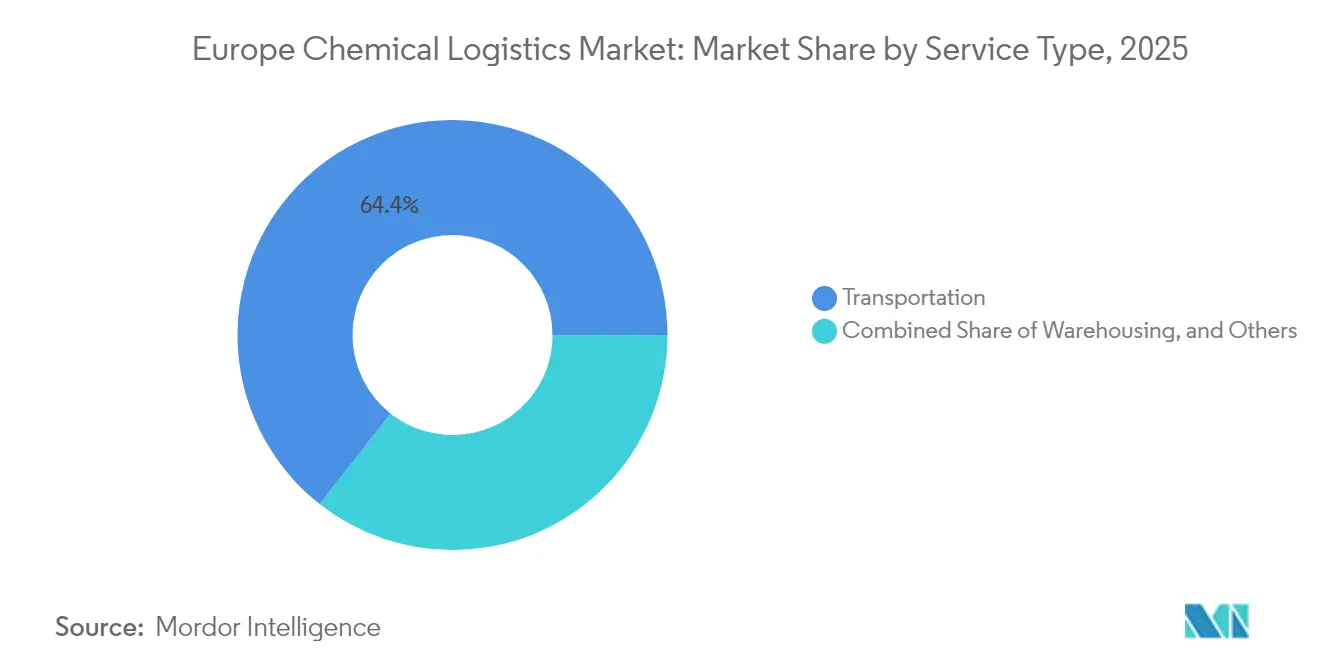
- By service, transportation commanded 64.40% of Europe chemical logistics market share in 2025, while value-added services are expected to record the fastest 3.56% CAGR through 2031.
- By end-user industry, oil & gas held 25.60% of the Europe chemical logistics market size in 2025; specialty chemicals is set to grow quickest at 3.73% CAGR to 2031.
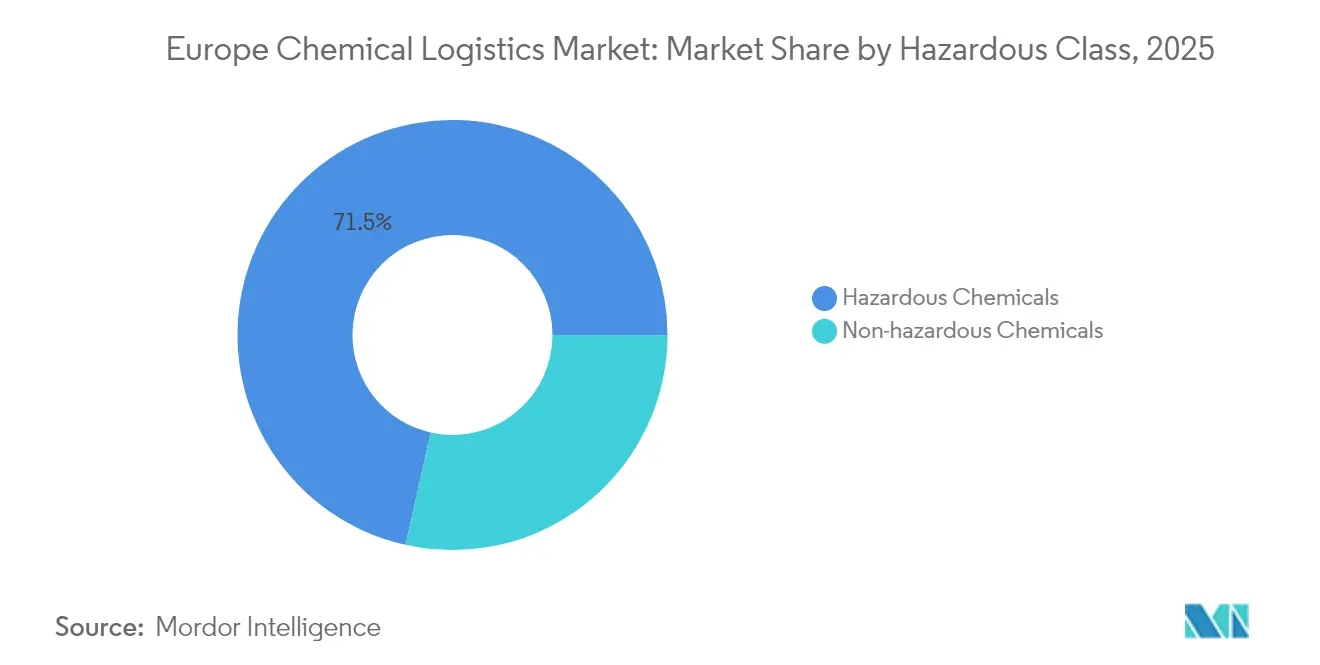
- By hazard class, hazardous chemicals accounted for a dominant 71.50% share of the Europe chemical logistics market in 2025 and should expand at a 4.05% CAGR through 2031.
- By temperature control, temperature-controlled logistics is forecast to post the highest 4.32% CAGR between 2026-2031, although non-temperature-controlled services retained a 59.40% revenue share in 2025.
- By geography, Germany led with 16.80% revenue share in 2025, whereas Poland is projected to register the fastest 4.08% CAGR over the forecast period.
Note: Market size and forecast figures in this report are generated using Mordor Intelligence’s proprietary estimation framework, updated with the latest available data and insights as of 2026.
Europe Chemical Logistics Market Trends and Insights
Drivers Impact Analysis*
| Driver | (~) % Impact on CAGR Forecast | Geographic Relevance | Impact Timeline |
|---|---|---|---|
| Green-chemicals demand clustering | +0.8% | Germany, Netherlands, France | Medium term (2-4 years) |
| REPowerEU bulk chemicals re-routing | +0.9% | Pan-European, strongest in Germany & Netherlands | Short term (≤ 2 years) |
| On-site rail siding subsidies | +0.5% | Germany, Netherlands | Long term (≥ 4 years) |
| Expansion of ADR-compliant ISO-tank pools | +0.6% | Industrial clusters across Europe | Medium term (2-4 years) |
| M&A-driven 3PL network densification | +0.7% | DACH region and wider Europe | Medium term (2-4 years) |
| Digital freight-matching for hazardous cargo | +0.4% | Early adoption in Germany & Netherlands | Long term (≥ 4 years) |
| Source: Mordor Intelligence | |||
Green-chemicals demand concentrating loads closer to specialty hubs
Manufacturers dedicated to sustainable chemistry are relocating production near established clusters, shortening delivery distances yet heightening requirements for temperature-controlled and ADR-compliant infrastructure. ICIG’s integration of Valtris Advanced Organics sites into its Vynova platform illustrates how vertical integration inside chemical parks boosts load density and necessitates specialized warehouses with continuous environmental monitoring. Logistics providers offering validated cold-chain capability and leak-proof ISO-tank fleets capture premium rates because pharmaceutical and cosmetic intermediates demand strict handling protocols.
REPowerEU accelerating intra-Europe bulk chemicals re-routing
The EU policy to reduce dependence on Russian feedstocks has redirected bulk chemical flows toward western ports and inland multimodal hubs. Germany’s extension of EUR 229 million (USD 252.73 million) in track-access subsidies until 2028 strengthens rail viability, cutting end-to-end costs up to 20% compared with long-haul trucking. Agile 3PLs able to harmonize customs, safety, and sustainability compliance across several member states secure new contracts as manufacturers renegotiate supply lines[1]“CO2-Based Road Charging Implementation,” Transport & Environment, transportenvironment.org.
On-site rail siding subsidies in Germany and Netherlands
Grants for factory rail sidings lower handling costs and curb carbon emissions. Chemie-based industrial parks that invest in private tracks report 2-3-day reductions in order-to-delivery cycles while channeling bulk volumes away from congested highways. The resulting modal shift amplifies the competitive edge of providers operating block-train services and certified tank-wagon cleaning stations, reinforcing the Europe chemical logistics market’s rail segment[2]“Track Access Charge Subsidies Extended Until 2028,” Federal Ministry for Digital and Transport, bmdv.bund.de.
Expansion of ADR-compliant ISO-tank leasing pools
Leasing specialists such as Trifleet and Eurotainer expand their European fleets, freeing shippers from heavy upfront purchases. Standardized designs simplify cleaning, certification, and sensor retrofits, boosting fleet utilization while ensuring regulatory conformity. Wider availability of swap-body ISO-tanks offers flexibility for seasonal demand spikes and for new bio-based formulations, accelerating supply-chain responsiveness in the Europe chemical logistics industry.
Restraints Impact Analysis*
| Restraint | (~) % Impact on CAGR Forecast | Geographic Relevance | Impact Timeline |
|---|---|---|---|
| Shortage of ADR-certified truck drivers | -0.7% | Germany & United Kingdom | Short term (≤ 2 years) |
| Stricter CO₂ corridor tolls on German Autobahn | -0.5% | Germany, spillover to Netherlands & Austria | Medium term (2-4 years) |
| Limited rail path capacity | -0.4% | Germany, Netherlands, France | Long term (≥ 4 years) |
| Inflation-led surge in specialty packaging | -0.6% | Pan-European, acute in pharmaceutical cold chain | Short term (≤ 2 years) |
| Source: Mordor Intelligence | |||
Shortage of ADR-certified truck drivers
Training fees ranging from GBP 600-1,700 pose an entry barrier, while retirements outpace new license issuances. The Europe chemical logistics market therefore experiences lane imbalances and spot-rate surges on short notice. Providers counteract with in-house academies, pay premiums, and tighter route planning, yet capacity gaps persist, particularly for high consequence dangerous goods[3]“ADR Training Costs and Requirements,” ADR Training, adr-training.co.uk.
Stricter CO₂ corridor tolls on German Autobahn
Germany introduced carbon-indexed charges that raise per-kilometer costs for Euro VI diesel units by up to 15%, directly impacting hazardous cargo fleets whose powertrain conversion options remain limited. Route diversification toward rail, inland waterways, and intermodal solutions mitigates the burden but requires capital-intensive network re-engineering.
*Our forecasts treat driver/restraint impacts as directional, not additive. The impact forecasts reflect baseline growth, mix effects, and variable interactions.
Segment Analysis
By Service: Transportation dominance drives consolidation
Transportation retained 64.40% revenue in 2025 as specialized tank-truck, rail-tank-wagon, and ISO-container moves remain the backbone of the Europe chemical logistics market. The segment secures economies of scale via network densification projects such as DSV’s pending takeover of DB Schenker. Meanwhile, the Europe chemical logistics market size for value-added services is forecast to expand at 3.56% CAGR, reflecting an uptick in labeling, repacking, and quality inspection tasks embedded into multi-client chemical distribution centers.
Within transportation, road carries time-critical or hazardous parcels, whereas rail gains share on long corridors backed by government incentives. Digital platforms matching ADR-compliant capacity with backhaul loads curb empty runs, improving margins even as toll surcharges escalate. Airfreight and short-sea solutions address niche, high-value payloads where transit time or bulk discounts outweigh cost premiums.
Value-added offerings increasingly include regulatory documentation, safety data management, and sustainability reporting, enabling shippers to outsource compliance complexity. As environmental, social, and governance (ESG) disclosure becomes mandatory, 3PLs embed CO₂ dashboards into portals, translating logistics performance into actionable emissions data. Growing demand for site logistics, blending, and sample testing further blurs the line between contract manufacturing and third-party logistics, elevating service sophistication across the Europe chemical logistics industry.


By End-User Industry: Oil and gas leadership faces specialty growth
Oil & gas accounted for 25.60% of 2025 revenue, underpinned by established petrochemical feedstock flows. However, specialty chemical demand from pharmaceuticals and cosmetics is projected to grow at 3.73% CAGR, outpacing bulk segments. The Europe chemical logistics market size for pharmaceutical distribution benefits from new biologics sites that mandate GDP-certified cold-chain solutions, like UPS Healthcare’s enlarged Dublin campus.
Cosmetics logistics now mirrors drug-grade conditions, emphasizing temperature consistency, allergen segregation, and batch traceability. Green-chemistry initiatives intensify urgency for controlled environments. Petrochemical shippers, in contrast, confront price volatility and energy transition headwinds, prompting efficiency projects such as rail-siding retrofits and barge connectivity at refinery complexes. Agricultural chemicals and industrial gases remain steady contributors, though they require diverse packaging from IBCs to cylinder bundles stretching 3PL capability sets in the Europe chemical logistics market.
By Hazard Class: Hazardous chemicals drive premium services
Hazardous cargo represented 71.50% revenue in 2025, commanding premium freight rates and specialized equipment deployment. Europe chemical logistics market share for hazardous materials benefits from regulatory barriers that limit competition to certified operators. Providers manage continuous driver training, periodic vehicle inspections, and insurance extensions, reinforcing market entry hurdles.
The Europe chemical logistics industry leverages advanced telematics, pressure sensors, and geofencing to comply with ADR and Seveso directives. Non-hazardous flows, although sizable, see commoditization as general freight carriers encroach; thus margins stay lower. The hazardous segment’s forecast 4.05% CAGR through 2031 is sustained by growth in lithium-ion battery precursors, bio-solvents, and high-purity reagents each necessitating meticulous segregation and documentation.
By Temperature Control: Cold chain expansion drives growth
Temperature-controlled freight is projected to rise at 4.32% CAGR, faster than the broader Europe chemical logistics market, fueled by biologics, vaccines, and heat-sensitive additives. Operators retrofit trailers with electric refrigeration units and remote monitoring to align with EU green-transport legislation. Demo projects like Frigo Logistics’ battery-electric reefer trucks in Poland illustrate early viability.
Non-temperature-controlled moves still represent the bulk of volumes thanks to commodity resins and inorganic minerals. Yet, shippers increasingly request validated temperature mapping even for ambient cargo to ensure product integrity across unpredictable climates, nudging incumbent carriers toward technology upgrades.
Geography Analysis
Germany captured 16.80% of 2025 revenue owing to its EUR 200 billion (USD 220.72 billion) chemical output and network of ADR-compliant depots. Federal rail-charge subsidies and public-private investment bolster corridor capacity and support the Europe chemical logistics market. Nevertheless, CO₂-indexed tolls raise trucking expenditure, spurring modal diversification. Mature clusters in Ludwigshafen, Leverkusen, and the Rhine-Ruhr rely on synchronized barge-rail-road synergies, fostering demand for 4PL orchestration services.
Poland emerges as the fastest-growing arena at 4.08% CAGR, supported by warehouse stock surpassing 35 million m² and investor appetite for modern Class-A parks that comply with chemical storage norms. Freight corridors linking Silesia to Baltic ports enable east-west transit, while lower labor costs sharpen competitiveness. International 3PLs scale footprints DB Schenker’s Rawicz site grew to 27,000 m² in May 2025 to support optical and specialty chemical clients.
The Netherlands, France, and the United Kingdom maintain sophisticated multimodal gateways. Rotterdam’s liquid bulk terminals and pipeline grid anchor trans-Atlantic feedstock. Calais Channel crossings facilitate time-critical UK chemicals, though post-Brexit customs workflows compel investment in digital declarations. Southern Europe (Italy, Spain) leverages Mediterranean routes for agrochemical and resin trades, aided by rising renewable-chemicals initiatives. Nordic nations focus on green hydrogen derivatives and advanced materials, commanding premium freight due to remote geography and stringent safety requirements.
Competitive Landscape
Europe chemical logistics market competition remains moderate. DSV’s planned acquisition of DB Schenker is poised to reshape rankings by combining extensive European overland networks and deep chemical know-how. Logwin’s July 2025 purchase of Hanse Service Group added GDP-certified cold-chain capacity, signaling targeted consolidation toward high-margin niches.
Technology investments differentiate market leaders: XPO Logistics embeds AI route planning and CO₂ dashboards to meet shipper sustainability targets. Smaller regional specialists survive through unique expertise, such as bulk rail siding management or integrated site logistics at chemical parks.
Integrated platforms offering end-to-end visibility, regulatory documentation, and emissions reporting command premium contracts. Fleet modernization toward alternative fuels remains gradual due to technical constraints on hazardous goods carriage, yet early movers secure green-contract tenders from sustainability-focused producers.
Europe Chemical Logistics Industry Leaders
DHL
DSV A/S
CEVA Logistics
XPO Logistics
Kuehne + Nagel
- *Disclaimer: Major Players sorted in no particular order

Recent Industry Developments
- July 2025: Logwin AG acquired Hanse Service Internationale Fachspedition GmbH and Pharmalogisticspartner Internationale Fachspedition GmbH, adding 7,600 m² temperature-controlled space and GDP, wholesaler, and IFS certifications.
- May 2025: Wincanton, a leading supply chain partner for UK business, and Tata Chemicals Europe DB Schenker expanded its lease at Hillwood Rawicz center in Poland by 9,800 m², underscoring Poland’s logistics boom.
- April 2025: Rohlig Suus Logistics relocated its Lublin branch, boosting capacity 30% with a new cross-dock terminal.
- March 2025: ID Logistics Germany announced a 68,000 m² e-fulfillment hub in Diemelstadt, featuring a 4.8 MWp solar array.


Europe Chemical Logistics Market Report Scope
Chemical logistics refers to the shipment of bulk chemical products through a diverse range of equipment. These equipment are manufactured to maximize the variety of products transported through multimodal means.
The European chemical logistics market report provides insights into the market, like market overview, market dynamics, value chain/supply chain analysis, technological trends, investment scenarios, government regulations and initiatives, and insights into the 3PL market in Europe (market size and forecast). It also covers the impact of the COVID-19 pandemic on the chemical logistics market, and industry attractiveness, as determined by Porter's Five Forces Analysis.
The Europe Chemical Logistics Market is segmented by service (transportation, warehousing, distribution, inventory management, and other value-added services), mode of transportation (road, rail, sea, and pipeline), end user (pharmaceutical industry, cosmetics industry, oil and gas industry, specialty chemicals industry, and other end users (like coating industry)), and geography (Germany, United Kingdom, Netherlands, France, Italy, Spain, Poland, Belgium, Sweden, and Rest of Europe). The report offers market sizes and forecasts in value (USD) for all the above segments.
By Service (Value, USD Million)
| Transportation | Road |
| Rail | |
| Air | |
| Sea | |
| Warehousing, Distribution and Inventory Management | |
| Other Services |
By End-User Industry (Value, USD Million)
| Pharmaceutical |
| Cosmetic |
| Oil and Gas |
| Specialty Chemicals |
| Other End-Users |
By Hazard Class (Value, USD Million)
| Hazardous Chemicals |
| Non-hazardous Chemicals |
By Temperature Control (Value, USD Million)
| Temperature-Controlled (Refrigerated/Heated) |
| Non-Temperature-Controlled |
By Geography (Value, USD Million)
| Germany |
| United Kingdom |
| Netherlands |
| France |
| Italy |
| Spain |
| Poland |
| BENELUX (Belgium, Netherlands, and Luxembourg) |
| NORDICS (Denmark, Finland, Iceland, Norway, and Sweden) |
| Rest of Europe |
| By Service (Value, USD Million) | Transportation | Road |
| Rail | ||
| Air | ||
| Sea | ||
| Warehousing, Distribution and Inventory Management | ||
| Other Services | ||
| By End-User Industry (Value, USD Million) | Pharmaceutical | |
| Cosmetic | ||
| Oil and Gas | ||
| Specialty Chemicals | ||
| Other End-Users | ||
| By Hazard Class (Value, USD Million) | Hazardous Chemicals | |
| Non-hazardous Chemicals | ||
| By Temperature Control (Value, USD Million) | Temperature-Controlled (Refrigerated/Heated) | |
| Non-Temperature-Controlled | ||
| By Geography (Value, USD Million) | Germany | |
| United Kingdom | ||
| Netherlands | ||
| France | ||
| Italy | ||
| Spain | ||
| Poland | ||
| BENELUX (Belgium, Netherlands, and Luxembourg) | ||
| NORDICS (Denmark, Finland, Iceland, Norway, and Sweden) | ||
| Rest of Europe |


Key Questions Answered in the Report
How large will chemical logistics revenues in Europe reach by 2031?
The market is projected to grow to USD 142.21 billion by 2031 on a 3.88% CAGR.
Which service category leads chemical logistics spending in Europe?
Transportation services dominate with a 64.40% share due to specialized tank-truck, rail-tank, and ISO-container moves.
Why is Poland the fastest-growing logistics hub for chemicals?
Its 35 million m² modern warehouse base, strategic east-west trade location, and lower operating costs propel a 4.08% CAGR.
What is driving demand for temperature-controlled chemical transport?
Expansion of biologics and cosmetics manufacturing requires validated cold-chain networks, lifting the segment at a 4.32% CAGR.
How are CO₂-based tolls affecting chemical freight in Germany?
The carbon-indexed charges raise trucking costs up to 15%, pushing shippers toward rail and intermodal options to control expenses.
What competitive strategies are market leaders pursuing?
Major 3PLs are consolidating networks through acquisitions and adopting digital platforms that optimize hazardous cargo routing and emissions reporting.
Page last updated on:


