Europe Cat Food Market Size and Share
Market Overview
| Study Period | 2018 - 2031 |
|---|---|
| Forecast Data Period | 2026 - 2031 |
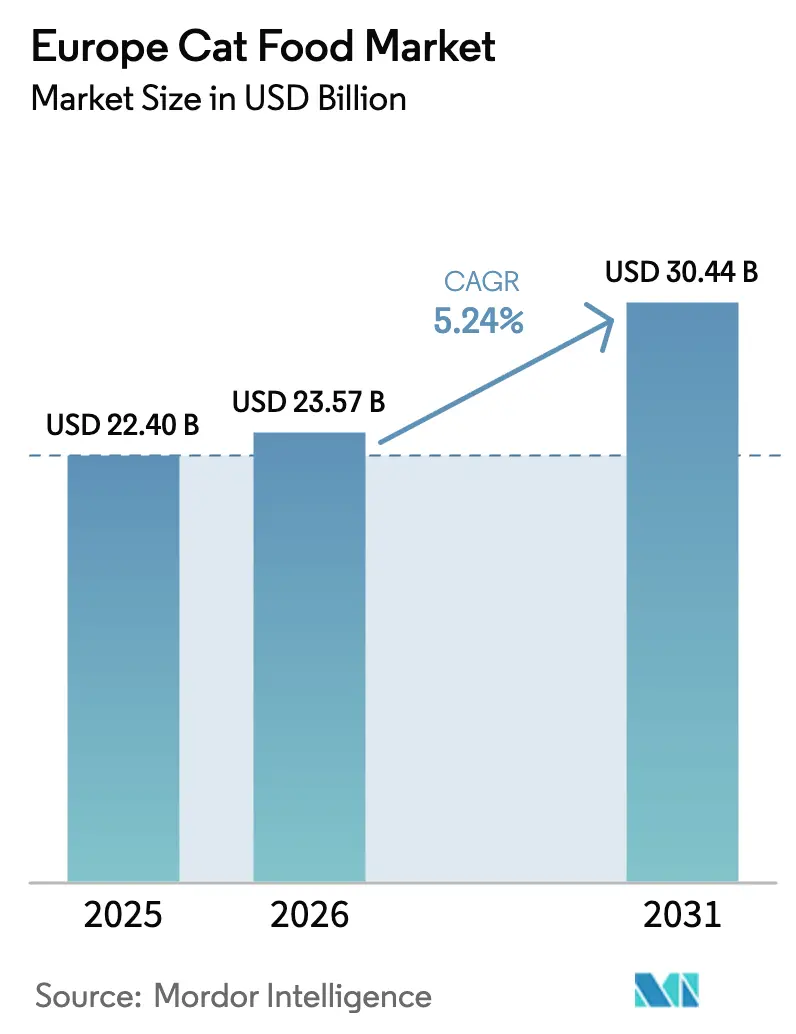
| Base Year Market Size (2025) | USD 22.40 Billion |
| Market Size (2026) | USD 23.57 Billion |
| Market Size (2031) | USD 30.44 Billion |
| Growth Rate (2026 - 2031) | 5.24% CAGR |
| Market Concentration | Low |
Major Players *Disclaimer: Major Players sorted in no particular order Image © Mordor Intelligence. Reuse requires attribution under CC BY 4.0. | |
Europe Cat Food Market Analysis by Mordor Intelligence
The Europe cat food market size was valued at USD 22.40 billion in 2025 and estimated to grow from USD 23.57 billion in 2026 to reach USD 30.44 billion by 2031, at a CAGR of 5.24% during the forecast period (2026-2031). Strong demand for premium, human-grade recipes, the rapid rise of functional formulas, and sustained cat ownership growth throughout the region underpin this trajectory. Manufacturers keep expanding local capacity to limit cross-border costs and to align with tightening European Union sustainability rules. At the same time, e-commerce adoption deepens customer engagement through subscription models and data-driven personalization, enabling brands to offset inflationary pressure with value-added services. Regulatory incentives for alternative proteins further diversify ingredient sourcing while strengthening environmental credentials.
Key Report Takeaways
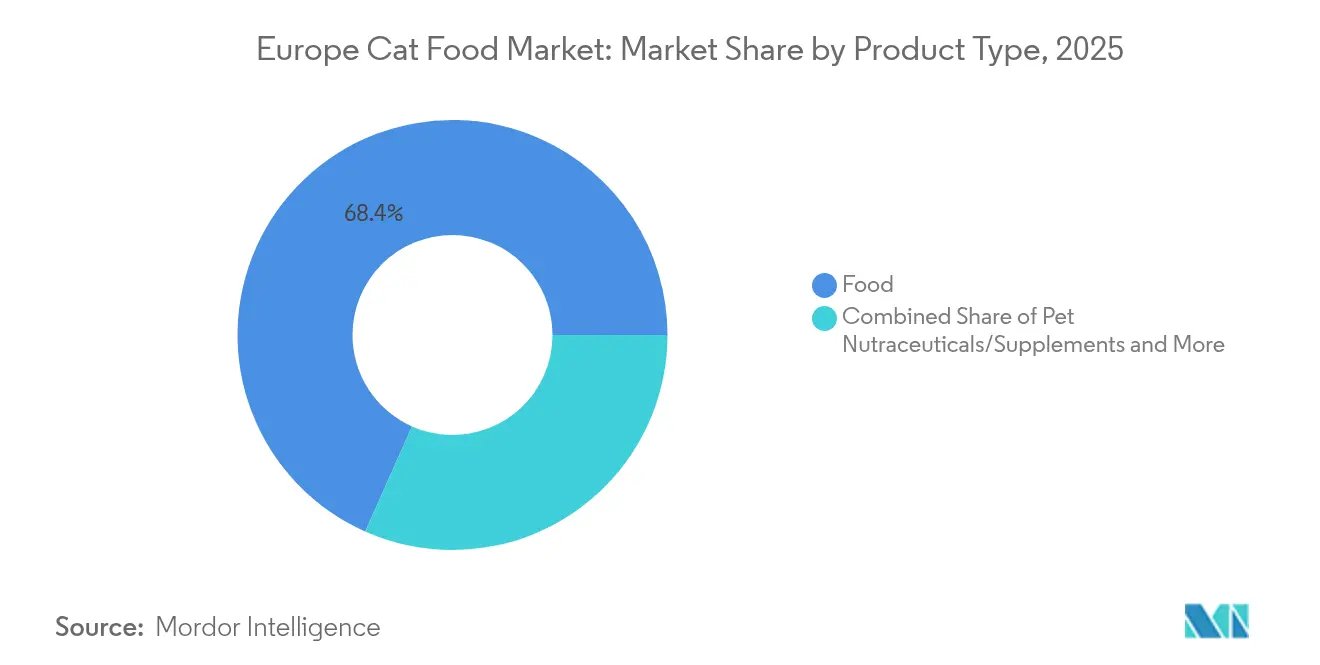
- By product type, Food captured 68.35% of the Europe cat food market share in 2025, while Nutraceuticals and Supplements are forecast to expand at an 7.86% CAGR through 2031.
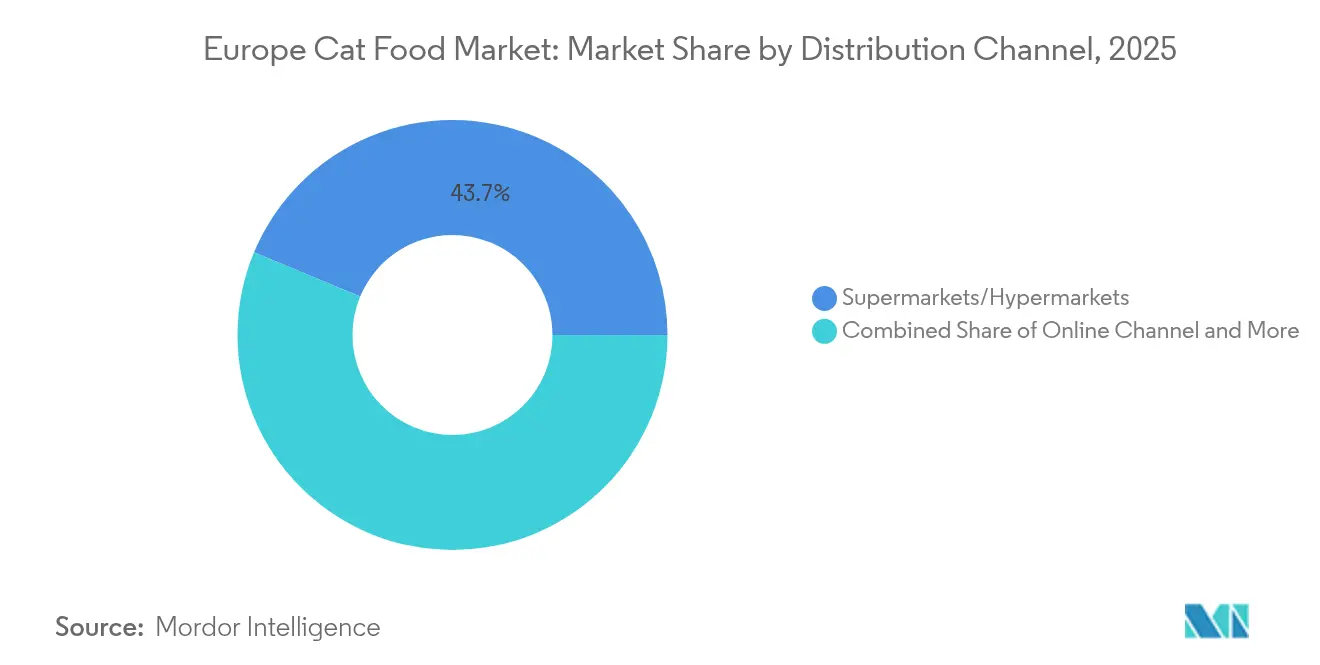
- By distribution channel, Supermarkets and Hypermarkets led with 43.72% of the Europe cat food market revenue share in 2025, while the Online Channel is projected to advance at a 6.42% CAGR between 2026 and 2031.
- By country, Germany accounted for 23.05% of the Europe cat food market size in 2025, and Spain is anticipated to post the fastest growth at a 6.82% CAGR to 2031.
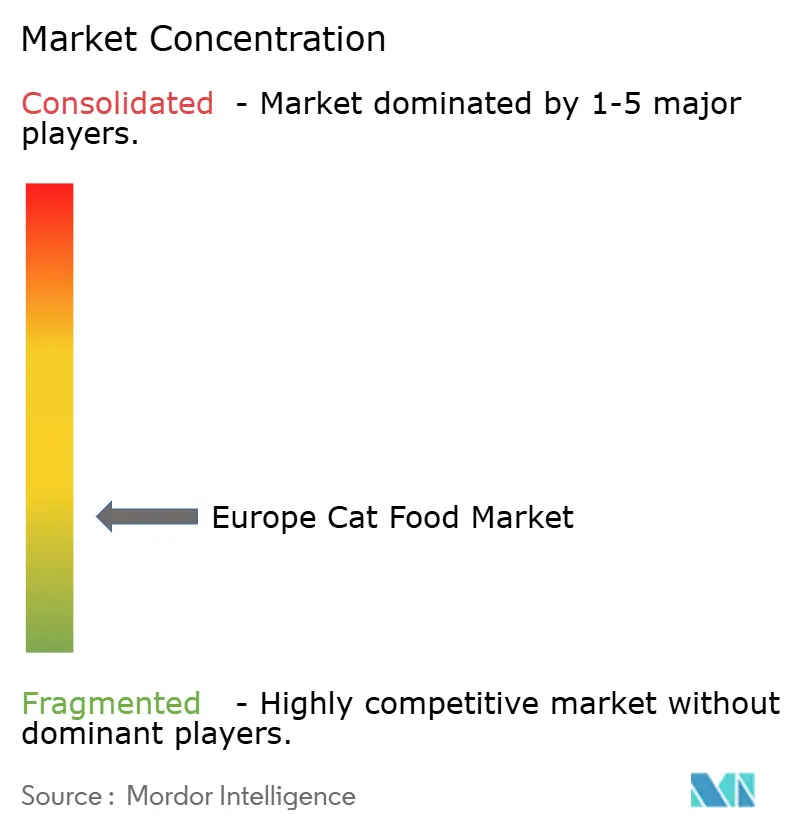
- The Europe cat food market exhibits a fragmented competitive landscape dominated by global conglomerates like Mars Incorporated, Nestle S.A. (Purina), Colgate-Palmolive Company (Hill's Pet Nutrition, Inc.), Archer Daniels Midland, and Affinity Petcare S.A., accounting for a share of 22.55% in 2025, with diverse product portfolios spanning multiple pet care segments.
Note: Market size and forecast figures in this report are generated using Mordor Intelligence’s proprietary estimation framework, updated with the latest available data and insights as of 2026.
Europe Cat Food Market Trends and Insights
Drivers Impact Analysis*
| Driver | (~) % Impact on CAGR Forecast | Geographic Relevance | Impact Timeline |
|---|---|---|---|
| Premiumization of human-grade cat food | +6.5% | Strongest in Western Europe | Medium term (2-4 years) |
| Growing European cat ownership base expands | + 3.9% | Pan-European, led by single-person households | Long term (≥ 4 years) |
| Omnichannel retail expansion accelerates | + 8.0% | Europe, accelerated in urban centers | Short term (≤ 2 years) |
| Demand for functional/condition-specific formulas | +1.2% | Europe core markets | Medium term (2-4 years) |
| Europe taxonomy incentives for sustainable proteins | +0.8% | Europe-specific regulatory framework | Long term (≥ 4 years) |
| Post-Brexit tariff harmonization | +1.1% | United Kingdom-European trade corridor optimization | Short term (≤ 2 years) |
| Source: Mordor Intelligence | |||


Premiumization of Human-Grade Cat Food
European cat owners increasingly view their pets as family members, driving demand for human-grade pet food formulations and artisanal production methods. This humanization trend has led consumers to pay premium prices for products with fresh meat, minimal processing, and transparent ingredient sourcing. Gussto's expansion across Europe, featuring 100% fresh European organic meat, demonstrates the market's acceptance of premium products. Animal Island reports significant sales volumes in wet pouch formats that prioritize quality over cost. The trend has also influenced packaging innovation, with Multivac and Südpack developing recyclable thermoform solutions that reduce material usage by 50% while maintaining premium product presentation.
Growing European Cat Ownership Base Expands
Europe's cat population reached 129 million in 2024, with 27% of households owning at least one cat, representing a 4% year-over-year increase in pet-owning households[1]Source: FEDIAF, “European Facts and Figures 2024,” fediaf.org . Demographic shifts favor continued expansion, particularly among younger urban professionals and single-person households who view cats as ideal companions for apartment living. The UK exemplifies this trend with ownership increasing among 18-34 year-olds while declining in the 35-54 age bracket, suggesting generational preference changes. Housing trends supporting outdoor access correlate with higher ownership rates, as households with gardens or terraces show twice the likelihood of cat ownership compared to apartment dwellers without outdoor space.
Omnichannel Retail Expansion Accelerates
European pet care represents the only nongrocery category to recover beyond 2019 levels, with online channels growing approximately 12% in 2023. Fressnapf Group's EUR 4 billion (USD 4.66 billion) revenue and 19% international growth exemplify successful omnichannel strategies combining physical presence with digital capabilities. Spain demonstrates the channel evolution most clearly, with specialized and e-commerce channels growing 18.1% while traditional grocery maintains dominance. The shift reflects consumer preference for expert advice and product variety unavailable in traditional grocery formats. Regulatory compliance requirements, particularly EFSA (European Food Safety Authority) feed additive guidelines effective December 2024, favor specialized retailers with technical expertise to navigate complex product claims and certifications.
Demand for Functional and Condition-Specific Formulas
Functional cat food addressing specific health conditions commands premium pricing while serving Europe's aging feline population, with average cat age reaching 6.5 years in France. Archer Daniels Midland research indicates 85% of European consumers believe proper nutrition and supplements are as important for pets as humans, with Germany showing 54% purchasing functional pet products within two months. Hill's Science Diet Vet Essential launch demonstrates market opportunity, featuring multi-care formulations addressing weight management, digestive health, and dental care through veterinary channels. Probiotic awareness varies significantly by market, with Poland and Germany indicating untapped potential for targeted education campaigns.
Restraints Impact Analysis*
| Restraint | (~) % Impact on CAGR Forecast | Geographic Relevance | Impact Timeline |
|---|---|---|---|
| Inflation-driven trading down | -2.1% | European, acute in Eastern markets | Short term (≤ 2 years) |
| Stringent European feed-additive approvals | - 1.8% | European Union regulatory jurisdiction | Medium term (2-4 years) |
| Wallet share erosion from insect-based pet food | - 0.9% | Western Europe early adoption | Long term (≥ 4 years) |
| Urban market saturation in Western Europe | -1.0% | Major metropolitan areas | Long term (≥ 4 years) |
| Source: Mordor Intelligence | |||
Stringent European Feed-Additive Approvals
The European Food Safety Authority's updated guidance, effective December 1, 2024, requires a minimum 28-day study duration for cats and enhanced public consultation processes beginning February 2025 [2]Source: EFSA, “Guidance for the preparation of dossiers for additives,” efsa.europa.eu. These requirements extend development timelines and increase regulatory costs, particularly affecting smaller companies seeking to introduce novel functional ingredients. The approval process complexity creates competitive advantages for established players with regulatory expertise and financial resources to navigate lengthy authorization procedures. Recent authorizations for probiotics, antioxidants, and flavoring compounds demonstrate pathway viability but highlight the extended timelines required for market entry. Novel food applications face additional hurdles with enhanced documentation requirements and public consultation mandates that can delay commercialization by 12-18 months compared to less regulated markets.
Wallet Share Erosion from Insect-Based Pet Food
Alternative protein adoption, particularly insect-based formulations, begins capturing market share from conventional meat-based products as sustainability-conscious consumers embrace novel nutrition solutions. Imby's "almost vegetarian cat food" containing 38% mealworm protein and Yora's formulations with 62.5% black soldier fly larvae demonstrate commercial viability in premium segments. European Parliamentary Research Service projects insect feed production could reach 2.7 million metric tons by 2030, with 95% dominated by black soldier fly and yellow mealworm species. The trend particularly affects premium wet food segments where sustainability messaging resonates with affluent urban consumers seeking environmentally responsible alternatives.
*Our forecasts treat driver/restraint impacts as directional, not additive. The impact forecasts reflect baseline growth, mix effects, and variable interactions.
Segment Analysis
By Product Type: Nutraceuticals Drive Premium Category Expansio
The Food segment commands 68.35% of the Europe cat food market share in 2025, generating the majority of category volume through dry and wet formulations that serve daily nutrition needs across Europe's 129 million cats. This substantial market share is primarily driven by cat feed being considered a fundamental product for cats, providing them with essential nutrition and a well-balanced diet. Within this segment, wet food holds a larger share of about 53% compared to dry food, as cats naturally prefer wet food due to its higher moisture content and stronger aroma that appeals to their highly developed sense of smell. The segment's strong performance is further supported by the increasing trend of pet humanization, where owners are increasingly focused on providing high-quality, nutritious feline food options for their cats. Major companies in the region are actively developing innovative food products with natural ingredients and specialized formulations to meet the diverse nutritional needs of cats at different life stages.
Nutraceuticals and Supplements emerge as the fastest-growing segment at 7.86% CAGR during 2026-2031, reflecting increasing pet owner sophistication and willingness to invest in preventive health solutions. This remarkable growth is driven by increasing awareness among pet owners about the importance of preventive healthcare and the benefits of supplemental nutrition for their cats. The segment encompasses various products, including omega-3 fatty acids, probiotics, vitamins and minerals, and proteins and peptides, each serving specific health functions. The growth is particularly strong in markets like Germany and the United Kingdom, where pet owners are increasingly investing in premium nutritional supplements to support their cats' overall health and well-being. The trend is further supported by veterinarians actively recommending these products as part of preventive healthcare routines, contributing to the expansion of the cat nutritional supplements market.


By Distribution Channel: E-commerce Transforms Retail Landscape
Supermarkets and Hypermarkets maintain a 43.72% of the Europe Cat Food Market distribution share in 2025, leveraging convenience and competitive pricing to serve mainstream consumer segments seeking everyday nutrition solutions. These retail establishments serve as primary destinations for pet owners due to their ability to offer a comprehensive shopping experience where customers can purchase cat food alongside their regular groceries. The segment's leadership position is strengthened by competitive pricing strategies, frequent promotional campaigns, and the availability of a wide range of cat food brands, flavors, and formulations. Major supermarket chains like Tesco, Carrefour, Auchan, Lidl, and Aldi have established strong positions in the cat food retail space by maintaining extensive product portfolios that include both premium and economy brands, catering to diverse consumer preferences and budgets.
Online Channel acceleration at 6.42% CAGR during 2026-2031 reflects fundamental shifts in pet care purchasing behavior, particularly among younger demographics and premium product segments. Online channels have gained significant traction by offering convenience and extensive product selection, while convenience stores serve as important points for emergency purchases and impulse buying. Other channels, including veterinary clinics, pet grooming centers, and direct-to-consumer sales, contribute to the market's accessibility and convenience for pet owners. Each of these channels plays a unique role in meeting diverse consumer needs, from providing specialized products and expert advice to offering convenient shopping solutions for pet owners across different locations and preferences.
Geography Analysis
Germany commands 23.05% country share in 2025, representing Europe's largest and most mature market. The country's leadership position is primarily driven by its large cat population, which significantly influences the demand for various cat food products. German pet owners demonstrate a strong preference for premium and super-premium cat food brands that offer formulations with natural, gluten-free, single-protein, and functional ingredients. The market is characterized by a robust distribution network, with both traditional retail channels and emerging e-commerce platforms playing crucial roles. The country's pet food manufacturers are increasingly focusing on developing specialized products that cater to specific dietary requirements and health conditions of cats.
Spain emerges as the fastest-growing country at 6.82% CAGR during 2026-2031. Spain shows strong potential for premium product segments, while Eastern European markets are witnessing rapid modernization of their pet food retail infrastructure. Consumer preferences in these markets are gradually shifting towards higher-quality commercial pet food products, driven by increasing awareness of pet nutrition and health.
The trend of pet humanization is becoming increasingly prevalent across these markets, though at different rates and intensities. Local manufacturers and international brands are adapting their strategies to meet the specific needs and preferences of each market, while also introducing innovative products that cater to emerging consumer demands.
Competitive Landscape
The European cat food market exhibits a fragmented competitive landscape dominated by global conglomerates like Mars Incorporated, Nestle S.A. (Purina), Colgate-Palmolive Company (Hill's Pet Nutrition, Inc.), Archer Daniels Midland, and Affinity Petcare S.A., accounting for a share of 22.9% in 2024, with diverse product portfolios spanning multiple pet care segments. These major players leverage their extensive research and development capabilities, established brand recognition, and robust distribution networks to maintain their market positions. While global companies lead the market, several regional specialists have carved out significant niches by focusing on specific product categories or geographical regions, particularly in premium and natural pet food segments. In September 2023, Buffalo's rapid European scaling through premium natural positioning, while acquisition activity accelerates consolidation, as demonstrated by Vafo Group's Austrian PetCo purchase, creating a combined EUR 600 million turnover[3]Source: Petfood Industry, “Vafo Group acquires Austrian PetCo,” petfoodindustry.com .
The market has witnessed significant consolidation through mergers and acquisitions, as larger companies seek to expand their product portfolios and geographical presence. These strategic moves have been particularly focused on acquiring companies with strong positions in natural and premium pet food segments, as well as those with established direct-to-consumer channels. The trend toward consolidation has been driven by the need to achieve economies of scale, enhance innovation capabilities, and strengthen market presence in key European regions.
Success in the European cat food market increasingly depends on companies' ability to innovate across product formulations, packaging, and distribution channels. Incumbents must focus on developing premium and specialized products while maintaining strong relationships with veterinarians and pet specialty retailers. Companies need to invest in research and development to create products that address specific health concerns and nutritional requirements, while also expanding their e-commerce capabilities to meet changing consumer shopping preferences.
Europe Cat Food Industry Leaders
Mars, Incorporated
Colgate-Palmolive Company (Hill's Pet Nutrition, Inc.)
Affinity Petcare S.A
Archer Daniels Midland
Nestle S.A. (Purina)
- *Disclaimer: Major Players sorted in no particular order

Recent Industry Developments
- July 2023: Hill's Pet Nutrition introduced its new MSC (Marine Stewardship Council) certified pollock and insect protein products for pets including cats with sensitive stomachs and skin lines. They contain vitamins, omega-3 fatty acids, and antioxidants.
- May 2023: Nestle S.A. (Purina) launched new cat treats under the Friskies "Friskies Playfuls - treats" brand. These treats are round in shape and are available in chicken and liver and salmon and shrimp flavors for adult cats.
- May 2023: Virbac S.A. acquired its distributor (GS Partners) in the Czech Republic and Slovakia, which became Virbac's 35th subsidiary. This new subsidiary allows Virbac to expand its presence more in these countries.


Europe Cat Food Market Report Scope
Food, Pet Nutraceuticals/Supplements, Pet Treats, and Pet Veterinary Diets are covered as segments by Pet Food Product. Convenience Stores, Online Channel, Specialty Stores, and Supermarkets/Hypermarkets are covered as segments by the Distribution Channel. France, Germany, Italy, Netherlands, Poland, Russia, Spain, United Kingdom are covered as segments by Country.
| Food | By Sub Product | Dry Pet Food | By Sub Dry Pet Food | Kibbles |
| Other Dry Pet Food | ||||
| Wet Pet Food | ||||
| Pet Nutraceuticals/Supplements | By Sub Product | Milk Bioactives | ||
| Omega-3 Fatty Acids | ||||
| Probiotics | ||||
| Proteins and Peptides | ||||
| Vitamins and Minerals | ||||
| Other Nutraceuticals | ||||
| Pet Treats | By Sub Product | Crunchy Treats | ||
| Dental Treats | ||||
| Freeze-dried and Jerky Treats | ||||
| Soft & Chewy Treats | ||||
| Other Treats | ||||
| Pet Veterinary Diets | By Sub Product | Diabetes | ||
| Digestive Sensitivity | ||||
| Oral Care Diets | ||||
| Renal | ||||
| Urinary tract disease | ||||
| Obesity Diets | ||||
| Derma Diets | ||||
| Other Veterinary Diets |
| Convenience Stores |
| Online Channel |
| Specialty Stores |
| Supermarkets/Hypermarkets |
| Other Channels |
| Germany |
| France |
| Spain |
| Italy |
| United Kingdom |
| Poland |
| Russia |
| Netherlands |
| Rest of Europe |
| Pet Food Product | Food | By Sub Product | Dry Pet Food | By Sub Dry Pet Food | Kibbles |
| Other Dry Pet Food | |||||
| Wet Pet Food | |||||
| Pet Nutraceuticals/Supplements | By Sub Product | Milk Bioactives | |||
| Omega-3 Fatty Acids | |||||
| Probiotics | |||||
| Proteins and Peptides | |||||
| Vitamins and Minerals | |||||
| Other Nutraceuticals | |||||
| Pet Treats | By Sub Product | Crunchy Treats | |||
| Dental Treats | |||||
| Freeze-dried and Jerky Treats | |||||
| Soft & Chewy Treats | |||||
| Other Treats | |||||
| Pet Veterinary Diets | By Sub Product | Diabetes | |||
| Digestive Sensitivity | |||||
| Oral Care Diets | |||||
| Renal | |||||
| Urinary tract disease | |||||
| Obesity Diets | |||||
| Derma Diets | |||||
| Other Veterinary Diets | |||||
| Distribution Channel | Convenience Stores | ||||
| Online Channel | |||||
| Specialty Stores | |||||
| Supermarkets/Hypermarkets | |||||
| Other Channels | |||||
| Country | Germany | ||||
| France | |||||
| Spain | |||||
| Italy | |||||
| United Kingdom | |||||
| Poland | |||||
| Russia | |||||
| Netherlands | |||||
| Rest of Europe | |||||


Market Definition
- FUNCTIONS - Pet foods are usually intended to provide complete and balanced nutrition to the pet but are primarily used as functional products. The scope includes the food and supplements consumed by pets including veterinary diets. Supplements/nutraceuticals that are directly supplied to pets are considered within the scope.
- RESELLERS - Companies engaged in reselling of pet food without value addition have been excluded from the market scope, in order to avoid double counting.
- END CONSUMERS - Pet owners are considered to be the end-consumers in the market studied.
- DISTRIBUTION CHANNELS - Supermarkets/hypermarkets, specialty stores, convenience stores, online channels and other channels are considered within the scope. The stores which are exclusively providing pet related basic and custom products are considered within the scope of specialty stores.
| Keyword | Definition |
|---|---|
| Pet Food | The scope of pet food includes the food that is eatable by pets including food, treats, veterinary diets, and nutraceuticals/supplements. |
| Food | Food is animal feed intended for consumption by pets. It is formulated to provide essential nutrients and meet the dietary needs of various types of pets, including dogs, cats, and other animals. These are generally segmented into dry and wet pet foods. |
| Dry Pet Food | Dry pet foods may be extruded/baked (kibbles) or flaked. They have a lower moisture content, typically around 12-20%. |
| Wet Pet Food | Wet pet food, also known as canned pet food or moist pet food, generally has a higher moisture content compared to dry pet food, often ranging from 70-80%. |
| Kibbles | Kibbles are dry, processed pet food in small, bite-sized pieces or pellets. They are specifically formulated to provide balanced nutrition for various domestic animals, such as dogs, cats, and other animals. |
| Treats | Pet Treats are special food items or rewards given to pets, to show affection, and encourage good behavior. They are especially used during training. Pet treats are made from various combinations of meat or meat-derived materials with other ingredients. |
| Dental Treats | Pet dental treats are specialized treats that are formulated to promote good oral hygiene in pets. |
| Crunchy Treats | It is a type of pet treat that has a firm and crispy texture which can be a good source of nutrition for pets. |
| Soft and chewy treats | Soft and Chewy pet treats are a type of pet food product that is formulated to be easy to chewy and digest. They are usually made from soft and pliable ingredients, such as meat, poultry, or vegetables, that have been blended and formed into bite-sized pieces or strips. |
| Freeze-dried & Jerky Treats | Freeze-dried and jerky treats are snacks given to pets, that are prepared through a special preservation process, without damaging the nutritional content, resulting in long-lasting, nutrient-rich treats. |
| Urinary Tract Disease Diets | These are commercial diets that are specifically formulated to promote urinary health and reduce the risk of urinary tract infections and other urinary problems. |
| Renal Diets | These are specialized pet foods formulated to support the health of pets with kidney disease or renal insufficiency. |
| Digestive Sensitivity Diets | Digestive-sensitive diets are specially formulated to meet the nutritional needs of pets with digestive issues such as food intolerances, allergies, and sensitivities. These diets are designed to be easily digestible and to reduce the symptoms of digestive problems in pets. |
| Oral Care Diets | Oral care diets for pets are specially formulated diets produced to promote oral health and hygiene in pets. |
| Grain-Free Pet Food | Pet food that does not contain common grains like wheat, corn, or soy. Grain-free diets are often preferred by pet owners seeking alternative options or if their pets have specific dietary sensitivities. |
| Premium Pet Food | High-quality pet food formulated with superior ingredients often offers additional nutritional benefits compared to standard pet food. |
| Natural Pet Food | Pet food made from natural ingredients, with minimal processing and without artificial preservatives. |
| Organic Pet Food | Pet food is produced using organic ingredients, free from synthetic pesticides, hormones, and genetically modified organisms (GMOs). |
| Extrusion | A manufacturing process used to produce dry pet food, where ingredients are cooked, mixed, and shaped under high pressure and temperature. |
| Other Pets | Other pets include birds, fish, rabbits, hamsters, ferrets, and reptiles. |
| Palatability | The taste, texture, and aroma of pet food influence its appeal and acceptance by pets. |
| Complete and Balanced Pet Food | Pet food that provides all essential nutrients in appropriate proportions to meet the nutritional needs of pets without additional supplementation. |
| Preservatives | These are the substances that are added to pet food to extend its shelf life and prevent spoilage. |
| Nutraceuticals | Food products that offer health benefits beyond basic nutrition, often contain bioactive compounds with potential therapeutic effects. |
| Probiotics | Live beneficial bacteria that promote a healthy balance of gut flora, supporting digestive health and immune function in pets. |
| Antioxidants | Compounds that help neutralize harmful free radicals in the body, promoting cellular health and supporting the immune system in pets. |
| Shelf-Life | The duration of which pet food remains safe and nutritionally viable for consumption after its production date. |
| Prescription diet | Specialized pet food formulated to address specific medical conditions under veterinary supervision. |
| Allergen | A substance that can cause allergic reactions in some pets, leading to food allergies or sensitivities. |
| Canned food | Wet pet food that is packed in cans and contains higher moisture content than dry food. |
| Limited ingredient diet (LID) | Pet food formulated with a reduced number of ingredients to minimize potential allergens. |
| Guaranteed Analysis | The minimum or maximum levels of certain nutrients present in pet food. |
| Weight management | Pet food designed to help pets maintain a healthy weight or support weight loss efforts. |
| Other Nutraceuticals | It includes prebiotics, antioxidants, digestive fiber, enzymes, essential oils and herbs. |
| Other Veterinary Diets | It includes weight management diets, skin and coat health, cardiac care, and joint care. |
| Other Treats | It includes rawhides, mineral blocks, lickables, and catnips. |
| Other Dry Foods | It includes cereal flakes, mixers, meal toppers, freeze-dried foods, and air-dried foods. |
| Other Animals | It includes birds, fish, reptiles, and small animals (rabbits, ferrets, hamsters). |
| Other Distribution Channels | It includes veterinary clinics, local unregulated stores, and feed and farm stores. |
| Proteins and Peptides | Proteins are large molecules composed of basic units called amino acids which help in the growth and development of pets. Peptides are the short string of 2 to 50 amino acids. |
| Omega-3 fatty acids | Omega-3 fatty acids are essential polyunsaturated fats that play a crucial role in the overall health and well-being of Pets |
| Vitamins | Vitamins are the essential organic compounds that are essential for vital physiological functioning. |
| Minerals | Minerals are naturally occurring inorganic substances that are essential for various physiological functions in pets. |
| CKD | Chronic Kidney Disease |
| DHA | Docosahexaenoic Acid |
| EPA | Eicosapentaenoic Acid |
| ALA | Alpha-linolenic Acid |
| BHA | Butylated Hydroxyanisol |
| BHT | Butylated Hydroxytoluene |
| FLUTD | Feline Lower Urinary Tract Disease |


Research Methodology
Mordor Intelligence follows a four-step methodology in all our reports.
- Step-1: IDENTIFY KEY VARIABLES: In order to build a robust forecasting methodology, the variables and factors identified in Step-1 are tested against available historical market numbers. Through an iterative process, the variables required for market forecast are set and the model is built on the basis of these variables.
- Step-2: Build a Market Model: Market-size estimations for the forecast years are in nominal terms. Inflation is not a part of the pricing, and the average selling price (ASP) is kept constant throughout the forecast period.
- Step-3: Validate and Finalize: In this important step, all market numbers, variables and analyst calls are validated through an extensive network of primary research experts from the market studied. The respondents are selected across levels and functions to generate a holistic picture of the market studied.
- Step-4: Research Outputs: Syndicated Reports, Custom Consulting Assignments, Databases & Subscription Platforms


