UK Cat Food Market Size and Share
Market Overview
| Study Period | 2018 - 2031 |
|---|---|
| Forecast Data Period | 2026 - 2031 |
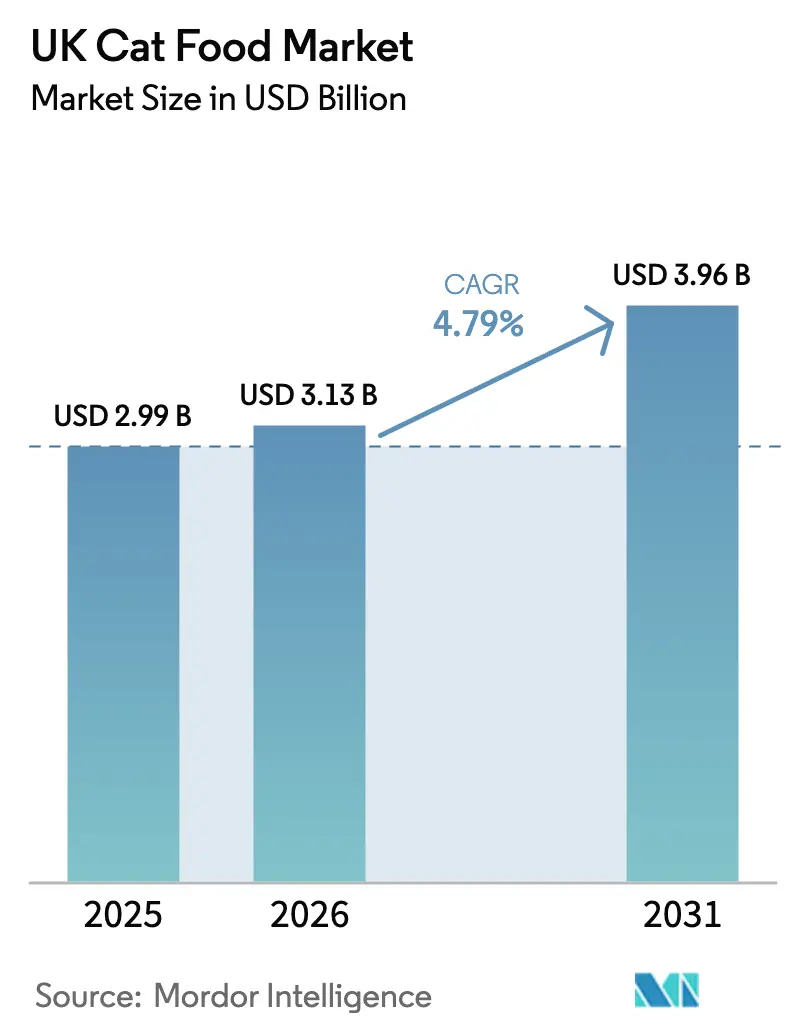
| Base Year Market Size (2025) | USD 2.99 Billion |
| Market Size (2026) | USD 3.13 Billion |
| Market Size (2031) | USD 3.96 Billion |
| Growth Rate (2026 - 2031) | 4.79% CAGR |
| Market Concentration | Low |
Major Players *Disclaimer: Major Players sorted in no particular order Image © Mordor Intelligence. Reuse requires attribution under CC BY 4.0. | |
UK Cat Food Market Analysis by Mordor Intelligence
The UK cat food market size is expected to grow from USD 2.99 billion in 2025 to USD 3.13 billion in 2026 and is forecast to reach USD 3.96 billion by 2031 at 4.79% CAGR over 2026-2031. Premiumization, subscription commerce, and growing veterinary influence collectively sustain the demand trajectory even as household budgets tighten. The sector benefits from a large companion base of cats living in UK homes, a level that anchors steady unit sales across all price tiers. Resilience is further underpinned by owners stating they would cut their own food spending before compromising feline nutrition, a sentiment that shields revenue during economic stress. Tightening Food Standards Agency rules on health claims favors well-capitalized players that can document ingredient efficacy, while Brexit-related trade friction nudges retailers toward local sourcing, giving domestic factories a cost and lead-time advantage. At the same time, raw-material inflation and elevated grocery competition spur innovation in insect protein, recyclable packs, and direct-to-consumer (DTC) logistics as brands seek margin protection without sacrificing value.
Key Report Takeaways
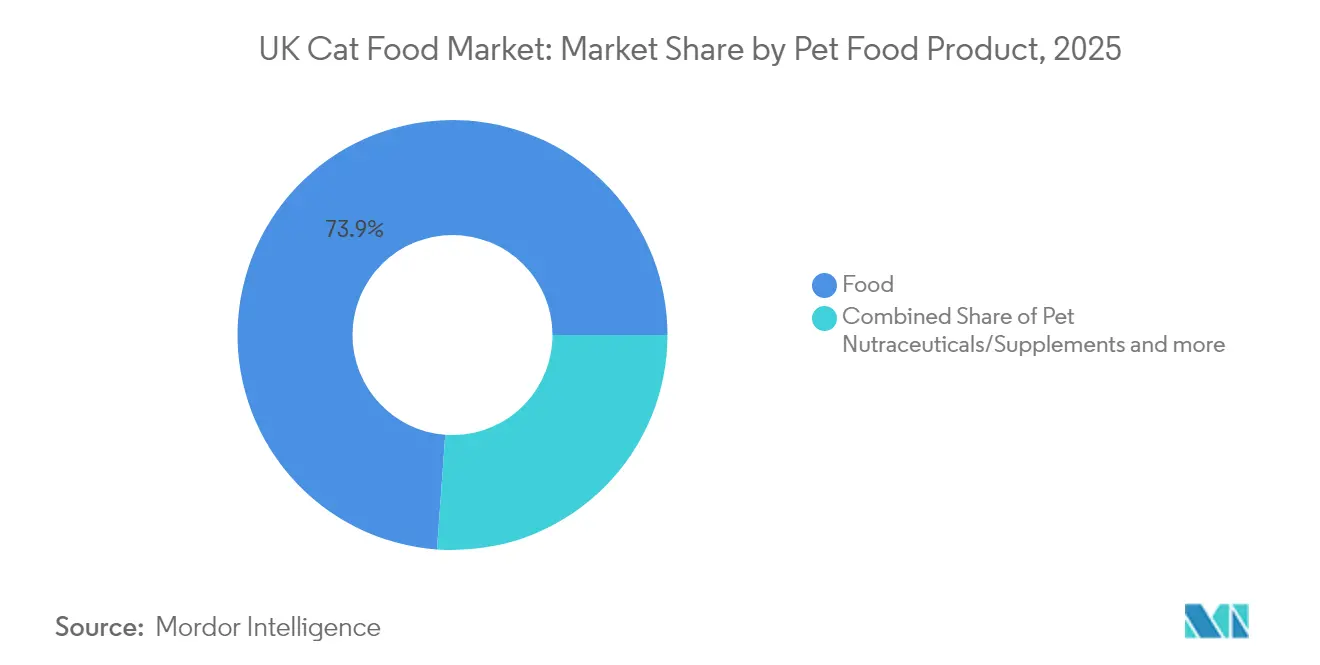
- By pet food product, the broad Food segment held a 73.85% share of the UK cat food market size in 2025. Pet Nutraceuticals and Supplements are projected to post the fastest 10.1% CAGR through 2031.
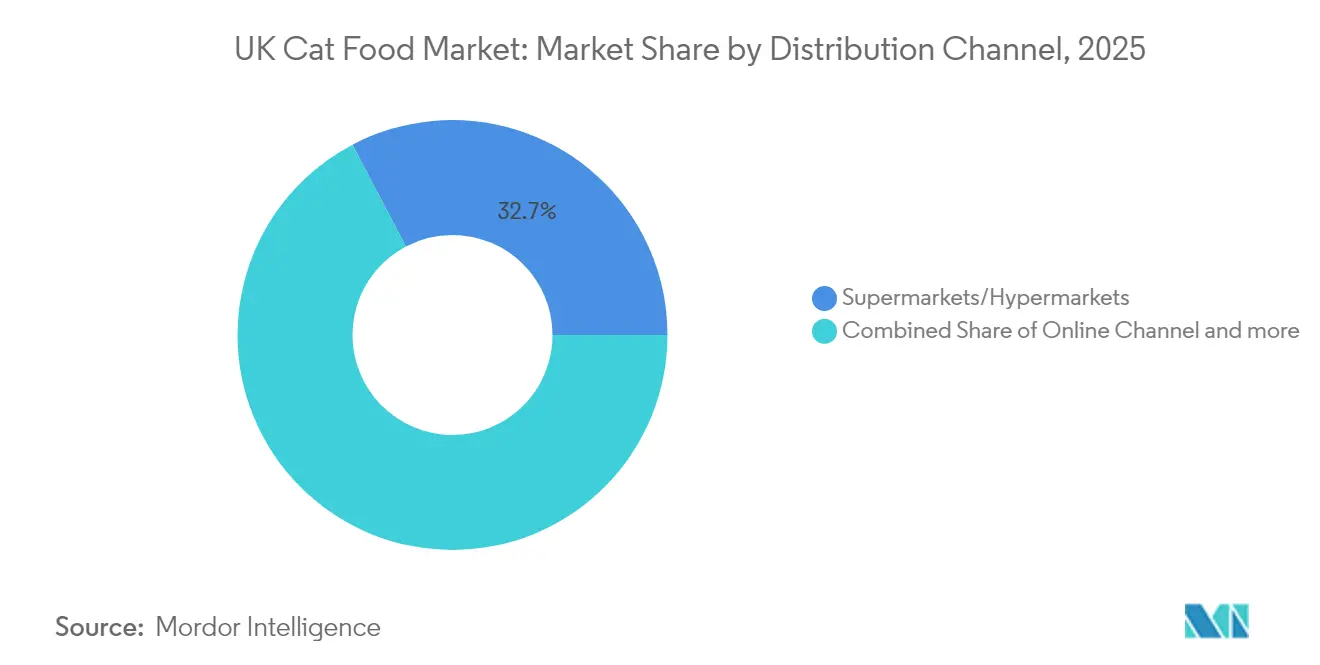
- By distribution channel, Supermarkets and Hypermarkets captured 32.70% of the UK cat food market share in 2025, while Online Channels are set to expand at a 5.43% CAGR to 2031.
- Mars, Incorporated, Nestlé (Purina), Diamond Pet Foods, Farmina Pet Foods, and Hill’s Pet Nutrition together captured 28.31% revenue in 2024, underscoring a fragmented landscape.
Note: Market size and forecast figures in this report are generated using Mordor Intelligence’s proprietary estimation framework, updated with the latest available data and insights as of 2026.
UK Cat Food Market Trends and Insights
Drivers Impact Analysis*
| Driver | (~) % Impact on CAGR Forecast | Geographic Relevance | Impact Timeline |
|---|---|---|---|
| Accelerating premiumization and human-grade ingredient adoption | +1.2% | UK-wide, concentrated in urban areas | Medium term (2-4 years) |
| Booming subscription and direct-to-consumer (DTC) services | +0.8% | UK-wide, led by London and Southeast | Short term (≤ 2 years) |
| Growing cat population and pet-humanization spend resilience | +0.9% | UK-wide | Long term (≥ 4 years) |
| Veterinary endorsement of targeted feline health diets | +0.7% | UK-wide | Medium term (2-4 years) |
| E-commerce logistics and rapid-delivery expansion | +0.6% | UK-wide, urban concentration | Short term (≤ 2 years) |
| Sustainability and novel-protein innovation (insect, cultured) | +0.4% | UK-wide, early adoption in metropolitan areas | Long term (≥ 4 years) |
| Source: Mordor Intelligence | |||
Accelerating Premiumization and Human-Grade Ingredient Adoption
Brands are able to validate ingredient quality through clinical data capture, premium shelf space, and digital share of voice. KatKin’s recent GBP 25 million (USD 32 million) capital raise expanded fresh-meal capacity, signaling investor confidence in its high-value position[1]Source: KatKin, “About KatKin,” katkin.com. Over 60% of domestic buyers now cite healthfulness as their primary decision driver, a factor reinforced by Food Standards Agency labeling mandates that compel scientific backing for nutrition or wellness claims. Packaging upgrades to portion-controlled pouches made from recyclable film further align with owner expectations around sustainability and convenience. Premiumization, therefore, simultaneously widens margins and lifts the overall UK cat food market value ceiling.
Booming Subscription and Direct-to-Consumer Services
Subscription models create reliable cash flows and deepen data visibility on feeding patterns. KatKin already serves more than 200,000 cats and has shipped over 70 million meals, illustrating scalable economics and low churn in 2024. Internal data shows 53% of subscribers have reduced in-store visits, pressuring legacy retailers to accelerate omnichannel investments. Mars allocates USD 1 billion toward predictive analytics and last-mile automation that will underpin similar personalized offerings in 2024[2]Source: Mars Incorporated, “Digital Investment Announcement,” mars.com. Resulting competitive intensity accelerates innovation cycles, further differentiating the UK cat food market from slower-moving grocery categories.
Growing Cat Population and Pet-Humanization Spend Resilience
With 12.5 million felines residing in 29% of households, population growth underpins recurring demand. In 2025, a surveys reveal 63% of owners would cut personal food budgets before compromising pet nutrition, an attitude that insulates revenue during downturns. Male adoption rates rising to 27% demonstrate widening demographic engagement. This behavioral pattern supports premium pricing strategies and justifies investment in product innovation, as pet owners increasingly view nutrition as preventive healthcare rather than commodity consumption. The trend accelerates through social media influence and veterinary education campaigns that position proper nutrition as essential for feline longevity and quality of life
Veterinary Endorsement of Targeted Feline Health Diets
Prescription diets for renal, diabetic, or digestive conditions benefit from clinical gatekeeping. The Competition and Markets Authority notes that medicines and related nutrition contribute a large clinic turnover, with average prescription fees of GBP 17 (USD 21). Brands such as Hill’s and Royal Canin leverage long-standing practice relationships to maintain share and justify premium pricing. British Veterinary Association statements calling for evidence-based feeding regimens lend further credibility to therapeutic formats[3]Source: British Veterinary Association, “Position Statements on Pet Nutrition,” bva.co.uk.
Restraints Impact Analysis*
| Restraint | (~) % Impact on CAGR Forecast | Geographic Relevance | Impact Timeline |
|---|---|---|---|
| Raw-material price volatility | -0.9% | UK-wide | Short term (≤ 2 years) |
| Tightening UK labeling and functional-claim regulations | -0.5% | UK-wide | Medium term (2-4 years) |
| Private-label price competition in grocery discounters | -0.7% | UK-wide, strongest in price-sensitive regions | Medium term (2-4 years) |
| Consumer trade-down risk under cost-of-living pressure | -0.6% | UK-wide, concentrated in lower-income areas | Short term (≤ 2 years) |
| Source: Mordor Intelligence | |||
Raw-Material Price Volatility
Commodity price fluctuations create margin pressure across the supply chain as protein, grain, and packaging costs remain subject to global agricultural and energy market dynamics. The OECD-FAO Agricultural Outlook highlights continued volatility in feed ingredient prices, with protein sources particularly affected by climate variability and geopolitical tensions that disrupt global trade flows. Global conglomerates hedge exposure through diversified sourcing and futures contracts, yet smaller manufacturers absorb spikes directly, risking range rationalization or price hikes that could slow premium trade-up momentum in the UK cat food market. The volatility particularly affects wet food formulations that require higher protein content, creating competitive advantages for dry food manufacturers that can substitute ingredients more readily while maintaining nutritional profiles.
Tightening UK Labeling and Functional-Claim Regulations
Regulatory enforcement intensifies under Food Standards Agency guidelines that require substantiation of health and nutrition claims, creating compliance costs that disproportionately affect smaller manufacturers. The Agency's updated guidance on pet food labeling mandates specific documentation for functional claims related to digestive health, joint support, and coat condition, requiring clinical evidence that many brands cannot afford to generate. Brexit divergence adds dual certification layers for firms exporting to the EU, raising overheads and lengthening product-development cycles. Startups face disproportionate burdens that can deter entry, potentially narrowing SKU variety over the medium term.
*Our forecasts treat driver/restraint impacts as directional, not additive. The impact forecasts reflect baseline growth, mix effects, and variable interactions.
Segment Analysis
By Pet Food Product: Therapeutic Diets Propel Premium Value
The food segment held a 73.85% share of the UK cat food market size in 2025. Pet Nutraceuticals and Supplements are projected to post the fastest 10.1% CAGR through 2031. Within supplements, probiotics and omega-3 capsules top owners' wish lists for digestive balance and coat sheen, while milk bioactives gain traction in senior-cat immunity regimes. Prescription renal and diabetic diets grow steadily as clinic screening rates improve and average feline lifespan rises. Dry kibble remains the dominant sub-segment for budget-minded households, yet wet pouches pick up share on palatability and hydration talking points. Treat innovation centers on dental chews that pair indulgence with measurable oral-health benefits.
Second-order effects emerge as R&D budgets pivot to condition-specific nutrients or novel textures that increase dosage compliance. Consistent veterinary advocacy underpins premium acceptance, positioning therapeutic categories as a structural growth pillar within the broader UK cat food market. Brands invest in palatable technologies to mask supplemental flavors, facilitating seamless mixing with primary meals. Meanwhile, regulatory clarity around permissible nutrient levels reduces reformulation cycles. These dynamics amplify switching costs once owners witness clinical improvements, locking wallets into higher price tiers and bolstering the UK cat food market size outlook.


By Distribution Channel: Digital Share Scales Rapidly
Supermarkets and Hypermarkets captured 32.70% of the UK cat food market share in 2025, while Online Channels are set to expand at a 5.43% CAGR to 2031. Predictive replenishment algorithms cut stockouts, a pain point that previously sent shoppers to brick-and-mortar. Mars and Nestlé Purina deploy machine-learning models that suggest diet tweaks based on age or veterinary feedback, heightening stickiness. Supermarkets and hypermarkets defend relevance with wide assortments and one-stop convenience, yet must absorb margin hits from extensive price-match initiatives. Specialty retailers emphasize in-store nutritionists who provide diet diagnostics, plus loyalty perks that mirror online bundles.
Convenience stores fulfill emergency needs, especially in rural zones where last-mile networks lag. Veterinary clinics strengthen their grip on prescription lines, leveraging package-deal discounts on services and nutrition. The evolving mix underscores how supply-chain agility and multichannel both shape purchase paths, keeping competition intense across the UK cat food market.
Geography Analysis
London and the Southeast generate the highest per-animal spend, driven by dense millennial populations, tight vet relationships, and early tech adoption. Subscription penetration already exceeds cats in these regions, roughly double the national average. Northern England and Scotland contribute larger volumes in dry formats where value orientation prevails. Here, brands pivot communication toward functional performance over ingredient exoticism to resonate with pragmatic buyers.
Brexit’s Border Target Operating Model introduces new veterinary attestations on imported animal by-products, elongating lead times from continental suppliers. Domestic manufacturers capitalize by highlighting local provenance and quicker shelf restocking. Wales and Northern Ireland, posting above-average increases in multi-pet households, become strategic test beds for mid-priced premium hybrids that blend human-grade claims with accessible unit sizes. Tele-vet platforms extend therapeutic diet access across sparsely served rural pockets, smoothing regional disparities and broadening the UK cat food market reach.
Inspection capacity differs across local authorities, affecting the enforcement intensity of the Food Standards Agency labeling statutes. Manufacturers with nationwide compliance teams can flex across jurisdictions, while smaller firms risk shipment holds that erode cash flow. Such procedural nuances subtly influence product launch sequencing and promotional spend by geography.
Competitive Landscape
Mars, Incorporated, Nestlé (Purina), Diamond Pet Foods, Farmina Pet Foods, and Hill’s Pet Nutrition together captured 28.31% revenue in 2024, underscoring a fragmented landscape, riding multi-brand portfolios and scale efficiencies. Private label permeates every grocery aisle, compelling leaders to differentiate through R&D and omnichannel loyalty ecosystems rather than shelf positioning alone. Mars pours USD 1 billion into data and logistics, accelerating personalized meal plans and one-hour delivery in 2024. Nestlé Purina debuts its own subscription hub, signaling that direct ownership of household data trumps third-party retailer intimacy.
Nimble disruptors like KatKin, Yora Pet Foods, and Meatly exploit white space in fresh, insect, or cultivated protein niches. Their marketing strategy leverages sustainability science and transparent sourcing to appeal to environmentally conscious owners. Mid-sized player Pets Choice expands by acquisition, recently integrating Nutriment to enter the raw feeding market. Strategic alliances between vets and manufacturers tighten gatekeeping on therapeutic formulations, raising barriers for entrants without medical credentials.
Private labels employ ultra-lean SKUs and purchasing scale to pressure mid-tier brands confined to traditional supermarket aisles. This polarization nudges the UK cat food market toward a barbell structure of premium science-driven propositions at one end and rock-bottom value at the other, with shrinking room for undifferentiated mainstream offerings.
UK Cat Food Industry Leaders
Colgate-Palmolive Company (Hill's Pet Nutrition Inc.)
FARMINA PET FOODS
Mars Incorporated
Nestle (Purina)
Schell & Kampeter, Inc. (Diamond Pet Foods)
- *Disclaimer: Major Players sorted in no particular order


Recent Industry Developments
- October 2024: Inspired Pet Nutrition acquired Butcher's Pet Care, expanding its portfolio of premium dog and cat food brands. The acquisition strengthens Inspired Pet's position in the UK market and provides access to Butcher's established retail distribution network and manufacturing capabilities.
- October 2024: Mars Petcare revealed a USD 1 billion investment in digital infrastructure and artificial intelligence to improve direct-to-consumer services. This investment encompasses the expansion of e-commerce platforms, the use of predictive analytics for demand forecasting, and the development of personalized nutrition recommendation systems.
- July 2024: Hill's Pet Nutrition introduced its new MSC (Marine Stewardship Council) certified pollock and insect protein products for pets with sensitive stomachs and skin lines. They contain vitamins, omega-3 fatty acids, and antioxidants.


UK Cat Food Market Report Scope
Food, Pet Nutraceuticals/Supplements, Pet Treats, Pet Veterinary Diets are covered as segments by Pet Food Product. Convenience Stores, Online Channel, Specialty Stores, Supermarkets/Hypermarkets are covered as segments by Distribution Channel.| Food | By Sub Product | Dry Pet Food | By Sub Dry Pet Food | Kibbles |
| Other Dry Pet Food | ||||
| Wet Pet Food | ||||
| Pet Nutraceuticals/Supplements | By Sub Product | Milk Bioactives | ||
| Omega-3 Fatty Acids | ||||
| Probiotics | ||||
| Proteins and Peptides | ||||
| Vitamins and Minerals | ||||
| Other Nutraceuticals | ||||
| Pet Treats | By Sub Product | Crunchy Treats | ||
| Dental Treats | ||||
| Freeze-dried and Jerky Treats | ||||
| Soft & Chewy Treats | ||||
| Other Treats | ||||
| Pet Veterinary Diets | By Sub Product | Derma Diets | ||
| Diabetes | ||||
| Digestive Sensitivity | ||||
| Obesity Diets | ||||
| Oral Care Diets | ||||
| Renal | ||||
| Urinary tract disease | ||||
| Other Veterinary Diets |
| Convenience Stores |
| Online Channel |
| Specialty Stores |
| Supermarkets/Hypermarkets |
| Other Channels |
| By Pet Food Product | Food | By Sub Product | Dry Pet Food | By Sub Dry Pet Food | Kibbles |
| Other Dry Pet Food | |||||
| Wet Pet Food | |||||
| Pet Nutraceuticals/Supplements | By Sub Product | Milk Bioactives | |||
| Omega-3 Fatty Acids | |||||
| Probiotics | |||||
| Proteins and Peptides | |||||
| Vitamins and Minerals | |||||
| Other Nutraceuticals | |||||
| Pet Treats | By Sub Product | Crunchy Treats | |||
| Dental Treats | |||||
| Freeze-dried and Jerky Treats | |||||
| Soft & Chewy Treats | |||||
| Other Treats | |||||
| Pet Veterinary Diets | By Sub Product | Derma Diets | |||
| Diabetes | |||||
| Digestive Sensitivity | |||||
| Obesity Diets | |||||
| Oral Care Diets | |||||
| Renal | |||||
| Urinary tract disease | |||||
| Other Veterinary Diets | |||||
| By Distribution Channel | Convenience Stores | ||||
| Online Channel | |||||
| Specialty Stores | |||||
| Supermarkets/Hypermarkets | |||||
| Other Channels | |||||


Market Definition
- FUNCTIONS - Pet foods are usually intended to provide complete and balanced nutrition to the pet but are primarily used as functional products. The scope includes the food and supplements consumed by pets including veterinary diets. Supplements/nutraceuticals that are directly supplied to pets are considered within the scope.
- RESELLERS - Companies engaged in reselling of pet food without value addition have been excluded from the market scope, in order to avoid double counting.
- END CONSUMERS - Pet owners are considered to be the end-consumers in the market studied.
- DISTRIBUTION CHANNELS - Supermarkets/hypermarkets, specialty stores, convenience stores, online channels and other channels are considered within the scope. The stores which are exclusively providing pet related basic and custom products are considered within the scope of specialty stores.
| Keyword | Definition |
|---|---|
| Pet Food | The scope of pet food includes the food that is eatable by pets including food, treats, veterinary diets, and nutraceuticals/supplements. |
| Food | Food is animal feed intended for consumption by pets. It is formulated to provide essential nutrients and meet the dietary needs of various types of pets, including dogs, cats, and other animals. These are generally segmented into dry and wet pet foods. |
| Dry Pet Food | Dry pet foods may be extruded/baked (kibbles) or flaked. They have a lower moisture content, typically around 12-20%. |
| Wet Pet Food | Wet pet food, also known as canned pet food or moist pet food, generally has a higher moisture content compared to dry pet food, often ranging from 70-80%. |
| Kibbles | Kibbles are dry, processed pet food in small, bite-sized pieces or pellets. They are specifically formulated to provide balanced nutrition for various domestic animals, such as dogs, cats, and other animals. |
| Treats | Pet Treats are special food items or rewards given to pets, to show affection, and encourage good behavior. They are especially used during training. Pet treats are made from various combinations of meat or meat-derived materials with other ingredients. |
| Dental Treats | Pet dental treats are specialized treats that are formulated to promote good oral hygiene in pets. |
| Crunchy Treats | It is a type of pet treat that has a firm and crispy texture which can be a good source of nutrition for pets. |
| Soft and chewy treats | Soft and Chewy pet treats are a type of pet food product that is formulated to be easy to chewy and digest. They are usually made from soft and pliable ingredients, such as meat, poultry, or vegetables, that have been blended and formed into bite-sized pieces or strips. |
| Freeze-dried & Jerky Treats | Freeze-dried and jerky treats are snacks given to pets, that are prepared through a special preservation process, without damaging the nutritional content, resulting in long-lasting, nutrient-rich treats. |
| Urinary Tract Disease Diets | These are commercial diets that are specifically formulated to promote urinary health and reduce the risk of urinary tract infections and other urinary problems. |
| Renal Diets | These are specialized pet foods formulated to support the health of pets with kidney disease or renal insufficiency. |
| Digestive Sensitivity Diets | Digestive-sensitive diets are specially formulated to meet the nutritional needs of pets with digestive issues such as food intolerances, allergies, and sensitivities. These diets are designed to be easily digestible and to reduce the symptoms of digestive problems in pets. |
| Oral Care Diets | Oral care diets for pets are specially formulated diets produced to promote oral health and hygiene in pets. |
| Grain-Free Pet Food | Pet food that does not contain common grains like wheat, corn, or soy. Grain-free diets are often preferred by pet owners seeking alternative options or if their pets have specific dietary sensitivities. |
| Premium Pet Food | High-quality pet food formulated with superior ingredients often offers additional nutritional benefits compared to standard pet food. |
| Natural Pet Food | Pet food made from natural ingredients, with minimal processing and without artificial preservatives. |
| Organic Pet Food | Pet food is produced using organic ingredients, free from synthetic pesticides, hormones, and genetically modified organisms (GMOs). |
| Extrusion | A manufacturing process used to produce dry pet food, where ingredients are cooked, mixed, and shaped under high pressure and temperature. |
| Other Pets | Other pets include birds, fish, rabbits, hamsters, ferrets, and reptiles. |
| Palatability | The taste, texture, and aroma of pet food influence its appeal and acceptance by pets. |
| Complete and Balanced Pet Food | Pet food that provides all essential nutrients in appropriate proportions to meet the nutritional needs of pets without additional supplementation. |
| Preservatives | These are the substances that are added to pet food to extend its shelf life and prevent spoilage. |
| Nutraceuticals | Food products that offer health benefits beyond basic nutrition, often contain bioactive compounds with potential therapeutic effects. |
| Probiotics | Live beneficial bacteria that promote a healthy balance of gut flora, supporting digestive health and immune function in pets. |
| Antioxidants | Compounds that help neutralize harmful free radicals in the body, promoting cellular health and supporting the immune system in pets. |
| Shelf-Life | The duration of which pet food remains safe and nutritionally viable for consumption after its production date. |
| Prescription diet | Specialized pet food formulated to address specific medical conditions under veterinary supervision. |
| Allergen | A substance that can cause allergic reactions in some pets, leading to food allergies or sensitivities. |
| Canned food | Wet pet food that is packed in cans and contains higher moisture content than dry food. |
| Limited ingredient diet (LID) | Pet food formulated with a reduced number of ingredients to minimize potential allergens. |
| Guaranteed Analysis | The minimum or maximum levels of certain nutrients present in pet food. |
| Weight management | Pet food designed to help pets maintain a healthy weight or support weight loss efforts. |
| Other Nutraceuticals | It includes prebiotics, antioxidants, digestive fiber, enzymes, essential oils and herbs. |
| Other Veterinary Diets | It includes weight management diets, skin and coat health, cardiac care, and joint care. |
| Other Treats | It includes rawhides, mineral blocks, lickables, and catnips. |
| Other Dry Foods | It includes cereal flakes, mixers, meal toppers, freeze-dried foods, and air-dried foods. |
| Other Animals | It includes birds, fish, reptiles, and small animals (rabbits, ferrets, hamsters). |
| Other Distribution Channels | It includes veterinary clinics, local unregulated stores, and feed and farm stores. |
| Proteins and Peptides | Proteins are large molecules composed of basic units called amino acids which help in the growth and development of pets. Peptides are the short string of 2 to 50 amino acids. |
| Omega-3 fatty acids | Omega-3 fatty acids are essential polyunsaturated fats that play a crucial role in the overall health and well-being of Pets |
| Vitamins | Vitamins are the essential organic compounds that are essential for vital physiological functioning. |
| Minerals | Minerals are naturally occurring inorganic substances that are essential for various physiological functions in pets. |
| CKD | Chronic Kidney Disease |
| DHA | Docosahexaenoic Acid |
| EPA | Eicosapentaenoic Acid |
| ALA | Alpha-linolenic Acid |
| BHA | Butylated Hydroxyanisol |
| BHT | Butylated Hydroxytoluene |
| FLUTD | Feline Lower Urinary Tract Disease |


Research Methodology
Mordor Intelligence follows a four-step methodology in all our reports.
- Step-1: IDENTIFY KEY VARIABLES: In order to build a robust forecasting methodology, the variables and factors identified in Step-1 are tested against available historical market numbers. Through an iterative process, the variables required for market forecast are set and the model is built on the basis of these variables.
- Step-2: Build a Market Model: Market-size estimations for the forecast years are in nominal terms. Inflation is not a part of the pricing, and the average selling price (ASP) is kept constant throughout the forecast period.
- Step-3: Validate and Finalize: In this important step, all market numbers, variables and analyst calls are validated through an extensive network of primary research experts from the market studied. The respondents are selected across levels and functions to generate a holistic picture of the market studied.
- Step-4: Research Outputs: Syndicated Reports, Custom Consulting Assignments, Databases & Subscription Platforms


