Market Overview
| Study Period | 2021 - 2031 |
|---|---|
| Forecast Data Period | 2026 - 2031 |
| Historical Data Period | 2021 - 2024 |
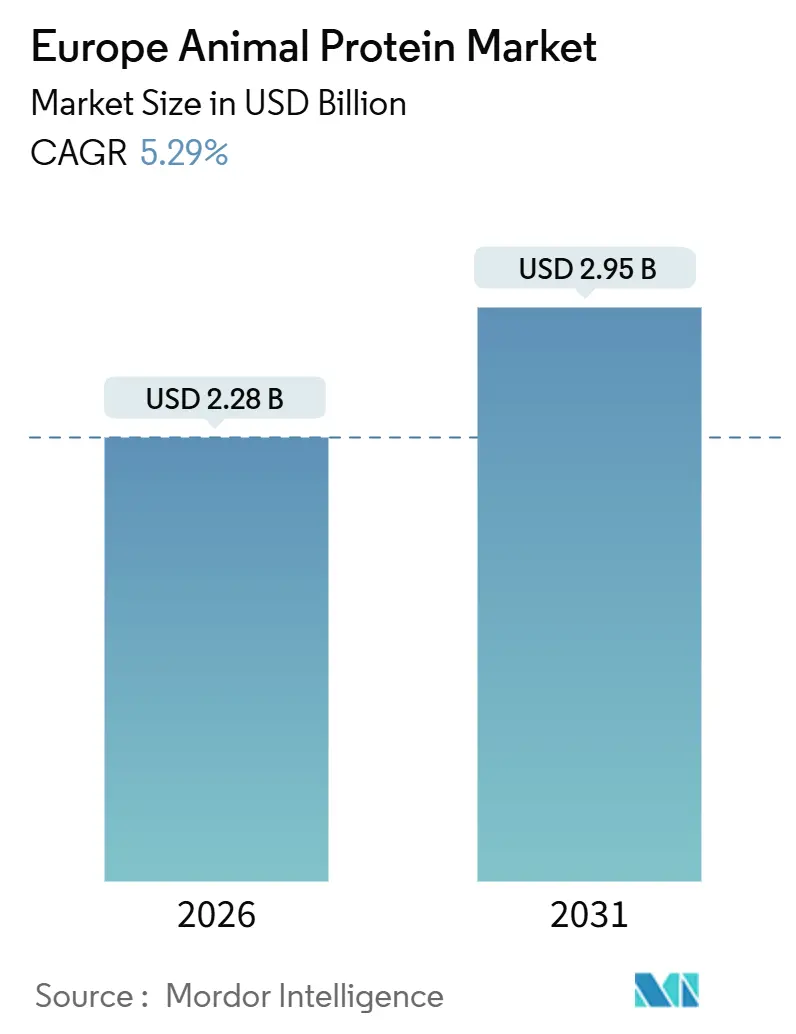
| Market Size (2026) | USD 2.28 Billion |
| Market Size (2031) | USD 2.95 Billion |
| Growth Rate (2026 - 2031) | 5.29% CAGR |
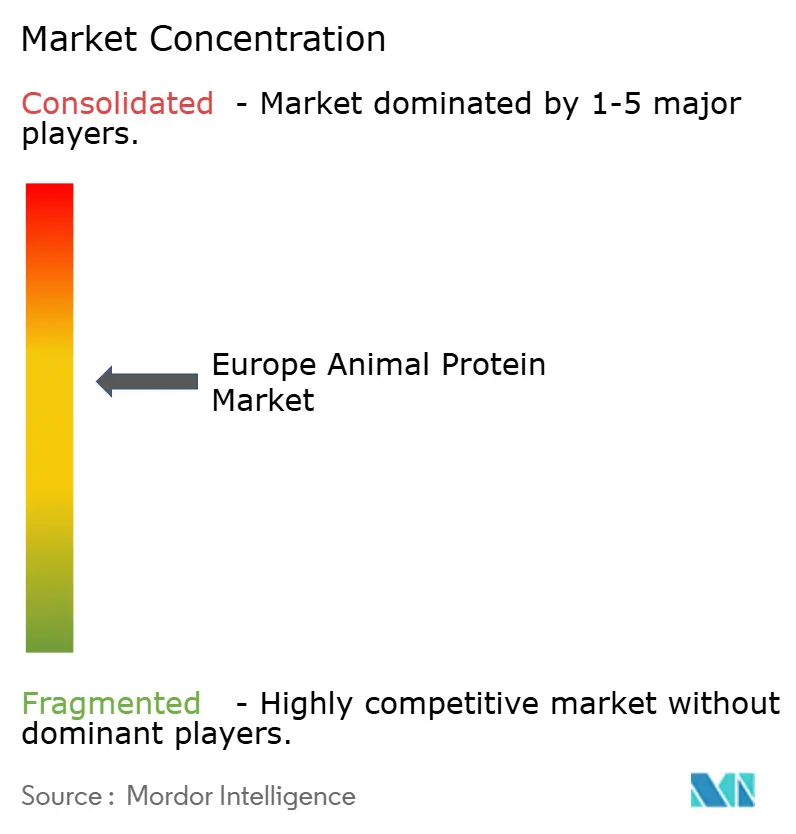
| Market Concentration | Medium |
Major Players*Disclaimer: Major Players sorted in no particular order Image © Mordor Intelligence. Reuse requires attribution under CC BY 4.0. | |
Europe Animal Protein Market Analysis by Mordor Intelligence
The Europe animal protein market size is valued at USD 2.28 billion in 2026 and is projected to reach USD 2.95 billion by 2031, reflecting a 5.29% CAGR over 2026-2031. This momentum is driven by the region's aging demographic, a surge in fitness-centric lifestyles, and clearer regulations on health claims. These factors are elevating animal proteins from mere commodities to key players in precision nutrition. However, a notable shift towards plant-based diets among consumers, coupled with stricter environmental regulations, is prompting manufacturers to rethink their procurement and product development strategies. In response, top suppliers are pivoting towards higher-margin offerings like whey isolates, bioactive collagen peptides, and premium organic variants, all of which come with enhanced pricing power. Furthermore, there's a noticeable uptick in investments targeting AI-driven traceability and technologies aimed at reducing methane emissions. This trend underscores the growing importance of sustainability as a competitive edge in the European animal protein landscape.
Key Report Takeaways
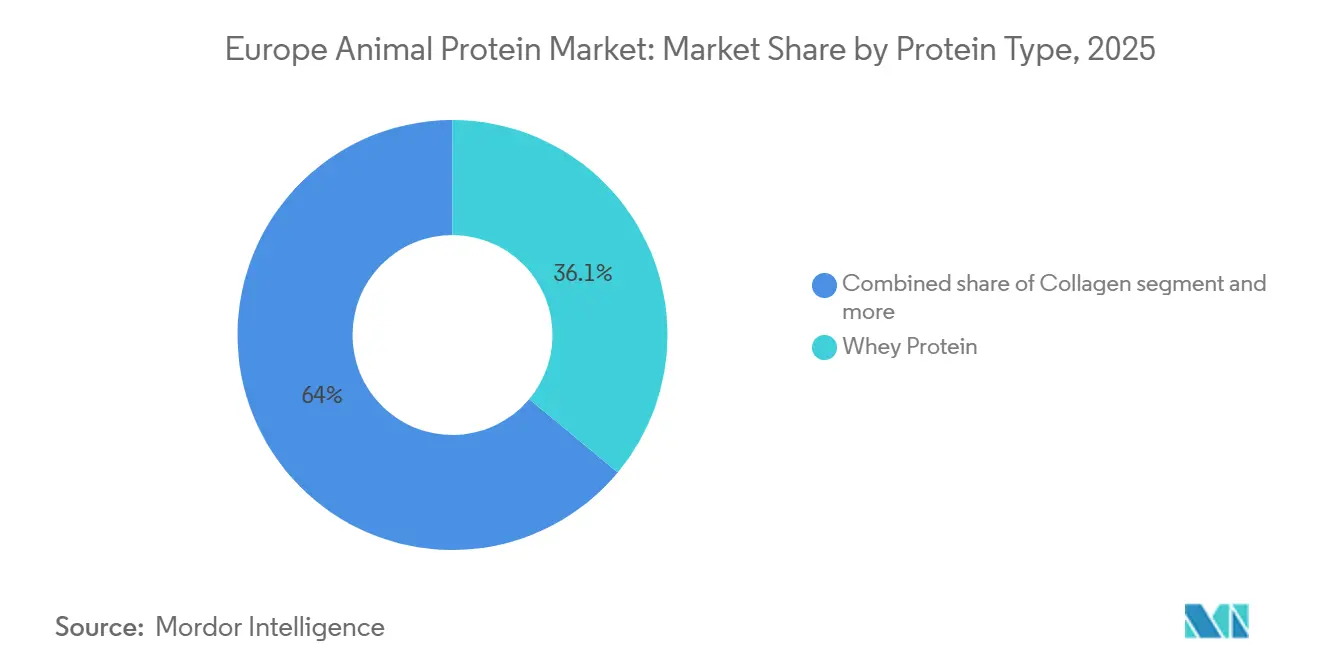
- By protein type, whey protein held 36.05% of the Europe animal protein market share in 2025, while collagen is forecast to expand at a 6.80% CAGR through 2031.
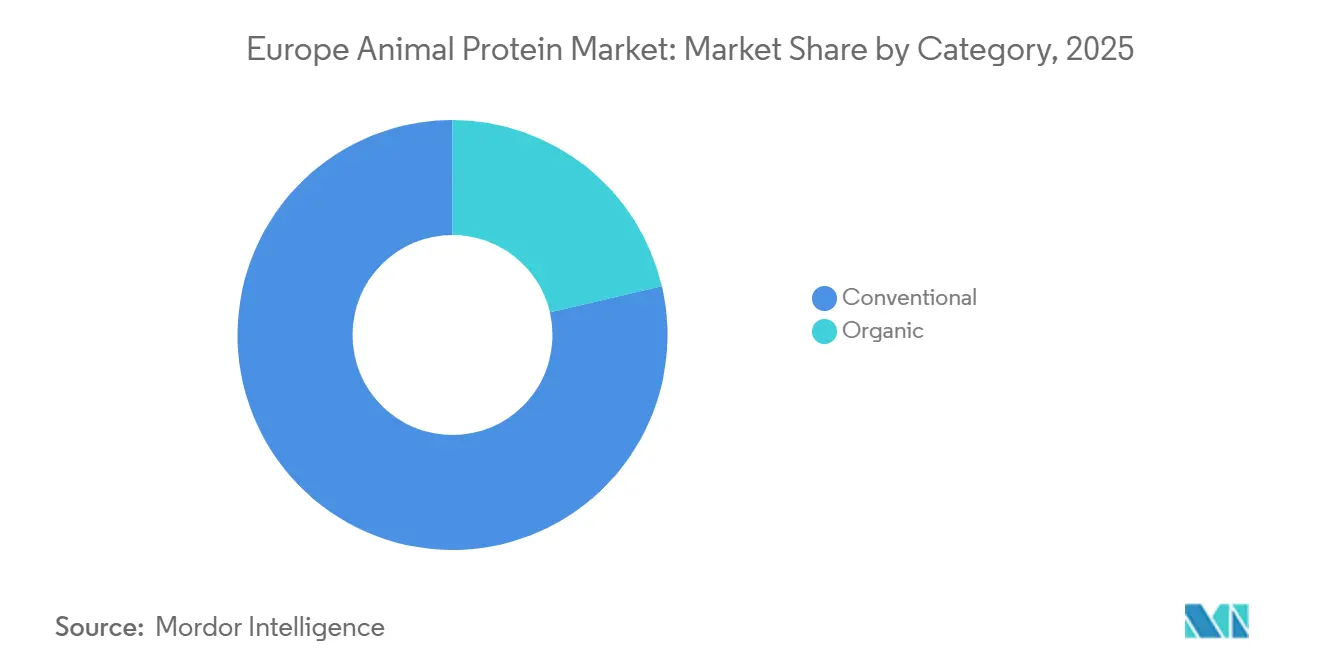
- By category, the conventional segment accounted for 78.64% of the Europe animal protein market size in 2025; organic offerings are projected to register a 7.01% CAGR between 2026-2031.
- By end user, food and beverages commanded 78.91% of demand in 2025, whereas personal care and cosmetics are expected to post the fastest growth, advancing at an 8.02% CAGR to 2031.
- By geography, Germany accounted for 31.19% of the Europe animal protein market size in 2025, while the Netherlands is projected to register a 5.92% CAGR between 2026-2031.
Note: Market size and forecast figures in this report are generated using Mordor Intelligence’s proprietary estimation framework, updated with the latest available data and insights as of January 2026.
Europe Animal Protein Market Trends and Insights
Drivers Impact Analysis*
| Driver | (~) % Impact on CAGR Forecast | Geographic Relevance | Impact Timeline |
|---|---|---|---|
| Expansion of functional and medical nutrition | +1.2% | EU-wide, with concentration in Germany, France, the Netherlands, Nordic region | Medium term (2-4 years) |
| Adoption of artificial intelligence and precision farming | +0.8% | Netherlands, Denmark, Germany; pilot deployments in France, Ireland | Long term (≥ 4 years) |
| Beauty-from-within and nutricosmetics | +1.5% | France, Germany, the United Kingdom, Italy; spillover to Benelux and Nordics | Short term (≤ 2 years) |
| Sustainability-driven protein transition | +0.6% | Netherlands, Nordic countries, Germany; EU policy-driven harmonization | Medium term (2-4 years) |
| Growth of sports nutrition culture | +1.0% | Germany, the United Kingdom, France, the Nordic countries, and emerging in Southern Europe | Short term (≤ 2 years) |
| Preference for clean-label and natural ingredients | +0.9% | EU-wide, strongest in Germany, France, the Netherlands, and the United Kingdom | Medium term (2-4 years) |
| Source: Mordor Intelligence | |||


Expansion of functional and medical nutrition
As demographics age and chronic diseases become more prevalent, the demand for protein is shifting. No longer are bulk commodity ingredients the focus; instead, there's a growing emphasis on clinically validated formulations targeting sarcopenia, wound healing, and metabolic health. In 2024, the European Food Safety Authority (EFSA) assessed collagen hydrolysate for joint health. They set a daily intake threshold at 10 grams, paving a regulatory path for medical foods that can sidestep the lengthy timelines of traditional pharmaceutical approvals. In the realm of elderly nutrition, where age diminishes muscle protein synthesis efficiency, whey protein isolates enriched with leucine are becoming increasingly popular. In 2025, Arla Foods Ingredients introduced Lacprodan ALPHA-10, a whey fraction boasting 10% alpha-lactalbumin, designed to bolster immune function during post-surgical recovery. Highlighting the importance of this trend, the European Commission's Horizon Europe work programme earmarked EUR 150 million for 2025, emphasizing personalized nutrition research[1]Source: European Commission, “Horizon Europe Work Programme 2025,” europa.eu. A key focus is on bioavailability studies of animal-derived proteins, especially for vulnerable populations. With this blend of regulatory clarity, clinical backing, and public investment, animal proteins are transitioning from mere ingredients to precision nutrition tools. This shift is particularly pronounced in markets where healthcare systems recognize and reimburse medical foods.
Adoption of artificial intelligence and precision farming
Data-driven livestock management is tackling both cost and environmental challenges in animal protein production by reducing feed-conversion ratios and emissions intensity. The European Parliament's 2024 briefing on digitalization in agriculture spotlighted IoT-enabled monitoring systems. These systems have successfully reduced methane emissions per kilogram of milk protein by 8-12% through optimized feeding schedules and early disease detection[2]Source: European Parliament, “Digitalisation in Agriculture,” europarl.europa.eu. In its 2024 report, the Joint Research Centre noted 37 pilot projects across the EU harnessing machine learning for predictive health analytics in dairy herds. Notably, the Netherlands and Denmark are at the forefront of this adoption, thanks to their cooperative-scale investment capacity. Meanwhile, AgriDataValue, an initiative backed by the EU, is crafting interoperable data platforms. These platforms empower whey processors to trace protein quality metrics directly to individual farms, facilitating premium pricing for milk with a low somatic cell count. The message is unmistakable: producers embracing AI-driven traceability and emissions monitoring stand to gain price premiums in B2B markets, especially in sectors like infant formula and medical nutrition, where sourcing faces heightened regulatory scrutiny.
Beauty-from-within and nutricosmetics
Driven by clinical trials showcasing tangible enhancements in skin elasticity and hydration, collagen peptides are transitioning from topical cosmetics to ingestible formats. In a 2024 double-blind study published in the Journal of Cosmetic Dermatology, GELITA's Verisol, a specialized blend of collagen peptides, demonstrated a notable 20% boost in skin elasticity after just 8 weeks. This finding has led to Verisol's adoption in premium beauty supplements throughout France and Germany. In response to the surging demand for fish-derived collagen, especially in regions where bovine or porcine sources are met with religious or ethical reservations, Rousselot has channeled a significant EUR 26 million investment into a marine collagen peptides unit at its facility in Angoulême, France. While EU Regulation 1223/2009 on cosmetic products prohibits animal testing and places restrictions on certain animal-derived materials, collagen peptides sourced from controlled and traceable supply chains not only remain compliant but are also increasingly marketed with sustainability certifications. The nutricosmetics segment is poised to outpace traditional food applications in growth, largely due to its 3-4 times higher profit margins and its allure to affluent consumers. These consumers are willing to invest in clinically validated beauty benefits, signaling a strategic shift for collagen producers aiming to break free from commodity pricing.
Sustainability-driven protein transition
While government dietary guidelines advocate for reduced animal protein intake, this pivot opens doors for high-quality, low-emission animal proteins that enhance, rather than overshadow, plant-based diets. In 2024, the Netherlands adjusted its dietary guidelines, capping red meat consumption at 300 grams weekly[3]Source: Government of the Netherlands, “Dutch Dietary Guidelines 2024,” government.nl . However, it upheld recommendations for dairy proteins, underscoring new findings that whey and casein are more effective for muscle maintenance in older adults. The European Commission's agricultural forecast for 2024-2035 anticipates a 5% dip in beef production, yet dairy output remains steady. This stability suggests a continued robust supply of whey protein, even as meat consumption wanes. Concluding in September 2024, the EU's Strategic Dialogue on Agriculture advocated for a "sustainable intensification" of dairy systems, emphasizing precision feeding and manure management. This endorsement hints at a policy tilt towards emissions-efficient animal proteins, rather than a complete overhaul. Such a nuanced stance empowers dairy cooperatives to market whey and casein as "sustainable animal proteins" in flexitarian diets, contingent on meeting rigorous traceability and carbon-footprint standards.
Restraints Impact Analysis*
| Restraint | (~) % Impact on CAGR Forecast | Geographic Relevance | Impact Timeline |
|---|---|---|---|
| Aggressive meat reduction trends | -0.9% | Netherlands, Nordic countries, Germany; policy-driven across the EU | Medium term (2-4 years) |
| Stringent animal welfare mandates | -0.7% | EU-wide, with stricter implementation in Germany, Austria, Netherlands | Long term (≥ 4 years) |
| Environmental and methane regulations | -0.8% | EU-wide, with focus on intensive livestock regions (Netherlands, Denmark, Ireland) | Medium term (2-4 years) |
| Surge in smart protein competition | -1.1% | The United Kingdom, Netherlands, Germany, France; venture-capital-driven innovation hubs | Short term (≤ 2 years) |
| Source: Mordor Intelligence | |||
Aggressive meat reduction trends
In Northern Europe, flexitarian diets and revisions to official dietary guidelines are leading to a decline in per-capita animal protein consumption. The European Commission's agricultural outlook for 2024-2035 forecasts a drop of 1.2 kilograms in per capita beef consumption by 2030. While poultry may help cushion this decline, the overall trend points to a decrease in animal protein intake. In 2024, Germany's per capita meat consumption hit a three-decade low at 52 kilograms. This shift is largely attributed to younger generations leaning towards plant-forward diets and initiatives like meat-free days in public canteens in cities such as Berlin, as reported by Germany's Federal Ministry of Food and Agriculture. The Health Council of the Netherlands notes a notable change in the 2024 dietary guidelines, which now advocate for animal protein to constitute only 40% of total protein intake. This marks a departure from earlier guidelines that viewed animal and plant proteins as equals. These evolving dietary preferences are having a pronounced impact on commodity markets for eggs and casein. Here, generic products find themselves in direct competition with plant-based alternatives. In contrast, specialized proteins tailored for medical nutrition and sports performance enjoy a protective buffer, thanks to their enhanced amino acid profiles and clinical endorsements.
Stringent animal welfare mandates
In March 2024, the European Commission reactivated the EU Platform on Animal Welfare, underscoring a renewed political commitment. This commitment aims to revise Directives 98/58/EC (pertaining to farm animals), 1999/74/EC (focused on laying hens), and 2008/120/EC (related to pigs), with draft proposals anticipated by 2026. According to the European Parliament, industry estimates indicate that adhering to the proposed standards, such as transitioning to cage-free housing, reducing stocking densities, and bolstering veterinary oversight, could lead to a 10-15% uptick in production costs for intensive systems. This surge in costs threatens to squeeze margins for commodity protein ingredients. Notably, Germany and Austria have set national welfare standards that surpass the EU's baseline, resulting in a bifurcated market. Here, premium-certified proteins enjoy price premiums, yet smaller producers in Southern and Eastern Europe grapple with capital limitations, hindering their ability to upgrade facilities, as highlighted by Germany's Federal Ministry of Food and Agriculture. A strategic concern emerges: as welfare-induced cost hikes mount, there's a potential acceleration towards plant-based and fermentation proteins, especially in price-sensitive sectors like processed meats and baked goods. Conversely, premium segments, including infant formula and medical nutrition, might absorb these costs, thanks to their premium market positioning.
*Our forecasts treat driver/restraint impacts as directional, not additive. The impact forecasts reflect baseline growth, mix effects, and variable interactions.
Segment Analysis
By Protein Type: Collagen Outpaces Whey in Growth Trajectory
In 2025, whey protein held a 36.05% market share, solidifying its position in sports nutrition, infant formulas, and clinical nutrition. Collagen is projected to grow at a 6.80% CAGR through 2031, driven by its use in beauty supplements and joint-health applications supported by clinical evidence. GELITA's Verisol collagen peptides showed a 20% improvement in skin elasticity in a 2024 randomized controlled trial, leading to adoption in premium nutricosmetics brands in France and Germany, as reported by the Journal of Cosmetic Dermatology. Rousselot's SiMoGel platform offers customized collagen peptide profiles for specific health benefits, such as Type II collagen for cartilage support and marine collagen for halal and kosher markets, marking a shift from commodity gelatin to specialized bioactive ingredients. Casein and its derivatives cater to niche applications in cheese analogs and medical foods requiring slow-release protein, while milk protein concentrates are gaining traction in high-protein dairy products and ready-to-eat meals, where clean-label declarations favor "milk protein" over fractionated ingredients. Egg protein faced challenges in 2024 due to avian influenza outbreaks disrupting European supplies, leading to price hikes and increased use of whey or pea protein in bakery and confectionery products, according to the European Food Safety Authority.
Insect protein faces a credibility crisis after Ÿnsect's judicial liquidation in December 2025, despite raising over USD 600 million and securing EU Novel Food approvals for Tenebrio molitor (mealworm) larvae. Protix secured a EUR 37 million European Investment Bank loan in January 2024 for a Poland production facility focused on animal feed, reflecting a pivot toward applications with lower price sensitivity and fewer regulatory hurdles. EU Regulation 2015/2283 on novel foods requires extensive safety dossiers for each insect species and processing method, creating a lengthy approval timeline favoring established players with regulatory expertise. Gelatin, traditionally a by-product of meat processing, is benefiting from pharmaceutical demand for capsule shells and gummy vitamins. EU Regulation 2016/355, which sets hygiene standards, prioritizes traceable, BSE-tested supply chains over low-cost imports. The protein market is bifurcating into high-margin, clinically validated ingredients like collagen and whey isolates, and commodity proteins such as casein and gelatin, where differentiation increasingly depends on traceability and sustainability certifications rather than functional performance.


By Category: Organic Premium Justifies Cost Gap
In 2025, conventional animal proteins held a dominant 78.64% market share, buoyed by cost advantages and established supply chains. However, organic proteins are projected to outpace the overall market, growing at a 7.01% CAGR through 2031, driven by retailers' expansion of certified-organic private-label ranges. Under EU Regulation 2018/848, organic dairy cattle must have pasture access and routine antibiotic use is prohibited. While this raises production costs, it also allows for retail price premiums that more than compensate for the cost differential. The EIT Food Trust Report 2024 highlighted that 68% of European consumers are ready to pay a 15-20% premium for animal proteins boasting verified welfare and environmental certifications. This trend bolsters the business case for organic whey and casein, even with their lower yields. In 2024, Germany topped the charts in organic dairy protein consumption, with organic milk making up 14% of its total milk production. Austria followed closely at 22%, and France at 8%. These figures, sourced from Germany's Federal Ministry of Food and Agriculture, underscore the influence of policy support and consumer readiness to invest in perceived quality and sustainability.
Conventional proteins continue to dominate cost-sensitive sectors like animal feed, bakery fortification, and industrial food processing. In these areas, functional performance and price predictability take precedence over sustainability credentials. Strategically, this means organic growth will be concentrated in high-value segments. Areas like infant formula, medical nutrition, and premium sports supplements, where regulatory scrutiny and consumer expectations validate the cost premium, will see organic proteins flourish. Meanwhile, conventional proteins will maintain their foothold in bulk applications, leveraging economies of scale and long-term supply contracts. This category split also highlights geographic disparities. Northern Europe, bolstered by policy incentives and cultural inclinations, is driving the organic demand. In contrast, Southern and Eastern Europe lean towards conventional options, influenced by lower per-capita incomes and a less mature organic retail infrastructure.
By End User: Personal Care Redefines Protein Applications
In 2025, food and beverages dominated the market with a 78.91% share, covering dairy alternatives, ready-to-eat meals, snacks, and beverages. However, personal care and cosmetics, driven by collagen peptides in beauty products, are projected to grow at an 8.02% CAGR through 2031. While EU Regulation 1223/2009 prohibits animal testing and limits certain animal-derived materials in cosmetics, collagen peptides from traceable supply chains remain compliant and are marketed with sustainability certifications. In France and Germany, the "beauty-from-within" trend is gaining momentum. Clinical trials showing skin elasticity improvements have elevated ingestible collagen from a dietary supplement to a cosmeceutical, justifying premium pricing and pharmacy distribution. Supplements, including baby food, infant formula, elderly nutrition, medical nutrition, and sports performance, are the second-largest end-user segment. Infant formula faces stringent EU regulations emphasizing protein quality and amino acid profiles, favoring whey and casein over plant-based options.
Animal feed applications are growing modestly, driven by insect protein approvals for aquaculture and poultry feed. Protix's black soldier fly larvae offer a sustainable alternative to fishmeal and soy. The European Commission's "Farm to Fork" strategy supports insect protein in animal feed as a circular-economy solution to food waste, creating favorable policies for producers achieving cost parity with conventional feed proteins. Food and beverage trends vary: dairy and alternatives use whey and casein for protein fortification, while ready-to-eat and ready-to-cook products use hydrolyzed collagen for texture and clean-label appeal. Bakeries favor egg white protein for aeration and structure, though avian influenza in 2024 prompted some to substitute whey protein isolates. The segmentation highlights a market where traditional food applications face plant-based competition, while personal care and specialized nutrition sectors enjoy higher margins and insulation from commodity price volatility.
Geography Analysis
In Europe, the animal protein market is notably concentrated. Germany, France, and the Netherlands lead in whey and casein production, thanks to established dairy cooperatives and their closeness to manufacturers of sports nutrition and infant formulas. In 2024, Germany, holding a dominant market share of 31.19%, produced 33 million tonnes of milk. This production, especially with large-scale whey protein extraction during cheese production, grants German processors cost efficiencies that smaller nations find hard to achieve, as highlighted by Germany's Federal Ministry of Food and Agriculture. France, capitalizing on its beef and pork processing infrastructure, spearheads collagen and gelatin production. This allows the country to provide pharmaceutical-grade gelatin for capsules and gummy vitamins. Notably, Rousselot's Angoulême facility has emerged as a global center for marine collagen peptides. The Netherlands, witnessing a growth rate of 5.92% CAGR, is at the forefront of precision livestock management. Over 60% of its dairy farms now utilize IoT sensors for real-time milk quality monitoring. This innovation not only reduces somatic cell counts but also commands premium pricing for whey protein intended for infant formulas, a strategy backed by Wageningen University. Meanwhile, Nordic nations, Denmark, Sweden, Finland, and Norway, are adjusting dietary guidelines. They're curbing red meat consumption but upholding recommendations for dairy proteins. This approach stabilizes demand for whey and casein, even as beef production sees a downturn, a move endorsed by the Nordic Council of Ministers.
In Southern Europe, Italy and Spain are ramping up organic dairy production, catering to the premium cheese and yogurt sectors. As a result, organic whey, a by-product, is increasingly being exported to Northern European brands in sports nutrition, all in pursuit of certified-organic ingredients. Eastern Europe, with nations like Poland and Romania, is becoming a hotspot for insect protein production. Their allure lies in lower labor costs and accessible industrial sites. For instance, Protix's facility in Poland is eyeing animal feed applications across the expansive EU market. The UK, navigating its post-Brexit landscape, has charted a course distinct from EU norms. By fast-tracking approvals for cultivated meat and novel proteins, the UK has intensified competition, urging continental producers to hasten their innovations or risk ceding ground to fermentation-derived alternatives.
Ireland stands at a crossroads. With its economy heavily reliant on dairy, it grapples with EU methane regulations. These could mandate herd reductions or push for expensive emissions-mitigation technologies. Such constraints might limit whey protein supplies from this historically dependable exporter. Overall, the geographic landscape paints a vivid picture: Northern Europe champions the demand for premium, sustainable proteins; Western Europe is the nucleus of production infrastructure; and Eastern Europe is carving its niche as a cost-effective manufacturing hub for novel proteins. Adding to this dynamic is the regulatory schism between the UK and EU, presenting lucrative arbitrage opportunities for nimble market players.
Competitive Landscape
Top Companies in Europe Animal Protein Market
The Europe animal protein market is seeing a trend towards consolidation. Dairy cooperatives like Arla, FrieslandCampina, and Lactalis dominate the supply of whey and casein. Meanwhile, specialized processors such as GELITA, Rousselot, and Weishardt, who are vertically integrated from slaughter to bioactive peptides, are central to collagen and gelatin production. Tirlán's strategic move, investing EUR 126 million in a whey processing facility in Ballyragget, Ireland, was announced in November 2025, with commissioning set for mid-2027. This investment underscores Tirlán's focus on high-value whey protein isolates, catering to the infant formula and sports nutrition markets, steering clear of the commodity whey powder sector, which has seen its margins squeezed by Chinese competition. Glanbia, in a notable shift, acquired Flavor Producers for USD 299.7 million in April 2024, pivoting its portfolio towards value-added taste solutions. Concurrently, its joint venture, Southwest Cheese in New Mexico, is ramping up, adding 4,500 tonnes of whey protein isolate capacity by 2027, with an eye on the U.S. and European sports nutrition markets. Kerry Group, in a strategic maneuver, divested 70% of Kerry Dairy Ireland for an enterprise value of EUR 500 million, finalizing the deal in January 2025. This move signifies Kerry's departure from the commodity dairy realm, redirecting its focus towards taste and nutrition ingredients, emphasizing a strategic shift away from low-margin protein commodities.
Emerging opportunities lie in fermentation-derived animal proteins. Companies like Perfect Day are pioneering the production of whey and casein without the use of livestock. In the realm of marine collagen, Rousselot's EUR 26 million investment in Angoulême is strategically targeting halal, kosher, and pescatarian consumers who prefer alternatives to bovine or porcine collagen. The future of insect protein hangs in the balance following Ÿnsect's downfall. However, Protix's EUR 37 million loan from the European Investment Bank for its expansion in Poland highlights a more promising avenue: animal feed applications. This route appears more feasible than direct human consumption, which grapples with significant taste and price challenges.
The competitive landscape is witnessing a technological divide. Large cooperatives, harnessing AI-driven traceability and emissions monitoring, are reaping premium rewards in sectors like infant formula and medical nutrition. In contrast, smaller processors, unable to invest in digitalization, face the dual threats of commoditization or acquisition. EU Regulation 2016/355, governing gelatin and collagen hygiene, imposes rigorous traceability and BSE-testing mandates. These regulations inadvertently bolster vertically integrated producers with robust supply chain controls, erecting hurdles for newcomers and intensifying competition against imports.
Europe Animal Protein Industry Leaders
Agrial Enterprise
Arla Foods amba
Darling Ingredients Inc.
Koninklijke FrieslandCampina NV
SAS Gelatines Weishardt
- *Disclaimer: Major Players sorted in no particular order

Recent Industry Developments
- November 2025: Tirlán announced a EUR 126 million investment in a whey processing facility at Ballyragget, Ireland, scheduled for commissioning in mid-2027. The plant will produce whey protein isolates and concentrates for infant formula and sports nutrition, targeting high-value applications where Ireland's grass-fed dairy positioning commands premiums.
- December 2024: Agroloop opened a USD 31.5 million, 139,931-square-foot automated industrial-scale insect protein processing plant in Hungary. The facility processes 120 tonnes of food byproducts daily into animal feed ingredients, including 250 tonnes of protein meal and 50 tonnes of fat annually.
- November 2024: Arla Foods Ingredients launched Lacprodan HYDRO.Power, a specialized whey protein produced through a proprietary controlled-hydrolysis process. This production development allows for high-protein content in clear, acidic beverages without the traditional bitterness associated with hydrolyzed proteins.


Europe Animal Protein Market Report Scope
Animal protein is defined both scientifically and industrially as high-quality protein derived from animal tissues and fluids. The Europe animal protein market is segmented by protein type, category, and end user. By protein type, the market is segmented into casein and caseinates, collagen, egg protein, gelatin, insect protein, milk protein, whey protein, and other animal protein. By category, the market is segmented into conventional and organic. By end user, the market is segmented into animal feed, food and beverages, personal care and cosmetics, and supplements. The food and beverages segment is further sub-segmented into bakery, beverages, breakfast cereals, condiments/sauces, confectionery, dairy and dairy alternative products, RTE/RTC food products, and snacks. Similarly, the supplements segment is further sub-segmented into Baby Food and infant formula, elderly nutrition and medical nutrition, and sport/performance nutrition. The Market forecasts are provided in terms of value (USD) and volume (Tons).
Protein Type
| Casein and Caseinates |
| Collagen |
| Egg Protein |
| Gelatin |
| Insect Protein |
| Milk Protein |
| Whey Protein |
| Other Animal Protein |
Category
| Conventional |
| Organic |
End User
| Animal Feed | |
| Food and Beverages | Bakery |
| Beverages | |
| Breakfast Cereals | |
| Condiments/Sauces | |
| Confectionery | |
| Dairy and Dairy Alternative Products | |
| RTE/RTC Food Products | |
| Snacks | |
| Personal Care and Cosmetics | |
| Supplements | Baby Food and Infant Formula |
| Elderly Nutrition and Medical Nutrition | |
| Sport/Performance Nutrition |
Geography
| United Kingdom |
| Germany |
| France |
| Italy |
| Spain |
| Sweden |
| Belgium |
| Poland |
| Netherlands |
| Rest of Europe |
| Protein Type | Casein and Caseinates | |
| Collagen | ||
| Egg Protein | ||
| Gelatin | ||
| Insect Protein | ||
| Milk Protein | ||
| Whey Protein | ||
| Other Animal Protein | ||
| Category | Conventional | |
| Organic | ||
| End User | Animal Feed | |
| Food and Beverages | Bakery | |
| Beverages | ||
| Breakfast Cereals | ||
| Condiments/Sauces | ||
| Confectionery | ||
| Dairy and Dairy Alternative Products | ||
| RTE/RTC Food Products | ||
| Snacks | ||
| Personal Care and Cosmetics | ||
| Supplements | Baby Food and Infant Formula | |
| Elderly Nutrition and Medical Nutrition | ||
| Sport/Performance Nutrition | ||
| Geography | United Kingdom | |
| Germany | ||
| France | ||
| Italy | ||
| Spain | ||
| Sweden | ||
| Belgium | ||
| Poland | ||
| Netherlands | ||
| Rest of Europe | ||


Market Definition
- End User - The Protein Ingredients Market operates on a B2B basis. Food, Beverages, Supplements, Animal Feed, and Personal Care & Cosmetic manufacturers are considered to be end-consumers in the market studied. The scope excludes manufacturers buying liquid/dry whey to be used for application as a binding agent or thickener or other non-protein applications.
- Penetration Rate - Penetration Rate is defined as the percentage of Protein-Fortified End User Market Volume in the Overall End User Market Volume.
- Average Protein Content - Average protein content is the average protein content present per 100 g of product manufactured by all end-user companies considered under the scope of this report.
- End User Market Volume - End-user market volume is the consolidated volume of all types and forms of end-user products in the country or region.
| Keyword | Definition |
|---|---|
| Alpha-lactalbumin (α-Lactalbumin) | It is a protein that regulates the production of lactose in the milk of almost all mammalian species. |
| Amino acid | It is an organic compound that contains both amino and carboxylic acid functional groups, which are required for the synthesis of body protein and other important nitrogen-containing compounds, such as creatine, peptide hormones, and some neurotransmitters. |
| Blanching | It is the process of briefly heating vegetables with steam or boiling water. |
| BRC | British Retail Consortium |
| Bread improver | It is a flour-based blend of several components with specific functional properties designed to modify dough characteristics and give quality attributes to bread. |
| BSF | Black Soldier Fly |
| Caseinate | It is a substance produced by adding an alkali to acid casein, a derivative of casein. |
| Celiac disease | Celiac disease is an immune reaction to eating gluten, a protein found in wheat, barley, and rye. |
| Colostrum | It is a milky fluid that’s released by mammals that have recently given birth before breast milk production begins. |
| Concentrate | It is the least processed form of protein and has a protein content ranging from 40-90% by weight. |
| Dry protein basis | It refers to the percentage of "pure protein" present in a supplement after the water in it is completely removed through heat. |
| Dry whey | It is the product resulting from drying fresh whey which has been pasteurized and to which nothing has been added as a preservative. |
| Egg protein | It is a mixture of individual proteins, including ovalbumin, ovomucoid, ovoglobulin, conalbumin, vitellin, and vitellenin. |
| Emulsifier | It is a food additive that facilitates the blending of foods that are immiscible with one another, such as oil and water. |
| Enrichment | It is the process of addition of micronutrients that are lost during the processing of the product. |
| ERS | Economic Research Service of the USDA |
| Extrusion | It is the process of forcing soft mixed ingredients through an opening in a perforated plate or die designed to produce the required shape. The extruded food is then cut to a specific size by blades. |
| Fava | Also known as Faba, it is another word for yellow split beans. |
| FDA | Food and Drug Administration |
| Flaking | It is a process in which typically a cereal grain (like corn, wheat, or rice) is broken down into grits, cooked with flavors and syrups, and then pressed into flakes between cooled rollers. |
| Foaming agent | It is a food ingredient that makes it possible to form or maintain a uniform dispersion of a gaseous phase in a liquid or solid food. |
| Foodservice | It refers to the part of the food industry which includes businesses, institutions, and companies which prepare meals outside the home. It includes restaurants, school and hospital cafeterias, catering operations, and many other formats. |
| Fortification | It is the deliberate addition of micronutrients that are not found in them naturally or which are lost during processing, to improve a food product's nutritional value. |
| FSANZ | Food Standards Australia New Zealand |
| FSIS | Food Safety and Inspection Service |
| FSSAI | Food Safety and Standards Authority of India |
| Gelling agent | It is an ingredient that functions as a stabilizer and thickener to provide thickening without stiffness through the formation of gel. |
| GHG | Greenhouse Gas |
| Gluten | It is a family of proteins found in grains, including wheat, rye, spelt, and barley. |
| Hemp | It is a botanical class of Cannabis sativa cultivars grown specifically for industrial or medicinal use. |
| Hydrolysate | It is a form of protein manufactured by exposing the protein to enzymes that can partially break the bonds between the protein's amino acids and break down large, complicated proteins into smaller pieces. Its processing makes it easier and quicker to digest. |
| Hypoallergenic | It refers to a substance that causes fewer allergic reactions. |
| Isolate | It is the purest and most processed form of protein which has undergone separation to obtain a pure protein fraction. It typically contains ≥ 90% of protein by weight. |
| Keratin | It is a protein that helps form hair, nails, and the outer layer of skin. |
| Lactalbumin | It is the albumin contained in milk and obtained from whey. |
| Lactoferrin | It is an iron‑binding glycoprotein that is present in the milk of most mammals. |
| Lupin | It is the yellow legume seeds of the genus Lupinus. |
| Millenial | Also known as Generation Y or Gen Y, it refers to the people born from 1981 to 1996. |
| Monogastric | It refers to an animal with a single-compartmented stomach. Examples of monogastric include humans, poultry, pigs, horses, rabbits, dogs, and cats. Most monogastric are generally unable to digest much cellulose food materials such as grasses. |
| MPC | Milk protein concentrate |
| MPI | Milk protein isolate |
| MSPI | Methylated soy protein isolate |
| Mycoprotein | Mycoprotein is a form of single-cell protein, also known as fungal protein, derived from fungi for human consumption. |
| Nutricosmetics | It is a category of products and ingredients that act as nutritional supplements to care for skin, nails, and hair natural beauty. |
| Osteoporosis | It is a medical condition in which the bones become brittle and fragile from loss of tissue, typically as a result of hormonal changes, or deficiency of calcium or vitamin D. |
| PDCAAS | Protein digestibility-corrected amino acid score (PDCAAS) is a method of evaluating the quality of a protein based on both the amino acid requirements of humans and their ability to digest it. |
| Per-capita consumption of animal protein | It is the average amount of animal protein (such as milk, whey, gelatin, collagen, and egg proteins) that is readily available for consumption by each person in an actual population. |
| Per-capita consumption of plant protein | It is the average amount of plant protein (such as soy, wheat, pea, oat, and hemp proteins) that is readily available for consumption by each person in an actual population. |
| Quorn | It is a microbial protein manufactured using mycoprotein as an ingredient, in which the fungus culture is dried and mixed with egg albumen or potato protein, which acts as a binder, and then is adjusted in texture and pressed into various forms. |
| Ready-to-Cook (RTC) | It refers to food products that include all of the ingredients, where some preparation or cooking is required through a process that is given on the package. |
| Ready-to-Eat (RTE) | It refers to a food product prepared or cooked in advance, with no further cooking or preparation required before being eaten. |
| RTD | Ready-to-Drink |
| RTS | Ready-to-Serve |
| Saturated fat | It is a type of fat in which the fatty acid chains have all single bonds. It is generally considered unhealthy. |
| Sausage | It is a meat product made of finely chopped and seasoned meat, which may be fresh, smoked, or pickled and which is then usually stuffed into a casing. |
| Seitan | It is a plant-based meat substitute made out of wheat gluten. |
| Softgel | It is a gelatin-based capsule with a liquid fill. |
| SPC | Soy protein concentrate |
| SPI | Soy protein isolate |
| Spirulina | It is a biomass of cyanobacteria that can be consumed by humans and animals. |
| Stabilizer | It is an ingredient added to food products to help maintain or enhance their original texture, and physical and chemical characteristics. |
| Supplementation | It is the consumption or provision of concentrated sources of nutrients or other substances that are intended to supplement nutrients in the diet and is intended to correct nutritional deficiencies. |
| Texturant | It is a specific type of food ingredient that is used to control and alter the mouthfeel and texture of food and beverage products. |
| Thickener | It is an ingredient that is used to increase the viscosity of a liquid or dough and make it thicker, without substantially changing its other properties. |
| Trans fat | Also called trans-unsaturated fatty acids or trans fatty acids, it is a type of unsaturated fat that naturally occurs in small amounts in meat. |
| TSP | Textured soy protein |
| TVP | Textured vegetable protein |
| WPC | Whey protein concentrate |
| WPI | Whey protein isolate |


Research Methodology
Mordor Intelligence follows a four-step methodology in all our reports.
- Step-1: Identify Key Variables: The quantifiable key variables (industry and extraneous) pertaining to the specific product segment and country are selected from a group of relevant variables & factors based on desk research & literature review; along with primary expert inputs. These variables are further confirmed through regression modeling (wherever required).
- Step-2: Build a Market Model: In order to build a robust forecasting methodology, the variables and factors identified in Step-1 are tested against available historical market numbers. Through an iterative process, the variables required for market forecast are set and the model is built on the basis of these variables.
- Step-3: Validate and Finalize: In this important step, all market numbers, variables and analyst calls are validated through an extensive network of primary research experts from the market studied. The respondents are selected across levels and functions to generate a holistic picture of the market studied.
- Step-4: Research Outputs: Syndicated Reports, Custom Consulting Assignments, Databases & Subscription Platforms


