Home Blood Pressure Monitoring Devices Market Size and Share
Market Overview
| Study Period | 2022 - 2031 |
|---|---|
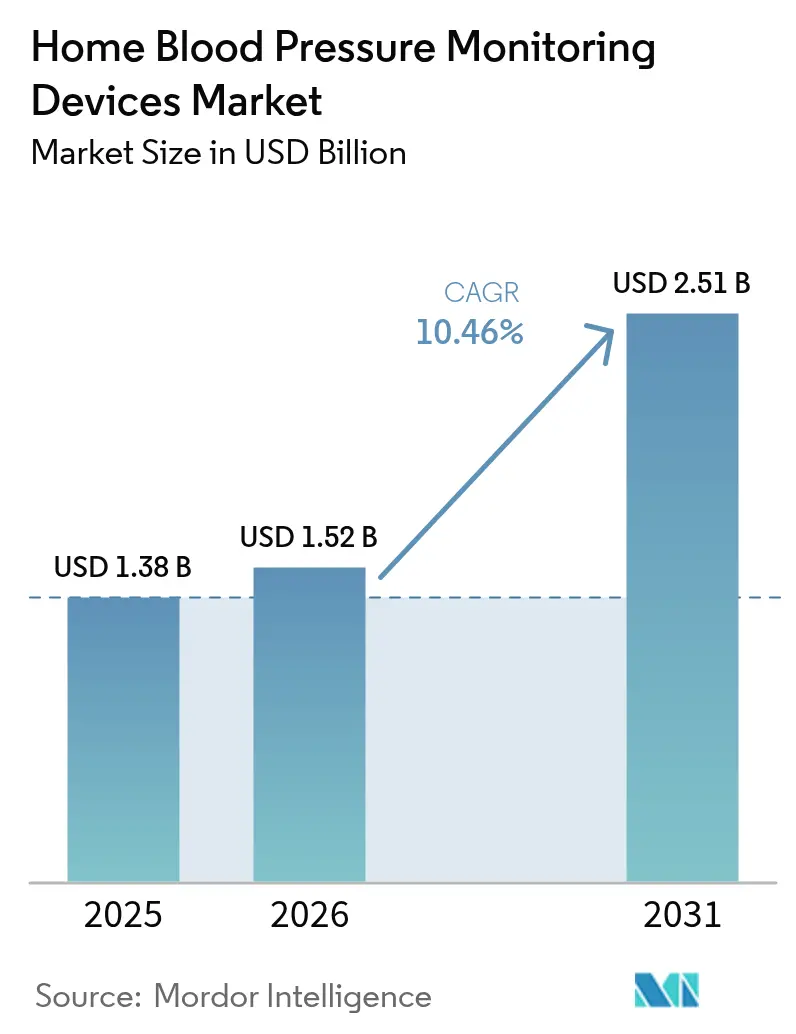
| Market Size (2026) | USD 1.52 Billion |
| Market Size (2031) | USD 2.51 Billion |
| Growth Rate (2026 - 2031) | 10.46% CAGR |
| Fastest Growing Market | Asia-Pacific |
| Largest Market | North America |
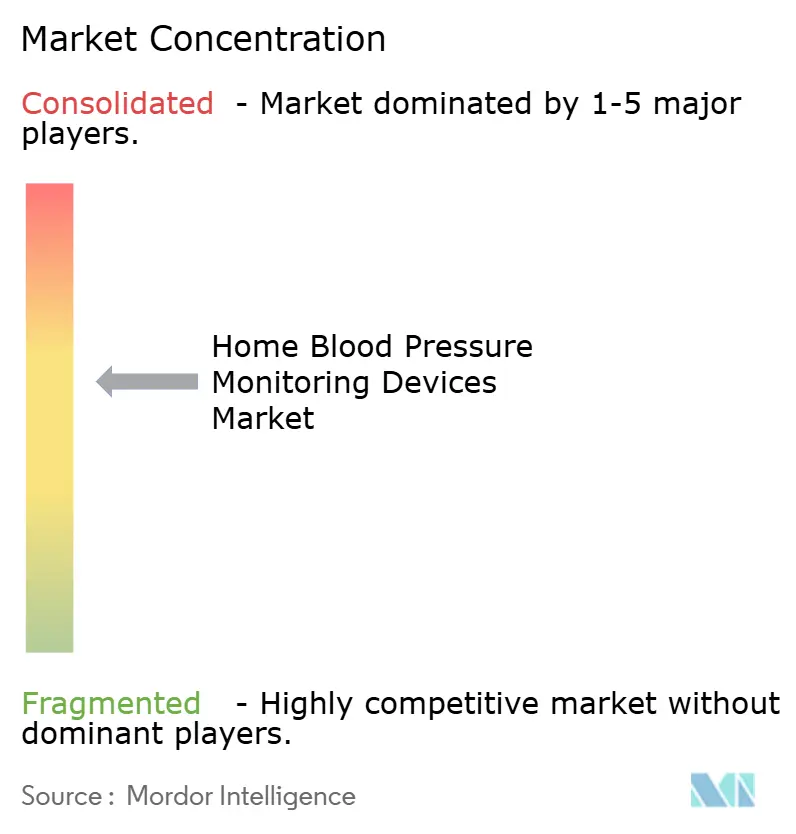
| Market Concentration | Medium |
Major Players *Disclaimer: Major Players sorted in no particular order Image © Mordor Intelligence. Reuse requires attribution under CC BY 4.0. | |
Home Blood Pressure Monitoring Devices Market Analysis by Mordor Intelligence
The home blood pressure monitoring devices market size in 2026 is estimated at USD 1.52 billion, growing from the 2025 value of USD 1.38 billion, with 2031 projections showing USD 2.51 billion, growing at 10.46% CAGR over 2026-2031. Growth responds to rising hypertension prevalence, an aging global population, and national policies that reimburse self-measured blood pressure services—particularly under Medicare CPT codes 99473 and 99474. Digital health integration, supply-chain investments that stabilize cuff availability, and heightened clinical focus on validated upper-arm devices reinforce market momentum [1]Source: American Medical Association, “SMBP Coding and Reimbursement Overview,” ama-assn.org. Meanwhile, Wi-Fi connectivity and AI-supported atrial-fibrillation detection differentiate next-generation monitors, while equity mandates for inclusive cuff sizing unlock underserved demand segments. Competitive intensity remains moderate as legacy firms scale AI algorithms and newcomers raise capital for cuffless wearables.
Key Report Takeaways
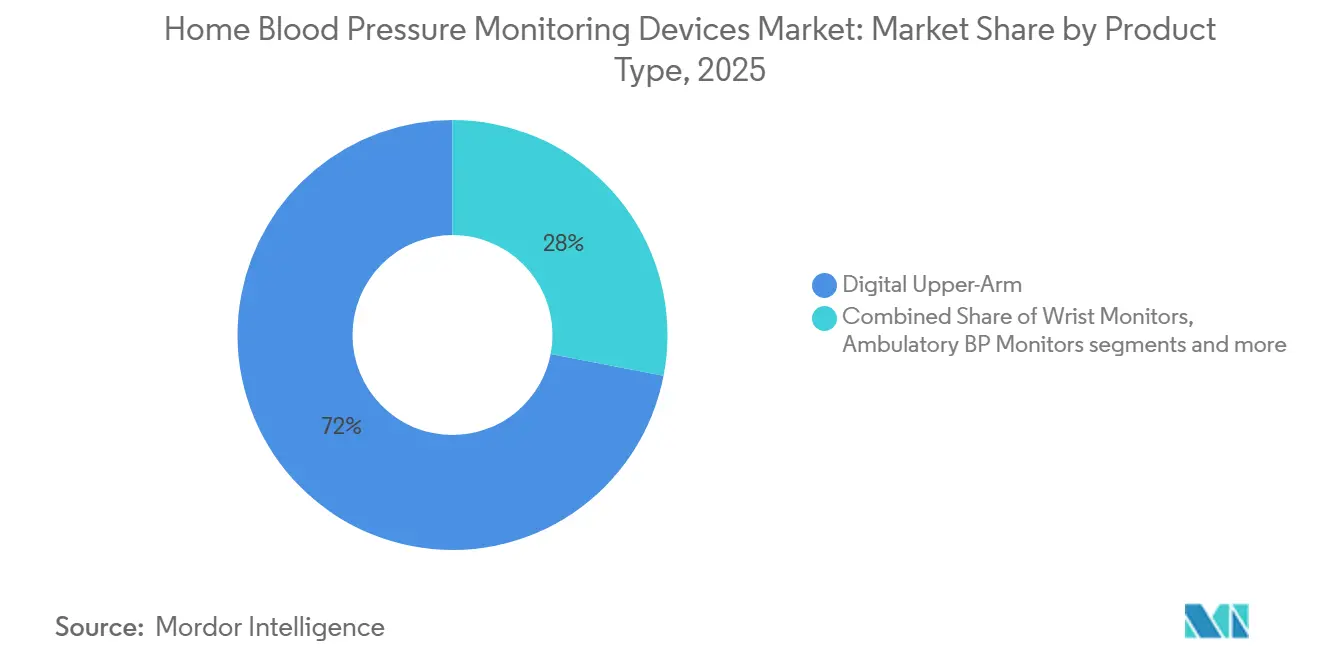
- By product type, digital upper-arm monitors led with 71.96% of the home blood pressure monitoring devices market share in 2025; cuffless wearables are projected to expand at an 11.10% CAGR to 2031.
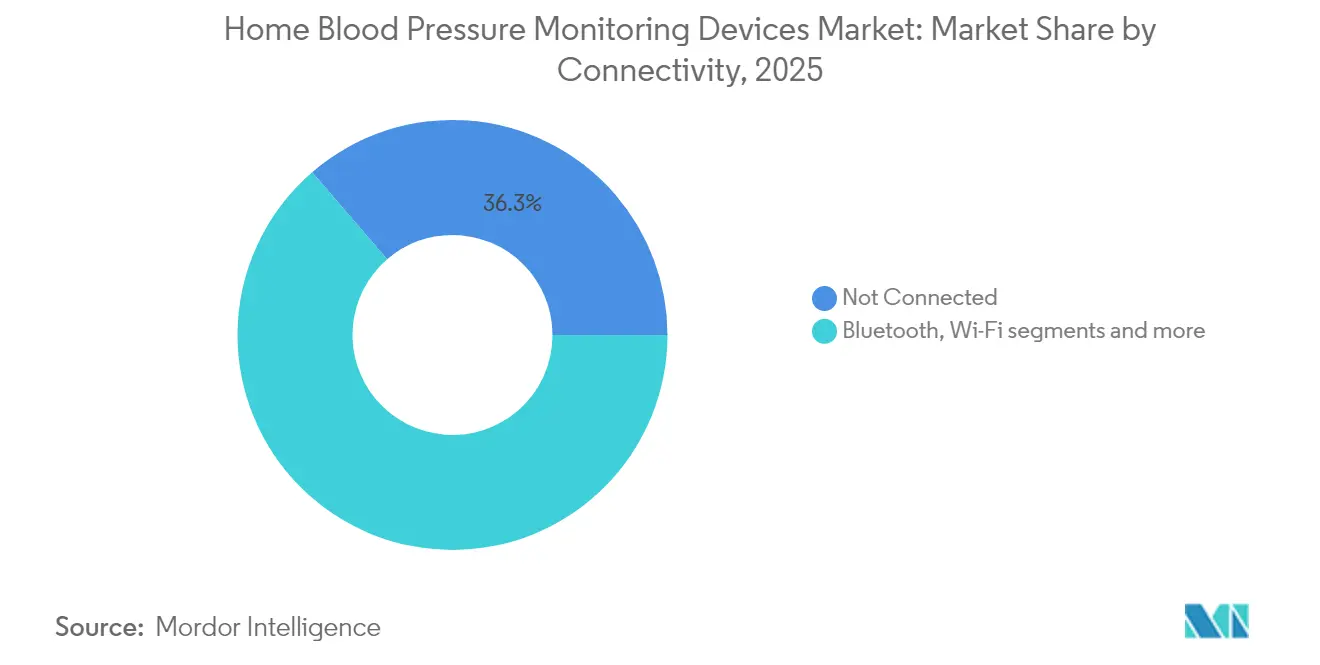
- By connectivity, non-connected devices held 36.32% share of the home blood pressure monitoring devices market size in 2025, while Wi-Fi-enabled models record the highest forecast CAGR at 12.01% through 2031.
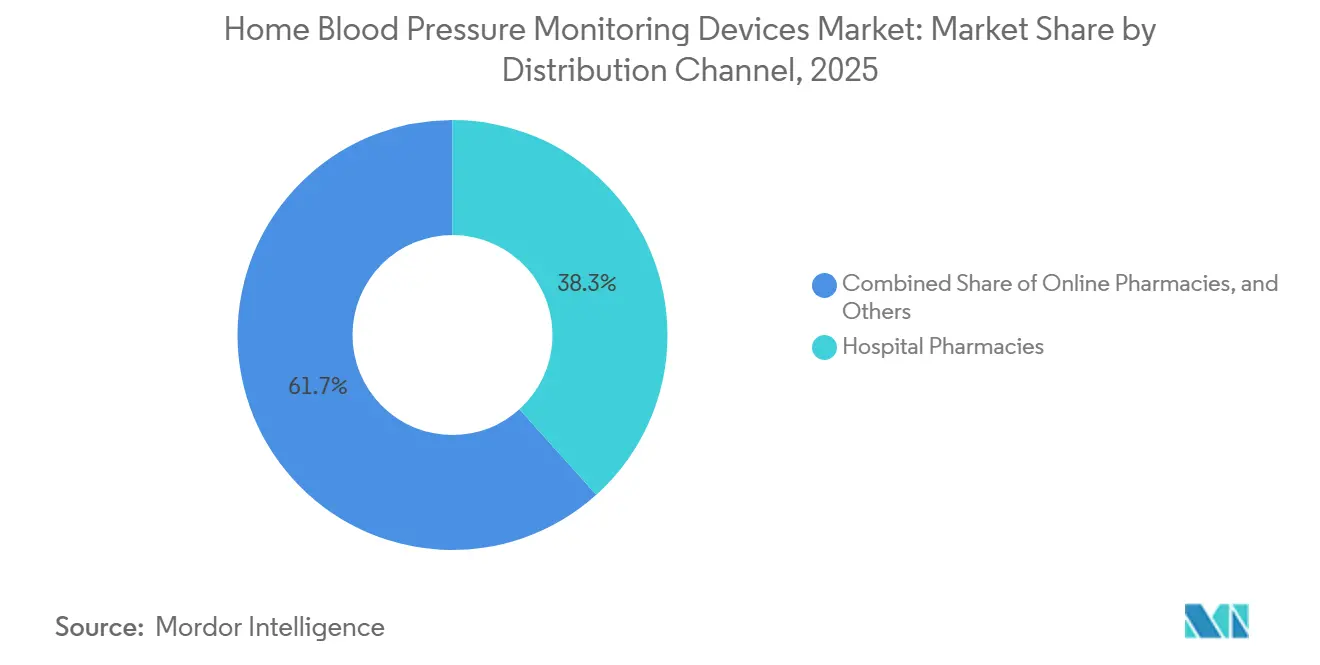
- By distribution channel, hospital pharmacies held 38.34% share of the home blood pressure monitoring devices market size in 2025, while online pharmacies record the highest forecast CAGR at 12.37% through 2031.
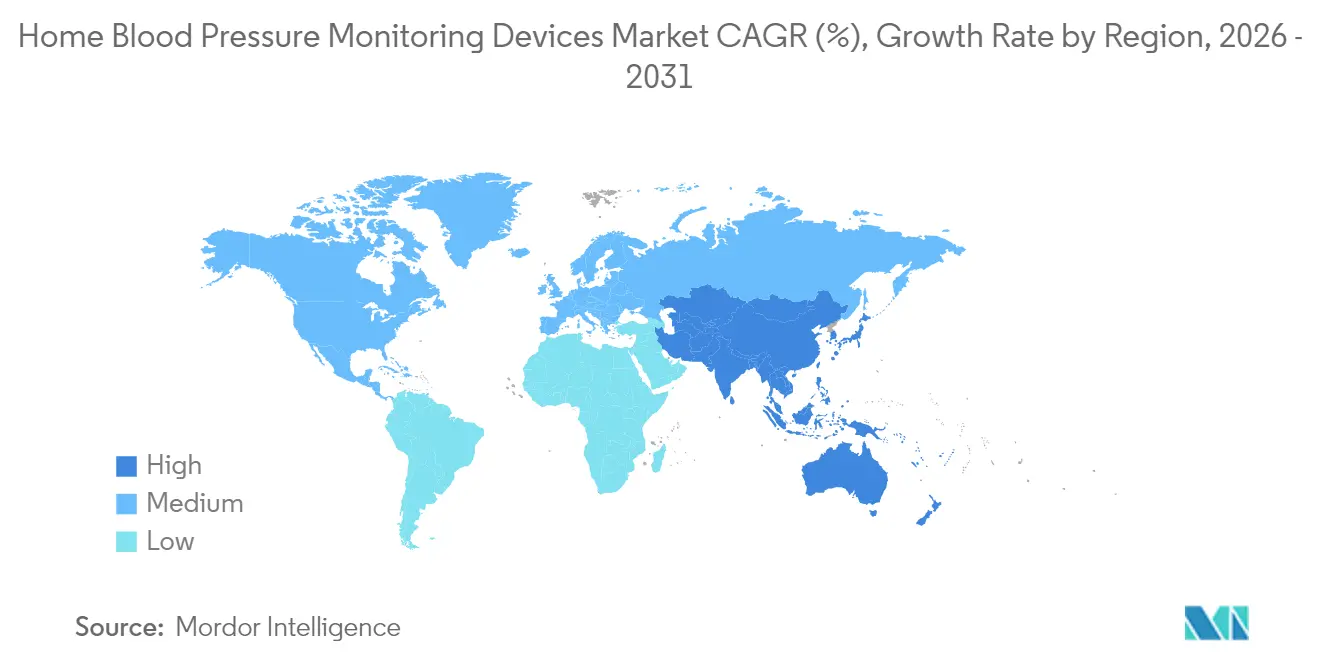
- By geography, North America commanded 38.42% revenue share of the home blood pressure monitoring devices market in 2025, whereas Asia-Pacific is set to register a 12.22% CAGR through 2031.
Note: Market size and forecast figures in this report are generated using Mordor Intelligence’s proprietary estimation framework, updated with the latest available data and insights as of 2026.
Global Home Blood Pressure Monitoring Devices Market Trends and Insights
Drivers Impact Analysis*
| Driver | (~) % Impact on CAGR Forecast | Geographic Relevance | Impact Timeline |
|---|---|---|---|
| Rising hypertension prevalence & aging population | +2.80% | Global, with highest impact in Asia-Pacific and North America | Long term (≥ 4 years) |
| Rapid uptake of Bluetooth-enabled & app-integrated monitors | +2.10% | North America & EU, expanding to APAC | Medium term (2-4 years) |
| Expansion of remote-patient-monitoring (RPM) reimbursement programs | +1.90% | North America core, early adoption in EU | Short term (≤ 2 years) |
| Shift from clinical to home diagnostics after COVID-19 | +1.60% | Global, with accelerated adoption in developed markets | Medium term (2-4 years) |
| Insurer incentives for self-measured BP submission | +0.80% | North America & EU, pilot programs in APAC | Medium term (2-4 years) |
| Equity mandates for large-cuff inclusivity | +0.60% | North America core, expanding to EU regulatory frameworks | Long term (≥ 4 years) |
| Source: Mordor Intelligence | |||
Rising Hypertension Prevalence & Aging Population
Global hypertension now affects over 1 billion individuals, yet only 21% achieve control, a gap the WHO underscored. Home monitoring can materially curb cost burdens: economic modeling in Japan indicates USD 9.30 billion in savings by avoiding white-coat hypertension treatment. Validation remains a bottleneck—less than 15% of marketed devices publish accuracy evidence—inviting manufacturers to invest in rigor while regulators tighten approval pathways.
Rapid Uptake of Bluetooth-Enabled & App-Integrated Monitors
Medicare’s 2025 payment schedule strengthens financial incentives, with USD 19.73–22.25 allotted for initial setup (CPT 99453), USD 43.02–49.04 for monthly device supply and monitoring (CPT 99454), and USD 47.87–52.23 for treatment management services (CPT 99457). These payments strengthen the business case for connected devices in routine care, yet many providers still cite workflow and staffing constraints as barriers to large-scale adoption. On the technology front, smartphone photoplethysmography is now achieving mean absolute systolic errors near 7.75 mmHg, signalling meaningful progress even though the method has not yet reached parity with standard blood-pressure measurement techniques.
Expansion of Remote-Patient-Monitoring Reimbursement Programs
U.S. policy requires 16 days of data within a 30-day cycle for RPM billing, favoring devices that transmit automatically. Cigna and other insurers layer health-equity prerequisites, stipulating FDA validation and digital reporting capabilities. The National Association of Community Health Centers likewise mandates FDA-validated devices to secure reimbursement, encouraging consolidation around proven brands.
Shift From Clinical to Home Diagnostics After COVID-19
Post-pandemic practice patterns elevate home readings as superior predictors of cardiovascular events, with Japanese telemonitoring trials showing significant blood-pressure reductions. The British Heart Foundation lists validated units beginning at GBP 20 yet emphasizes periodic recalibration to maintain accuracy. Clinic workflows lag: only 4.1% of surveyed outpatient sites adhere to standardized protocols even while 70% rely on home data for decision-making.
Restraints Impact Analysis*
| Restraint | (~) % Impact on CAGR Forecast | Geographic Relevance | Impact Timeline |
|---|---|---|---|
| High cost gap between validated vs non-validated devices | -1.40% | Global, with highest impact in price-sensitive markets | Medium term (2-4 years) |
| Accuracy concerns surrounding wrist & finger models | -1.10% | Global, affecting consumer confidence in alternative form factors | Long term (≥ 4 years) |
| Cyber-security & data-privacy risks in connected devices | -0.70% | Global, with heightened concerns in EU and North America | Short term (≤ 2 years) |
| Semiconductor supply-chain disruptions causing stock-outs | -0.50% | Global, with highest impact in Asia-Pacific manufacturing hubs | Medium term (2-4 years) |
| Source: Mordor Intelligence | |||
High Cost Gap Between Validated vs Non-Validated Devices
A MedM review of 3,411 FDA-cleared products found 76.3% lacked complete validation, exposing consumers to unvetted devices. German Hypertension League testing showed only 47.6% of 105 evaluated models passed every accuracy criterion during a 15-year program. The American Medical Association’s Validated Device Listing aims to bridge awareness, yet many buyers still default to the lowest-priced monitor.
Accuracy Concerns Surrounding Wrist & Finger Models
Clinical comparisons report diastolic discrepancies of up to 12.8 mmHg between wrist and upper-arm methods, mainly due to position effects. Smart rings and optical wearables lack regulatory consensus, and early human studies, while promising, still fall outside ISO thresholds. These gaps slow adoption despite consumer preference for discreet form factors.
*Our forecasts treat driver/restraint impacts as directional, not additive. The impact forecasts reflect baseline growth, mix effects, and variable interactions.
Segment Analysis
By Product Type: Digital Dominance Faces Cuffless Disruption
Digital upper-arm units secured 71.96% of home blood pressure monitoring devices market share in 2025, driven by their 55.7% validation pass rate in German league testing and long-standing clinical endorsement. Wrist monitors remain popular with seniors, though measurement-position errors limit prescriber confidence. Ambulatory models such as Oscar 2 keep a foothold in specialty cardiology, while accessories like cuffs gain strategic focus as 17 million U.S. adults require non-standard sizes.
Cuffless wearables represent the fastest-growing niche at an 11.10% CAGR, propelled by investor backing exemplified by Aktiia’s USD 42 million raise. The FDA’s partial recognition of IEEE 1708-2014 clarifies a regulatory roadmap, but manufacturers must still prove drug-response fidelity before mainstream uptake. Ultrasonic approaches unveiled by Novosound aim to overcome optical-sensor drift, underscoring a race for clinically viable cuff-free solutions.


By Connectivity: Non-Connected Legacy Meets Wi-Fi Acceleration
Non-connected models held 36.32% share of the home blood pressure monitoring devices market size in 2025, as simplicity appeals to privacy-minded or digitally reluctant users. Bluetooth bridges standalone devices and smartphones, yet adoption varies with digital literacy levels. Cellular variants cater to environments lacking home Wi-Fi but remain niche because of subscription costs.
Conversely, Wi-Fi monitors are on track for a 12.01% CAGR through 2031, aligning with hospital RPM platforms that upload data seamlessly to EHRs. The U.S. ambition to add 20 million remote-hypertension patients by 2030 places a premium value on automated uploads. Regulators, however, now require detailed cybersecurity plans after device vulnerabilities surged 59% raising compliance hurdles for smaller brands.
By Distribution Channel: Institutional Trust Anchors Pharmacies as Digital Channels Scale
Hospital pharmacies are expected to capture 38.34% of the home blood pressure monitoring devices market in 2025, supported by clinical workflows that naturally direct post-diagnosis patients toward institutional procurement. When cardiologists and general practitioners recommend specific validated monitors during consultations, patients often turn to the hospital pharmacy as the most convenient and trusted fulfillment point. This behavior creates a challenge for retail and digital channels, which may find it structurally difficult to disrupt the role of hospital pharmacies. The HEARTS Pharmacy framework, expected to be published in 2025, further formalizes this role by encouraging pharmacists to routinely measure blood pressure during medication refills using validated automated devices. This expands the hospital pharmacy’s role from a passive vendor to an active care node. A nationwide pharmacist-led home blood pressure monitoring program in Taiwan is expected to show that patient recognition of standardized monitoring protocols increased from 30.1% to 79.5% after pharmacist-guided intervention, highlighting the strong influence institutional pharmacy channels have on device adoption and sustained use. DKSH’s January 2026 partnership with medisana to distribute home blood pressure monitoring devices across hospital and retail pharmacy networks in Malaysia and Brunei is expected to underscore how distributors continue to view institutional pharmacies as a primary expansion channel across emerging Asian markets.
Online pharmacies are the fastest-growing distribution channel and are projected to expand at a 12.37% CAGR from 2026 to 2031, outpacing the overall market rate of 10.46% by nearly 2 percentage points. Omron is expected to credit e-commerce and quick commerce platforms for accelerating blood pressure monitor penetration in India in 2025, where home monitoring usage has doubled to approximately 6% but still has considerable room to grow. In China, e-commerce platforms, including livestream commerce on Douyin and Kuaishou, already account for an estimated 60–65% of retail unit sales for portable blood pressure monitors, offering a directional view of where global online distribution may move during the forecast period. The Others segment, which includes general retail chains, health specialty stores, and direct-to-consumer brand websites, serves price-sensitive and first-time buyers. However, this segment faces increasing pressure from private-label monitor programs launched by major pharmacy groups that compete aggressively on price across the same access points. A 2024 study in CJC Open found that only 45.1% of blood pressure monitors sold through online retailers in Canada met Hypertension Canada validation standards, compared with 89.7% at pharmacies. This product quality gap is drawing greater attention in clinical guidelines from the American College of Cardiology and the American Heart Association and could moderate online channel penetration among clinician-referred patients.
Geography Analysis
North America retained leadership with 38.42% of home blood pressure monitoring devices market share in 2025. Medicare’s CPT codes reimburse USD 11.19 for training and up to USD 15.16 for reporting, anchoring demand. Yet 17 million residents cannot use standard cuffs, and nearly 12% of Black adults fall outside available sizes, prompting advocacy for inclusive designs. Canada and Mexico expand gradually as reimbursement pathways mature.
Europe shows consistent, mid-single-digit growth. Germany’s Hypertension League finds fewer than half of home devices fully accurate, reinforcing consumer reliance on published validation lists. The UK now offers blood-pressure checks during dental or optician visits, reflecting a preventive-care pivot. Nonetheless, the fragmented reimbursement environment still tempers uptake outside pilot-friendly markets such as Germany and the Nordics.
Asia-Pacific is the fastest-growing region at a 12.22% CAGR. China’s scale, Korea’s tech infrastructure, and emerging IoT hypertension programs bolster demand. Physician surveys reveal a patient-awareness gap—only one-third say home monitoring is widely recognized—signaling the need for education campaigns even as digital adoption surges.

Competitive Landscape
The market is moderately concentrated. Omron Healthcare alone has shipped more than 350 million units and in January 2025 gained FDA De Novo clearance for an AI algorithm that detects atrial fibrillation with 95% sensitivity and 98% specificity[2]Source: Omron Healthcare, “FDA Clears AFib-Detecting BP Monitors,” omronhealthcare.com . Philips and Welch Allyn maintain strong positions in hospital channels, while Withings targets lifestyle consumers with the USD 149.95 BPM Vision device featuring simultaneous Wi-Fi upload.
Funding flows boost innovators: Hilo (formerly Aktiia) attracted USD 42 million to refine optical cuffless technology, though peer-review studies highlight medication-tracking gaps. Novosound’s ultrasound wearable extends beyond oscillometric sensors and may compete on accuracy and comfort. Supply-chain resilience grows strategic; Baxter ran 24/7 production in 2024-2025 to end cuff shortages and added U.S. capacity, strengthening hospital contracts.
White-space opportunities center on inclusive cuff designs and robust cybersecurity. FDA’s demand for pre-market cyber plans rewards firms with established IT risk frameworks, potentially tilting share toward diversified conglomerates. Simultaneously, validated-device listings and insurer quality gates may phase out low-accuracy, low-cost imports, tightening competitive barriers.
Home Blood Pressure Monitoring Devices Industry Leaders
American Diagnostic Corporation
Halma plc
Beurer GmbH
Omron Healthcare, Inc.
A&D Medical
- *Disclaimer: Major Players sorted in no particular order

Recent Industry Developments
- May 2025: Aktiia secured USD 42 million and rebranded to Hilo to advance optical cuffless monitoring.
- April 2025: Withings launched BPM Vision in the U.S. after FDA clearance, offering a 2.8-inch color display and Wi-Fi upload at USD 149.95.
- March 2025: Baxter resolved cuff shortages by installing new U.S. machines and running 24/7 production schedules.


Global Home Blood Pressure Monitoring Devices Market Report Scope
As per the scope of the report, home blood pressure monitoring devices are used to monitor blood pressure at home regularly. Home monitoring is not a substitute for regular visits to the physician. The Home Blood Pressure Monitoring Devices market is segmented by product (upper arm monitors, wrist monitors, and accessories), distribution channel (hospital pharmacies, online pharmacies, and others), and geography (North America, Europe, Asia-Pacific, the Middle East and Africa, and South America). The market report also covers the estimated market sizes and trends of 17 countries across major regions globally. The report provides the above segments' values in USD (US Dollar) million.
| Upper Arm Monitors |
| Wrist Monitors |
| Accessories |
| Non-Connected Devices |
| Bluetooth-Enabled Devices |
| Wi-Fi-Enabled Devices |
| Cellular/Remote Monitoring Enabled Devices |
| Others |
| Hospital Pharmacies |
| Online Pharmacies |
| Others |
| North America | United States |
| Canada | |
| Mexico | |
| Europe | Germany |
| United Kingdom | |
| France | |
| Italy | |
| Spain | |
| Rest of Europe | |
| Asia-Pacific | China |
| Japan | |
| India | |
| Australia | |
| South Korea | |
| Rest of Asia-Pacific | |
| Middle East and Africa | GCC |
| South Africa | |
| Rest of Middle East and Africa | |
| South America | Brazil |
| Argentina | |
| Rest of South America |
| By Product Type | Upper Arm Monitors | |
| Wrist Monitors | ||
| Accessories | ||
| By Connectivity | Non-Connected Devices | |
| Bluetooth-Enabled Devices | ||
| Wi-Fi-Enabled Devices | ||
| Cellular/Remote Monitoring Enabled Devices | ||
| Others | ||
| By Distribution Channel | Hospital Pharmacies | |
| Online Pharmacies | ||
| Others | ||
| By Geography | North America | United States |
| Canada | ||
| Mexico | ||
| Europe | Germany | |
| United Kingdom | ||
| France | ||
| Italy | ||
| Spain | ||
| Rest of Europe | ||
| Asia-Pacific | China | |
| Japan | ||
| India | ||
| Australia | ||
| South Korea | ||
| Rest of Asia-Pacific | ||
| Middle East and Africa | GCC | |
| South Africa | ||
| Rest of Middle East and Africa | ||
| South America | Brazil | |
| Argentina | ||
| Rest of South America | ||


Key Questions Answered in the Report
How big is the Home Blood Pressure Monitoring Devices Market?
The Home Blood Pressure Monitoring Devices Market size is expected to reach USD 1.52 billion in 2026 and grow at a CAGR of 10.46% to reach USD 2.51 billion by 2031.
What is the current Home Blood Pressure Monitoring Devices Market size?
In 2026, the Home Blood Pressure Monitoring Devices Market size is expected to reach USD 1.52 billion.
Which product segment leads the market today?
Digital upper-arm monitors hold 71.96% market share thanks to validated accuracy and broad clinical acceptance.
Why are Wi-Fi blood pressure monitors growing so rapidly?
Wi-Fi devices enable automatic data uploads that meet Medicare’s RPM billing rules and hospital EHR integration requirements, supporting a projected 12.01% CAGR.
What limits adoption of wrist and finger monitors?
Position-based inaccuracies and limited validation evidence cause diastolic errors up to 12.8 mmHg, restraining clinical endorsement.
How are companies addressing cuff-size equity issues?
Manufacturers are designing large and tronco-conical cuffs, while advocacy groups lobby for insurance coverage of size-inclusive options.
Page last updated on:


