
Epilepsy Drugs Market Size and Share
Market Overview
| Study Period | 2020 - 2031 |
|---|---|
| Market Size (2026) | USD 10.41 Billion |
| Market Size (2031) | USD 12.97 Billion |
| Growth Rate (2026 - 2031) | 4.50 % |
| Fastest Growing Market | Asia Pacific |
| Largest Market | North America |
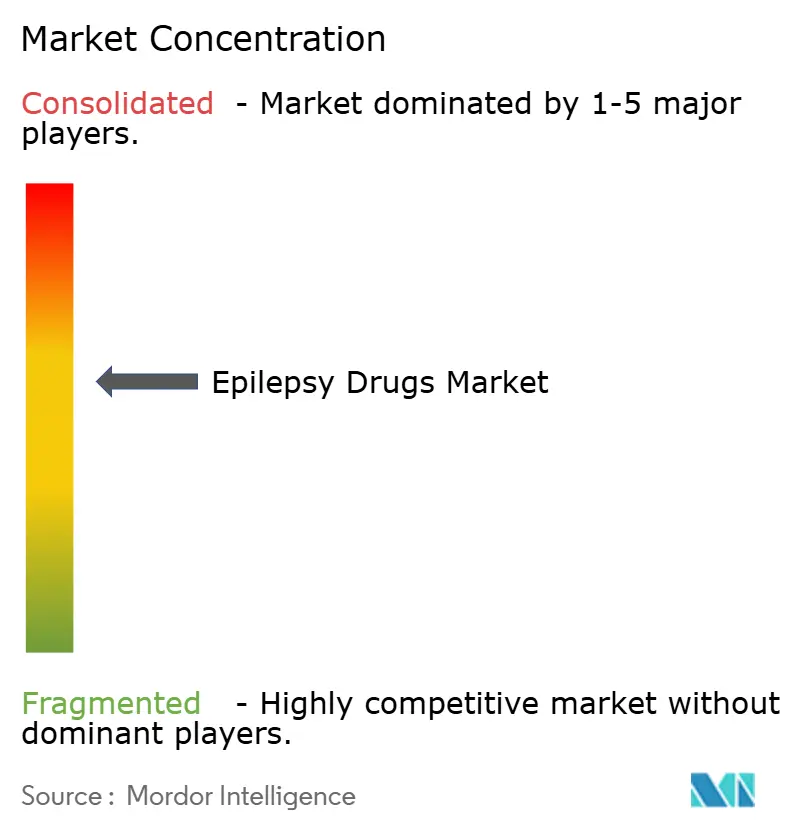
| Market Concentration | Medium |
Major Players *Disclaimer: Major Players sorted in no particular order Image © Mordor Intelligence. Reuse requires attribution under CC BY 4.0. | |
Epilepsy Drugs Market Analysis by Mordor Intelligence
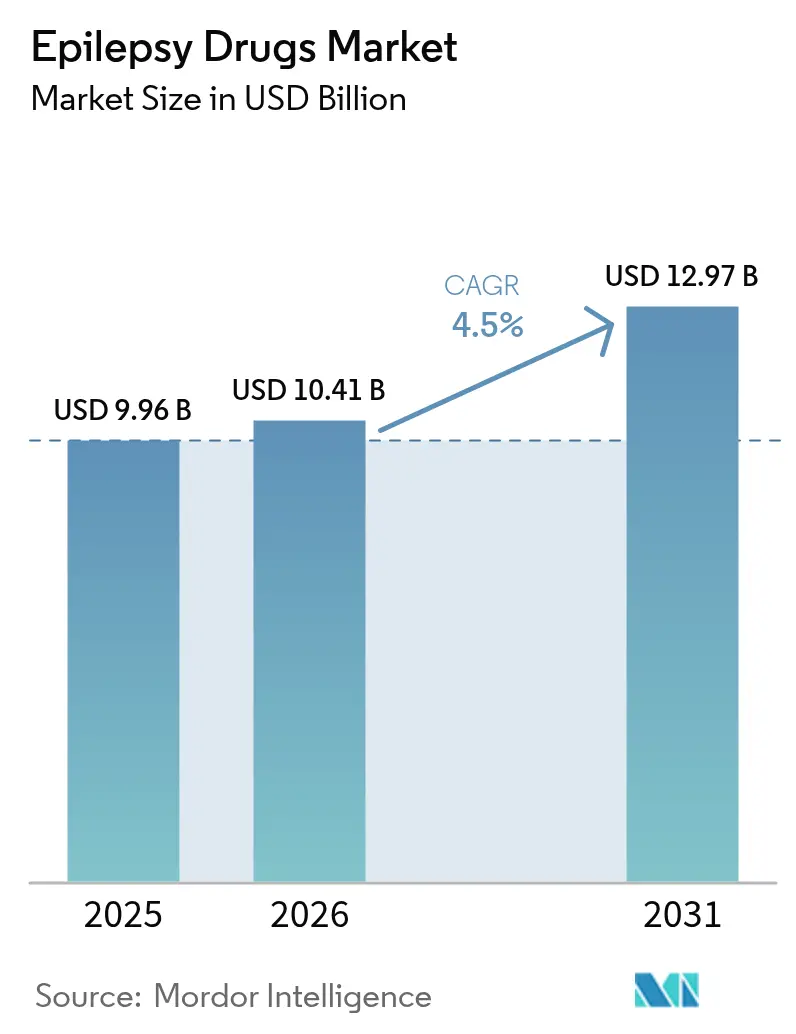
The Epilepsy Drugs market size is expected to grow from USD 9.96 billion in 2025 to USD 10.41 billion in 2026 and is forecast to reach USD 12.97 billion by 2031 at 4.5% CAGR over 2026-2031.
This advance reflects the successful launch of third-generation antiseizure medicines, fast adoption of genetic precision tools, and the growth of tele-neurology services that improve adherence. Demand keeps rising as physicians seek safer agents for focal seizures and drug-resistant epilepsy, yet pricing pressure from patent expirations and periodic API shortages temper topline momentum. North America retains leadership through deep reimbursement coverage, while Asia-Pacific shows the strongest trajectory as China and India invest in epilepsy awareness campaigns and broaden access to advanced therapies. Competitive intensity is sharpening because niche innovators are winning share in orphan indications and digital-health ecosystems.
Key Report Takeaways
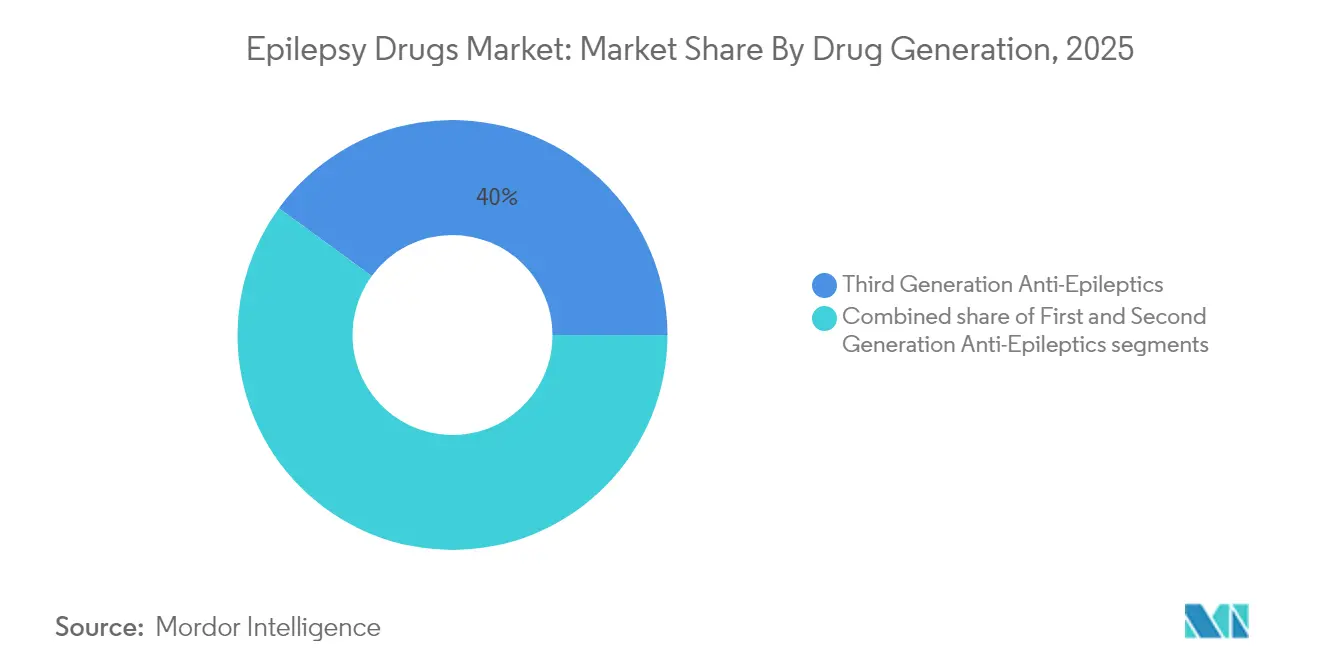
- By drug generation, third-generation agents led with 39.96% of anti-epileptic drugs market share in 2025, while second-generation products are on track for the fastest 6.08% CAGR through 2031.
- By seizure type, focal seizures commanded a 60.88% share of the anti-epileptic drugs market size in 2025. Unclassified or combined seizures are projected to post the highest growth rate of 5.76% by 2031.
- By patient type, adults held 66.72% of the anti-epileptic drugs market size in 2025; pediatrics will record the strongest 6.29% CAGR through 2031.
- By route of administration, oral formulations captured 50.74% revenue share in 2025, whereas injectables are forecast to expand at the fastest pace of 5.55% to 2031.
- By distribution channel, hospital pharmacies led with 40.21% of anti-epileptic drugs market share in 2025, but e-pharmacies and other alternative outlets will experience the quickest growth, growing at 6.68% to 2031.
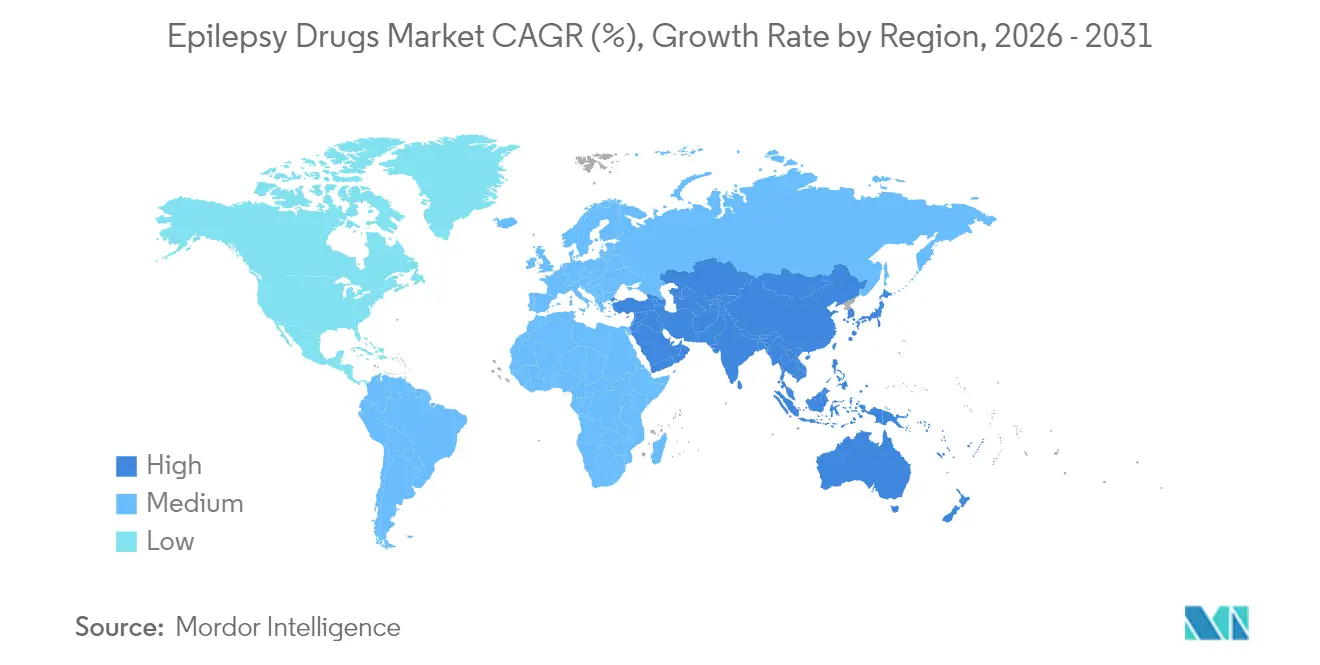
- By geography, North America led with 39.76% share of the anti-epileptic drugs market size in 2025, while Asia-Pacific is projected to expand at a 5.74% CAGR through 2031.
Note: Market size and forecast figures in this report are generated using Mordor Intelligence’s proprietary estimation framework, updated with the latest available data and insights as of 2026.
Global Epilepsy Drugs Market Trends and Insights
Drivers Impact Analysis*
| Driver | (~) % Impact on CAGR Forecast | Geographic Relevance | Impact Timeline |
|---|---|---|---|
| Third-generation approvals with safer profiles | +1.2% | Global, early uptake in North America and Europe | Medium term (2-4 years) |
| Growing pool of patients with drug-resistant epilepsy | +1.0% | Global, strongest in regions with supportive regulations | Medium term (2-4 years) |
| Precision genetics & AI-enhanced EEG diagnostics | +0.9% | North America, Europe, advanced Asia-Pacific hubs | Medium term (2-4 years) |
| Rapid tele-neurology adoption boosting adherence | +0.8% | North America, Europe, urban Asia-Pacific | Short term (≤ 2 years) |
| Rising investments in cannabinoid- and neurosteroid-based pipelines | +0.7% | North America, Europe, urban Asia-Pacific | Medium term (2-4 years) |
| Orphan-drug incentives for rare encephalopathies | +0.6% | Global, strongest in regions with supportive regulations | Medium term (2-4 years) |
| Source: Mordor Intelligence | |||
Surge in Approvals of Third-Generation Antiseizure Medications with Improved Safety Profiles
Global regulators are clearing a steady stream of next-wave agents such as cenobamate, brivaracetam, cannabidiol and diazepam nasal formulations that demonstrate higher seizure-reduction rates and fewer adverse reactions than legacy drugs. SK Biopharmaceuticals reported a 46.6% year-on-year jump in Xcopri sales to USD 102.4 million during Q1 2025.[1]NeurologyLive Editorial Team, “FDA Action Update, April 2025,” neurologylive.com Real-world data presented at the 2025 American Academy of Neurology meeting showed an 84% median seizure cut in focal-seizure adults treated with cenobamate, while an Israeli observational study cited 27.5% seizure freedom among pharmaco-resistant patients using the same molecule.[2]A.A. Khan & M.A. Khan, “Orphan Drugs in Epilepsy Treatment – A Review,” Epilepsy & Behavior Reports, sciencedirect.com The FDA’s April 2025 decision to extend diazepam nasal spray to children aged 2–5 broadens rescue options. Collectively these advances raise expectations for better long-term outcomes and spur clinicians to transition treatment-resistant cases onto newer regimens.
Precision Genetics and AI-Enhanced EEG Diagnostics Are Improving Drug Selection and Treatment Success Rates
Artificial-intelligence algorithms now parse millions of clinical records to flag monogenic epilepsies years before typical diagnosis, enabling earlier and more appropriate therapy. Children’s Hospital of Philadelphia validated a model that detects genetic epilepsies 3.6 years sooner by screening 89 million annotations from 32,000 patients.[3]Children’s Hospital of Philadelphia, “Clinical signatures of genetic epilepsies precede diagnosis,” chop.edu Whole-exome sequencing yields a 14% diagnostic hit rate, and 59% of those findings align with precision therapies, though real-world uptake still lags at 32% for reimbursement and access reasons. As payer coverage widens and AI achieves regulatory endorsement, clinicians are expected to pair genotype insights with third-generation drugs, reinforcing personalized care pathways across the anti-epileptic drugs market.
Rapid Adoption of Tele-Neurology Platforms, Raising Prescription Refill Frequency and Long-Term Adherence
The American Epilepsy Society formally supports telehealth for epilepsy management and urges regulatory flexibility to keep remote prescribing in place.[4]American Epilepsy Society, “Telehealth Position Statement,” aesnet.org SK Biopharmaceuticals and Eurofarma are developing an AI-powered epilepsy telemedicine service aimed at U.S. users, anticipating a USD 1.8 billion remote-care segment by 2032. Controlled studies reveal that video-observed therapy reminders and digital psychoeducation tools materially lower no-show rates and improve adherence, especially among Medicaid and minority populations, reinforcing revenue durability for anti-epileptic drugs market participants.
Orphan-Drug Incentives Expediting Therapies for Rare Epileptic Encephalopathies
Seven antiseizure treatments now carry orphan designations across the United States and European Union, leveraging tax benefits, fee waivers and 7- to 10-year exclusivity windows. Success stories such as fenfluramine for Dravet and Lennox-Gastaut syndromes validate the model and encourage sponsors to advance small-population programs that enjoy premium pricing latitude. With developmental and epileptic encephalopathies often resistant to mainstream drugs, orphan pathways are central to satisfying unmet clinical needs and offer an attractive commercial hedge against generics.
Restraints Impact Analysis*
| Restraint | (~) % Impact on CAGR Forecast | Geographic Relevance | Impact Timeline |
|---|---|---|---|
| Patent expirations of legacy brands | -0.7% | Global, pronounced in mature markets | Short term (≤ 2 years) |
| Recurring API shortages for key molecules | -0.5% | Global, acute in emerging economies | Medium term (2-4 years) |
| Stringent payer controls | -0.4% | North America, Europe, Asia-Pacific | Medium term (2-4 years) |
| Complex titration and safety monitoring | -0.4% | North America, Europe, Asia-Pacific | Medium term (2-4 years) |
| Source: Mordor Intelligence | |||
Patent Expirations Erode Margins of Legacy Blockbuster AED Brands
UCB’s Vimpat and several other long-standing leaders face steep price drops as exclusive protections lapse. The Federal Trade Commission is scrutinizing industry tactics to block or delay generic entry and insists that savings reach patients. While erosion can exceed 70% within the first year post-expiry, it also pushes prescribers to experiment with innovative agents still under patent, shifting volume toward companies that maintain rich late-stage pipelines.
Recurring API Shortages for Carbamazepine and Levetiracetam Disrupt Supply Continuity
Concentrated manufacturing capacity combined with transportation bottlenecks resulted in more than 1,000 medicine shortages in Sweden during 2023, a trend echoed worldwide. Breaks in therapy can trigger breakthrough seizures and elevate hospitalization risk. Regulators are mandating earlier shortage notifications, while hospital buyers diversify sources and build buffer stocks, yet medium-term uncertainty persists, nudging health systems toward newer molecules with more secure supply chains.
*Our forecasts treat driver/restraint impacts as directional, not additive. The impact forecasts reflect baseline growth, mix effects, and variable interactions.
Segment Analysis
By Drug Generation: Third-Generation Medicines Redefine Standards of Care
Third-generation compounds dominated with 39.96% share of the anti-epileptic drugs market in 2025 thanks to superior safety and dual-mechanism action. Cenobamate’s phase 3 data showed 25.8% seizure freedom over 12 months across varied doses. This progress underpins a forecast in which the segment broadens its lead through 2031, while second-generation agents grow at 6.08% CAGR on the back of extensive real-world familiarity and favorable side-effect profiles.
Moving forward, synergy between third-generation drugs and precision diagnostics will likely speed therapy switches for refractory patients, anchoring revenue streams for innovators. Even so, first-generation staples remain cornerstones in resource-limited settings because of well-known pharmacokinetics and low cost, preserving a multi-tier landscape within the anti-epileptic drugs market.



By Seizure Type: Focal Seizure Therapies Anchor Demand
Focal seizures accounted for 60.88% of anti-epileptic drugs market size in 2025, a position that mirrors the higher prevalence of partial-onset conditions globally. First-line choices include lamotrigine and levetiracetam, while carbamazepine retains broad acceptance in cost-sensitive regions.
Unclassified/Combined Seizures segment is anticipated to record a 5.76% growth rate during the forecast period. Genomic research reveals distinct architectures for focal versus generalized epilepsies, giving pipeline developers fresh targets. As precision screening becomes routine, clinicians expect to fine-tune therapy even within the focal subgroup, yielding incremental volume growth and higher adherence across the anti-epileptic drugs market.
By Patient Type: Pediatric Care Accelerates on Tailored Formulations
Adults represented 66.72% share in 2025, yet pediatric prescriptions are expanding at 6.29% CAGR due to early genetic diagnosis and child-friendly dosage forms. The FDA’s extension of diazepam nasal spray to ages 2–5 highlights momentum in rescue therapies for younger cohorts.
The pediatric segment is anticipated to record a 6.29% growth rate, the highest amongst all the sub-segments, during the forecast period. Half of children achieve seizure control with their first medication, and precision genetic panels now accelerate the path to optimal regimens. As reimbursement widens for wearable EEG and tele-pediatrics, families gain better access, fortifying the anti-epileptic drugs market outlook in pediatric neurology.
By Route of Administration: Oral Formulations Retain Primacy but Injectable Demand Rises
Oral products held 50.74% revenue share in 2025 because of ease of use over long treatment horizons. The FDA cleared an oral suspension of cenobamate in 2024 to aid patients with swallowing difficulties.
The injectable segment is anticipated to record a 5.55% growth rate during the forecast period. Injectables and nasal/buccal routes, essential for status epilepticus rescue, are climbing fastest as hospitals refine rapid-response protocols. Emerging subcutaneous pumps promise continuous delivery for severe cases, widening therapeutic options and reinforcing the anti-epileptic drugs market’s diverse administration needs.

By Distribution Channel: Hospital Pharmacies Command Volumes while E-Pharmacies Surge
Hospital dispensaries captured 40.21% anti-epileptic drugs market share in 2025 through close clinician collaboration and emergency stock. Pharmacist-led stewardship within inpatient settings improves dosing accuracy and adverse-event monitoring.
The others segment, including online pharmacy, is anticipated to record a 6.68% growth rate, the highest amongst all the sub-segments, during the forecast period. Online pharmacies paired with tele-neurology present the quickest growth vector. Eurofarma’s collaboration with SK Biopharmaceuticals showcases direct-to-patient logistics that support refill adherence in chronic therapy. This omnichannel approach expands pharmaceutical reach and heightens competition in the anti-epileptic drugs market.
Geography Analysis
North America held a 39.76% share of the anti-epileptic drugs market in 2025 due to comprehensive insurance coverage, specialist density, and rapid uptake of third-generation products. Xcopri’s 46.6% sales surge in Q1 2025 underscores the region’s appetite for differentiated therapies. Regulatory flexibility supports tele-health prescription renewal programs that improve adherence, yet cost-containment policies create downward price pressure and keep CAGR at 3.82% through 2031.
Asia-Pacific exhibits the fastest 5.74% CAGR as governments scale public health budgets and widen diagnostic infrastructure. Despite sizable progress, China’s treatment gap persists, underscoring latent opportunity for branded and quality-assured generics. Japan’s late-stage trials for cannabidiol formulations and India’s push toward local manufacturing diversify the regional offer set and accelerate growth within the anti-epileptic drugs market.
Europe balances innovation against stringent cost controls, producing a steady 4.18% CAGR. SK Biopharmaceuticals markets cenobamate in 23 European countries via Angelini, seeking higher penetration of refractory cases. South America and the Middle East & Africa, while smaller, advance on telemedicine pilots and pragmatic diagnostic guidelines tailored to resource-limited settings. These efforts collectively raise awareness, reduce stigma, and expand the anti-epileptic drugs market footprint across emerging economies.

Value Chain Analysis
The epilepsy drugs value chain begins with key starting materials (KSMs) and chemical intermediates that feed API synthesis. It then moves through finished-dosage formulation (tablets/capsules, oral suspensions, injectables, and nasal/buccal rescue products) and secondary packaging. From there, APIs and finished products typically pass through global distributors and national wholesalers before reaching hospital pharmacies (a leading channel in 2025) and retail/e-pharmacy networks. Specialist prescribers and integrated tele-neurology services are increasingly influencing demand capture and refill behavior.
Upstream concentration is a recurring constraint. The US Pharmacopeia (USP) highlighted vulnerability tied to KSM bottlenecks and single-country sourcing, and its April 2026 update flagged 100 acute and chronic medicines at risk of supply gaps from upstream constraints. For mature molecules such as carbamazepine and levetiracetam, concentrated manufacturing capacity and multi-product lines can amplify disruption risk. As a result, buyers increasingly qualify alternate sources, add buffers for hospital emergency protocols, and favor products with more resilient supply footprints when shortages threaten continuity of care.
Competitive Landscape
The top tier comprises UCB, Pfizer and Novartis, whose broad portfolios and distribution networks secure large-volume hospital contracts. Mid-cap innovators such as SK Biopharmaceuticals, Jazz Pharmaceuticals and Marinus capture high-value niches in drug-resistant and rare genetic epilepsies. Strategic moves include SK Biopharmaceuticals’ tele-neurology joint venture with Eurofarma and Jazz’s doubling down on real-world evidence to extend Epidiolex into new geographies.
Competition increasingly hinges on digital-service wrappers that bundle medication adherence tools and remote EEG analytics. Companies racing to embed AI triage and video-observed dosing into their brand ecosystems create sticky patient relationships, securing share across the anti-epileptic drugs market. Patent cliffs remain a pivotal battleground: while generics erode legacy revenues, they liberate budget for prescribers to trial premium orphan medicines, shifting channel dynamics.
Regulatory oversight of pricing tactics adds complexity. The FTC’s active litigation record signals that exclusivity extensions will face higher scrutiny, nudging firms to prioritize unique mechanisms and orphan pathways for growth. Altogether, the anti-epileptic drugs industry is transitioning toward a hybrid arena where therapeutic innovation, precision diagnostics, and digital engagement decide long-term winners.
Epilepsy Drugs Industry Leaders
Jazz Pharmaceuticals PLC
Novartis AG
Pfizer Inc.
SK Biopharmaceuticals Co. Ltd.
UCB SA
- *Disclaimer: Major Players sorted in no particular order

Market Opportunities and Future Outlook
Opportunities are clustering around precision therapies for developmental and epileptic encephalopathies, and around lifecycle-management formulations that reduce real-world administration barriers. Praxis Precision Medicines advanced genetic-subtype programs in 2026, including FDA NDA acceptance for relutrigine in SCN2A/SCN8A developmental and epileptic encephalopathies (with a September 27, 2026 target action date), and Breakthrough Therapy Designation for elsunersen (PRAX-222) in SCN2A-DEE. These steps point to a clearer regulatory path for high-unmet-need, small-population epilepsy segments that sit outside traditional broad-spectrum ASM competition.
Another opportunity area is patient-centered delivery and access infrastructure that improves adherence and expands treatable cohorts, with particular relevance for pediatrics and patients with swallowing difficulties. In June 2026, SK Life Science reported FDA acceptance for review of an investigational cenobamate oral suspension NDA for focal seizures (with a January 31, 2027 target action date). That progress aligns formulation innovation with the market shift toward third-generation therapies and differentiated convenience. Late-stage activity also remains a reference point for mechanism diversification in focal epilepsy, including Xenon Pharmaceuticals' Phase 3 X-TOLE2 presentation and long-term data for azetukalner (along with stated intent to submit an NDA in Q3 2026). Together, these developments support room for new branded entrants even as payer controls and generic price pressure continue to constrain older products.
Recent Industry Developments
- June 2026: SK Life Science reported FDA acceptance for review of an NDA for an investigational cenobamate oral suspension for focal seizures. The filing targets patients who need a non-tablet option, extending lifecycle value for a leading third-generation therapy. FDA review progress also raises the importance of differentiated formulations as a defense against step-therapy and generic substitution pressures.
- April 2025: The FDA expanded diazepam nasal spray (Valtoco) to children aged 2 to 5 years for acute seizure episodes. The label expansion broadened rescue-therapy access in pediatrics, supporting uptake of non-oral acute treatments through hospital and outpatient channels. It also reinforced investment interest in age-appropriate formulations and caregiver-friendly administration routes.
- December 2024: The FDA approved diazepam (Libervant) for acute seizure clusters in children aged 2 to 5. The approval added another pediatric rescue option and increased competitive intensity in fast-acting benzodiazepine delivery formats. Expanded pediatric indications further raised the role of specialty distribution and education programs to support correct at-home use.


Research Methodology Framework and Report Scope
Market Definition and Coverage
For this study, the epilepsy drugs market includes prescription medicines used to prevent or reduce seizure episodes in people diagnosed with epilepsy, across routine and refractory treatment settings. Values are captured as drug revenues at manufacturer level in USD for the defined year.
Scope exclusions: This scope does not count epilepsy diagnosis, monitoring, devices, surgery, dietary therapy, or non-drug supportive services.
Segmentation Overview
- By Drug Generation
- First Generation Anti-Epileptics
- Second Generation Anti-Epileptics
- Third Generation Anti-Epileptics
- By Seizure Type
- Focal (Partial) Seizures
- Generalized Seizures
- Unclassified / Combined Seizures
- By Patient Type
- Adult
- Pediatric
- By Route of Administration
- Oral
- Intravenous
- Nasal / Buccal
- Subcutaneous
- By Distribution Channel
- Hospital Pharmacy
- Retail Pharmacy
- Others
- By Geography (Value)
- North America
- United States
- Canada
- Mexico
- Europe
- Germany
- United Kingdom
- France
- Italy
- Spain
- Rest of Europe
- Asia-Pacific
- China
- India
- Japan
- Australia
- South Korea
- Rest of Asia-Pacific
- Middle East & Africa
- GCC
- South Africa
- Rest of Middle East & Africa
- South America
- Brazil
- Argentina
- Rest of South America
- North America
Data Sources, Market Sizing, and Validation
Desk Research
Desk work starts with building a clean view of the patient pool and the treated share, then linking that demand to therapy use and pricing signals. Public sources such as the World Health Organization, the US FDA drug database and labeling updates, the US CDC, and national health systems in major countries are used to sanity-check diagnosis trends, treatment guidelines, and the timing of approvals.
We also refer to sources such as peer-reviewed neurology and epilepsy journals, clinical trial registries, and customs or trade statistics where they help explain active ingredient supply patterns. Company filings, investor presentations, and reputable press are used to validate brand lifecycle shifts and major generic events. Paid subscriptions for company financials, patent databases, and shipment-level trade data are used selectively to fill gaps that public data cannot cover. This list is not exhaustive, and many other public sources were reviewed for data collection, validation, and clarification.
Primary Interviews and Surveys
Primary work is used to pressure-test what the desk model implies, especially for therapy switching, dosing persistence, and regional pricing corridors. We spoke with a mix of prescribers, hospital and retail channel stakeholders, and industry participants across APAC, EMEA, and the Americas, so assumptions could be refined where local reimbursement or generic penetration changes the demand picture.
Distribution of primary research fieldwork respondents
| Company type | Respondent position | Region |
|---|---|---|
| Top tier: 38% | CXOs: 15% | APAC: 40% |
| Mid tier: 44% | Functional/Unit leaders: 25% | EMEA: 34% |
| Smaller Players: 18% | Managers: 60% | Americas: 26% |
Market-Sizing & Forecasting
Sizing is built using top-down logic, where prevalence and diagnosis rates create a demand pool that is filtered through treated share, therapy mix, and typical dosing to arrive at implied consumption and value. The outputs are then cross-checked with selective bottom-up approximations, such as sampled country roll-ups of key molecules, channel checks on uptake for newer therapies, and ASP-based times volume checks to keep totals realistic.
Inputs that move the model include epilepsy prevalence and diagnosed population, the split of mono-therapy versus add-on therapy, generic penetration by molecule, launch and loss-of-exclusivity timing, and region-level net pricing after typical discounts and reimbursement effects. Where country data is thin, we handle gaps by using proxy markets with similar reimbursement structure and treatment guidelines, then review with experts to avoid overextending one country pattern into another.
Forecasts are created using scenario analysis supported by trend lines for treated prevalence, therapy switching, and price erosion, then adjusted for the approval cadence described in interviews. We keep assumptions explicit so the model can be re-run if a major label change or a new generic wave shifts the demand and price curve.
Data Validation & Update Cycle
Validation is done in steps so unusual outputs are caught early and corrected before sign-off. We compare totals against independent signals such as treated patient trends, prescription and channel indicators available in public reporting, and major molecule revenue trajectories, then investigate variances that do not match what stakeholders report in the field.
Before publication, the model is reviewed by another analyst, and any large changes trigger re-checks of key inputs such as price corridors, generic timing, and regional weightings. Reports are refreshed annually, and interim updates are made when material events occur, followed by a final pre-delivery pass so clients receive the most current view.
Mordor Intelligence's Epilepsy Drugs Market Size Versus Other Published Estimates
Published market sizes for epilepsy drugs can look far apart even when the topic sounds the same, because each publisher makes different calls on scope boundaries, currency handling, and how they carry prices forward over time. Differences also show up when one study relies more on list prices, while another emphasizes net pricing and reimbursement realities that shift by region.
A common gap driver in this market is whether the estimate counts only prescription anti-epileptic drug revenues at manufacturer level, or whether it blends in adjacent neurology therapeutics, hospital service value, or broader anticonvulsant uses beyond epilepsy. Another driver is timing, since FX conversion month, generic entry dates, and ASP erosion methods can move totals materially. The regular re-check of these variables tied to new approvals and label changes is what keeps the model current for Mordor Intelligence.
Benchmark comparison
| Source | Market Size | Gaps in Research Methodology |
|---|---|---|
| Mordor Intelligence | USD 9.96 B (2025) | |
| Global Research Publisher A | USD 11.13 B (2024) | Uses a different base year and often applies a faster price progression into the forecast period, which can implicitly understate generic price erosion that varies by molecule and region. |
| Market Research Firm B | USD 11.20 B (2024) | May include a wider anticonvulsant therapeutic framing and broader route coverage without making the revenue basis and net pricing adjustments consistently comparable across countries. |
The spread across the three figures is mostly explained by base-year selection, how net prices are normalized, and whether adjacent therapy revenue is mixed into the epilepsy-only drug pool. By keeping assumptions visible and checking them against treatment practice and timing events, we end up with a practical number that can be traced back to patient demand, therapy mix, and pricing logic.


Key Questions Answered in the Report
Which therapeutic trend is reshaping treatment protocols for drug-resistant epilepsy?
Clinicians are increasingly prescribing third-generation agents such as cenobamate and brivaracetam, whose dual mechanisms and improved tolerability raise seizure-freedom rates in refractory patients.
How is genetic testing influencing prescribing decisions in epilepsy care?
Routine whole-exome sequencing and AI-supported variant interpretation help neurologists match patients to targeted therapies sooner, reducing the trial-and-error cycle common with broad-spectrum drugs.
What role do tele-neurology platforms play in medication adherence?
Video consultations and digital refill reminders lower appointment no-show rates and support continuous dosing, leading to fewer breakthrough seizures and higher patient satisfaction.
Why are cannabinoid-based formulations gaining acceptance among practitioners?
Evidence from controlled studies shows that purified cannabidiol products can substantially reduce seizure frequency in severe genetic syndromes where conventional agents provide limited relief.
What is the primary supply-chain concern for long-standing anti-epileptic molecules?
Intermittent shortages of active pharmaceutical ingredients such as carbamazepine and levetiracetam disrupt pharmacy inventories, prompting hospitals to stock alternative therapies and diversify sourcing.
What are the main restraints facing the anti-epileptic drugs market?
Near-term challenges include patent expirations that compress margins and recurring API shortages for key molecules, both of which can disrupt supply and pricing.
Page last updated on:


 Your data is secure and never sold or shared.


