
Cannabidiol (CBD) Market Size and Share
Market Overview
| Study Period | 2020 - 2031 |
|---|---|
| Market Size (2026) | USD 11.64 Billion |
| Market Size (2031) | USD 24.39 Billion |
| Growth Rate (2026 - 2031) | 15.94 % |
| Fastest Growing Market | Asia Pacific |
| Largest Market | North America |
| Market Concentration | Low |
Major Players *Disclaimer: Major Players sorted in no particular order Image © Mordor Intelligence. Reuse requires attribution under CC BY 4.0. | |
Cannabidiol (CBD) Market Analysis by Mordor Intelligence
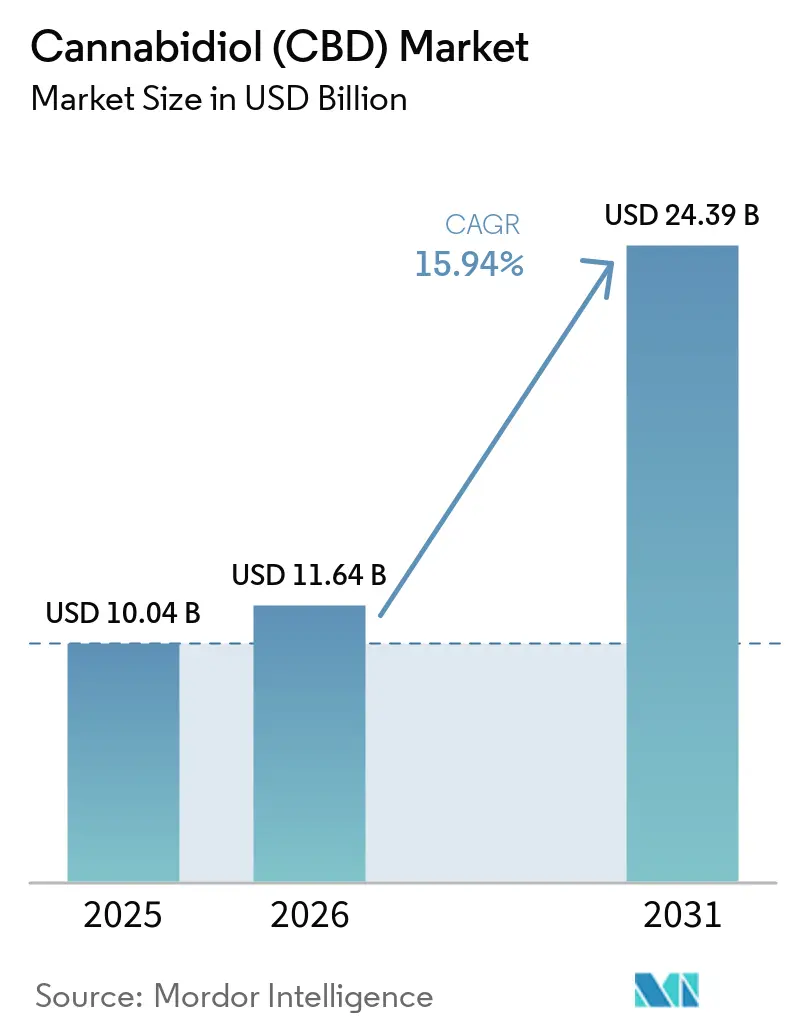
The Cannabidiol Market size was valued at USD 10.04 billion in 2025 and estimated to grow from USD 11.64 billion in 2026 to reach USD 24.39 billion by 2031, at a CAGR of 15.94% during the forecast period (2026-2031).
Rapid pharmaceutical-grade innovation is driving the CBD market from niche wellness to mainstream therapeutic and consumer applications. The imminent United States rescheduling of cannabis to Schedule III could unlock FDA-approved cannabinoid drugs for pharmacies, while nanoemulsion and other fast-acting delivery technologies widen the addressable base for ingestibles and topicals. Additionally, Canopy Growth’s acquisition of Wana and Jetty signals that brand portfolios and proprietary IP will dictate competitive advantage in the CBD market.
Key Report Takeaways
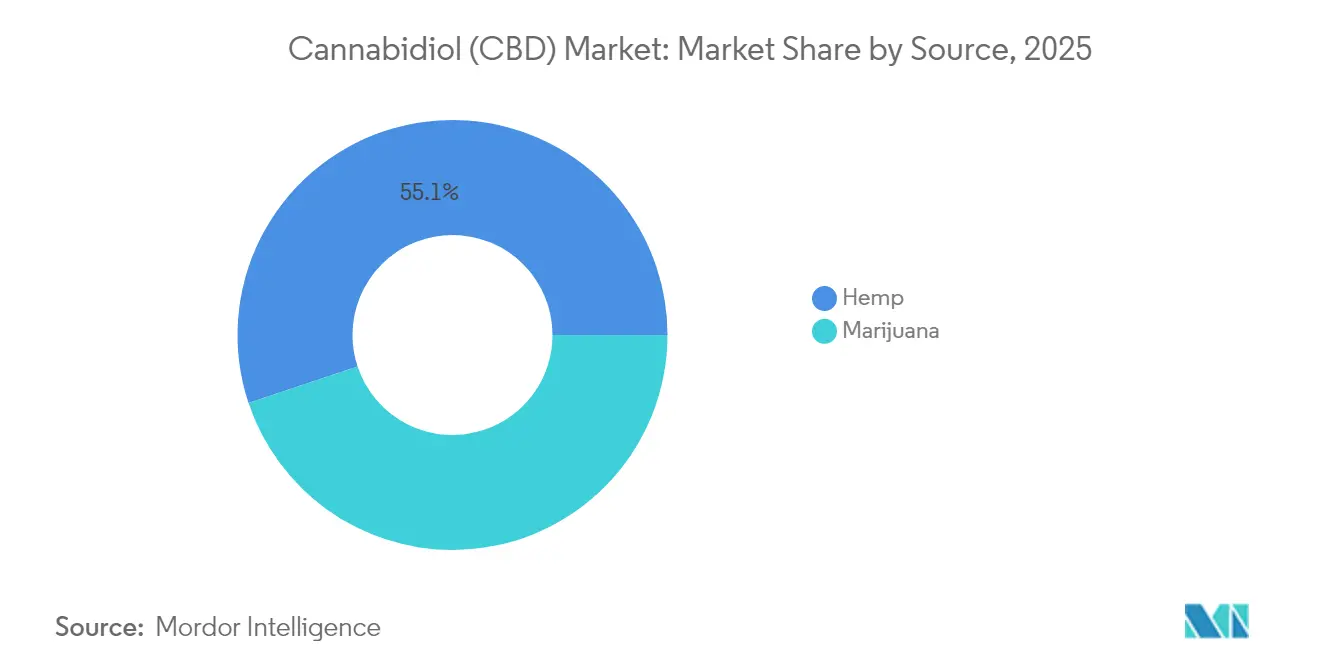
- By source, hemp accounted for a 55.12% share of the CBD market in 2025, while marijuana-derived CBD is set to grow at an 18.35% CAGR between 2026 and 2031.
- By end use, the pharmaceutical segment captured 40.91% of CBD market share in 2025; pet care is projected to expand at a 31.28% CAGR through 2031.
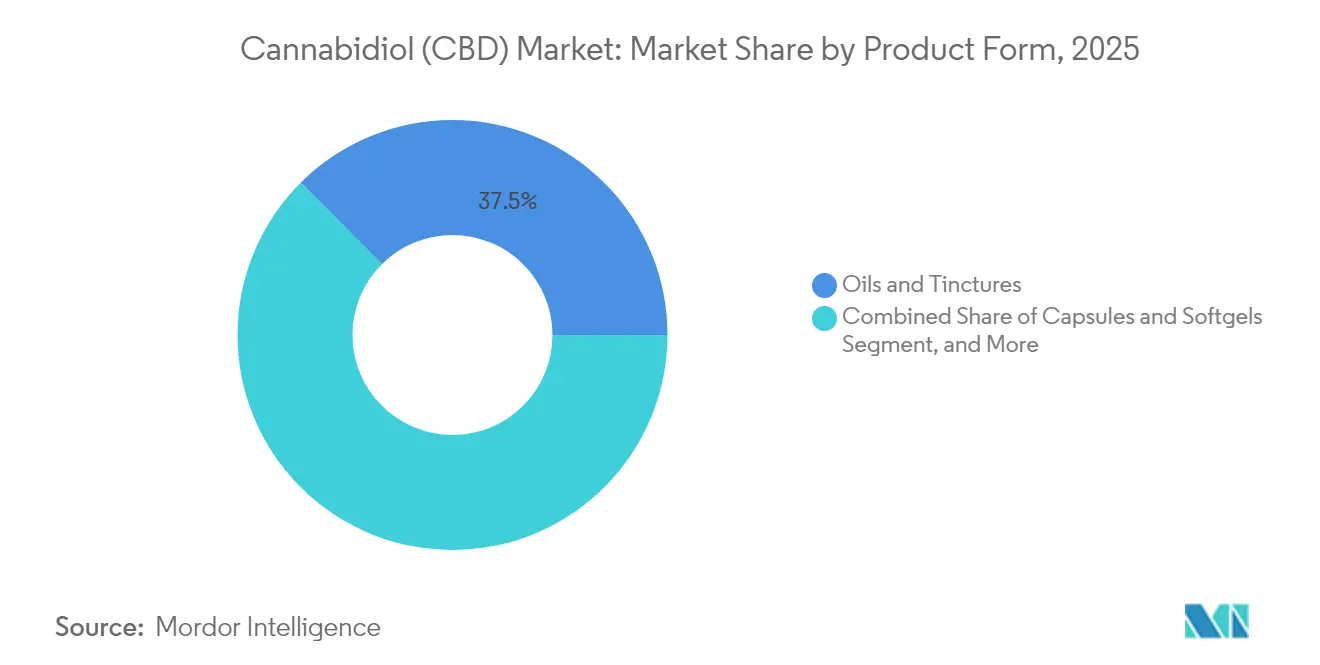
- By product form, oils & tinctures held 37.48% of CBD market share in 2025; gummies & confectionery are forecast to post a 29.35% CAGR to 2031.
- By distribution channel, retail stores led with a 46.02% revenue share in 2025; E-commerce is advancing at a 21.86% CAGR.
- By geography, North America accounted for 46.55% of 2025 revenue, whereas the Asia-Pacific region is estimated to chart a 19.74% CAGR through 2031.
Note: Market size and forecast figures in this report are generated using Mordor Intelligence’s proprietary estimation framework, updated with the latest available data and insights as of 2026.
Market Trends and Insights
Drivers Impact Analysis of Cannabidiol (CBD) Market*
| Driver | (~) % Impact on CAGR Forecast | Geographic Relevance | Impact Timeline |
|---|---|---|---|
| Chronic pain management driving prescription CBD uptake | +1.2% | North America; Europe | Medium term (2-4 years) |
| Regulatory pathways opening OTC CBD in pharmacy chains | +0.9% | North America; Japan | Short term (≤2 years) |
| Adoption of CBD-infused functional foods among aged population | +0.7% | Europe; North America | Medium term (2-4 years) |
| Increasing consumer health awareness | +0.5% | Global | Short term (≤2 years) |
| Rising integration of CBD in cosmetic and skincare formulations | +0.4% | Asia-Pacific; Europe | Medium term (2-4 years) |
| Expansion of online retail platforms and e-commerce penetration | +0.3% | Global | Short term (≤2 years) |
| Source: Mordor Intelligence | |||
Chronic Pain Management Driving Prescription CBD Uptake
Prescription adoption is climbing as CBD proves effective for refractory neurological disorders. Jazz Pharmaceuticals reported 46-87% median seizure reductions in multiple epilepsy types, and 89% of caregivers intend to continue Epidiolex therapy. Nurses documented seizure declines in 85% of treated cases, and behavioral improvements were observed in patients with tuberous sclerosis complex. These outcomes necessitate broader clinical trials for chronic pain, prompting pharmaceutical investment in cannabinoid research and development. United States rescheduling to Schedule III would facilitate FDA approval and pharmacy distribution, thereby expanding reimbursable access in the cannabidiol market.
Regulatory Pathways Opening for Over-the-Counter CBD in Pharmacy Chains
Japan’s December 2024 Cannabis Control Law revision permits medical cannabis products and introduces a tiered cultivation license, ending a decades-long “drug lag”.[1]GR Japan, “Cannabis Law Reform Summary,” grjapan.comIn the United States, the FDA acknowledges that present supplement rules cannot govern CBD, prompting legislative proposals while states enact divergent measures, such as California’s emergency ban on hemp foods with detectable THC.[2]FDA, “Cannabidiol Product Safety Update,” fda.govMainstream pharmacy groups are therefore preparing OTC shelves for compliant SKUs once federal clarity emerges, expanding the cannabidiol market.
Adoption of CBD-Infused Functional Foods Among Aged Population
Older consumers seek non-pharmaceutical relief for sleep, joint, and inflammatory issues, accelerating demand for functional foods fortified with cannabidiol. Le Herbe’s water-dissolvable powder leverages nanoemulsion to reduce onset to 15–30 minutes and triple shelf life. 3-D-printed tablets allow bespoke dosages, albeit at printer costs above USD 4,000 that limit near-term scaling. Enhanced bioavailability positions CBD beverages and snacks as routine dietary aids with further growth opportunities for the cannabidiol market.
Increasing Awareness among Consumers Regarding Health
Convenience-store surveys show that the majority of shoppers recognize the benefits of CBD, even though trial rates lag. Education campaigns stress correct dosage and COA verification, a strategy reinforced by Tilray’s hemp-derived delta-9 THC beverage roll-out as an alcohol alternative across large developed markets. National beverage chains stocking THC seltzers underscore the normalization of cannabinoid consumption within the expanding cannabidiol market.
Restraints Impact Analysis of Cannabidiol (CBD) Market*
| Restraint | (~) % Impact on CAGR Forecast | Geographic Relevance | Impact Timeline |
|---|---|---|---|
| Strict regulation on cannabidiol products | −1.4% | Japan; United States | Short term (≤2 years) |
| Price compression from oversupply of hemp biomass | −0.8% | North America | Short term (≤2 years) |
| Banking & insurance restrictions on CBD start-ups in developing countries | −0.5% | Latin America; Africa | Medium term (2-4 years) |
| Lack of uniform global regulatory frameworks and labeling standards | −0.4% | Global | Long term (≥4 years) |
| Source: Mordor Intelligence | |||
Strict Regulation on Cannabidiol Products
Japan enforces the world’s lowest THC threshold, demanding zero-detectable levels in imported CBD and limiting raw material to mature stalk and seed, thereby tightening supply channels.[3]USDA FAS, “Japan Hemp Market Report,” usda.govIn the United States, FDA’s stance that current supplement rules are “inadequate” sustains a federal vacuum, while California bans retail hemp foods with detectable THC. Unaligned rules raise compliance costs and delay nationwide rollouts.
Price Compression from Oversupply of Hemp Biomass
Hemp acreage planted boom still feeds inventories, forcing isolate prices downward and cutting brand counts from 4,000 to roughly 2,000. Charlotte’s Web responded by debuting CBN-led “Stay Asleep” gummies to capture premium sleep-aid demand. Ultrasonic and pressurized-liquid extraction allow purity gains that justify higher margins, yet processors without IP or scale exit the CBD market.
*Our forecasts treat driver/restraint impacts as directional, not additive. The impact forecasts reflect baseline growth, mix effects, and variable interactions.
Cannabidiol (CBD) Market Segment Analysis
By Source:
Hemp Commands Volume While Marijuana Gains Value MomentumHemp-derived products captured 55.12% of 2025 revenue as favorable legislation and established farming supply chains ensured consistent input quality. Full-spectrum CBD hemp oil formulations contain CBD alongside minor cannabinoids, terpenes, and flavonoids. The CBD market size for hemp formats is projected to expand at a mid-teens CAGR as ingestibles and cosmetics widen consumer reach. Demand for marijuana-derived extracts, however, is forecast to climb 18.35% annually between 2026 and 2031 as the entourage effect gains clinical backing and potential U.S. Schedule III status relaxes research barriers. The CBD market welcomes hybrid extraction methods such as Smokenol that capture smoke-borne terpenes, blurring traditional source distinctions and enabling tailored cannabinoid ratios for formulators.
Hemp’s legal clarity supports multinational retailers that require THC-free inventory, especially in Europe and parts of Asia. Marijuana-sourced CBD appeals to prescription channels where trace THC content is permissible under pharmacopoeia standards. As pharmaceutical trials broaden beyond epilepsy to pain and anxiety, vertically integrated cultivators with both hemp and marijuana licenses are best positioned to supply diversified APIs at scale.



By End Use:
Pharmaceuticals Lead Revenue; Pet Care Races AheadPharmaceutical applications generated 40.91% of 2025 sales, buoyed by Epidiolex’s USD 198.7 million Q1 2024 revenue and continued expansion into tuberous sclerosis and Lennox-Gastaut syndrome indications. This dominance translates into the highest CBD market share across end uses, with payers increasingly reimbursing cannabinoid prescriptions. The CBD market size for pet care, however, is forecast to advance at 31.28% CAGR as owners adopt functional chews and oils for arthritis, anxiety, and postoperative recovery in companion animals. Veterinary practitioners cite growing peer-reviewed evidence for canine osteoarthritis pain reduction, underpinning demand for GMP-grade tinctures.
Wellness and personal-use SKUs continue evolving toward targeted benefits. “Stay Asleep” CBN plus CBD gummies address the 67% of adults reporting sleep issues, illustrating how broadened cannabinoid profiles capture additional consumer need states. Such functional diversification boosts category resiliency against raw-material oversupply shocks.
By Product Form:
Oils & Tinctures Retain Pole Position While Gummies SurgeConsumers gravitate toward oils and tinctures for dosage flexibility, granting the format 37.48% revenue in 2025. Precise droppers and minimal excipients appeal to medically supervised regimens, sustaining trust among health-care providers. Gummies and confectionery, projected to grow 29.35% annually to 2031, attract first-time users who prefer familiar snack formats and tastemasked profiles. Alcohol-replacement trends further energize the CBD market size for gummies; Australian consumers cite cannabis gummies’ hangover-free benefit when choosing them over beer.
Advanced nanoemulsion shortens edible onset to under 30 minutes and boosts bioavailability, eroding oils’ speed advantage and expanding gummies’ evening-winding-down occasions. Topicals are likewise adopting water-soluble nano-drops to lift dermal absorption, underpinning the premiumization of cosmetic SKUs.
By Distribution Channel:
Brick-and-Mortar Still Commands Trust; E-Commerce AcceleratesRetail stores accounted for 46.02% of 2025 revenue, as shoppers value live staff guidance and instant product access. Pharmacies, wellness chains, and grocery banners broaden shelf space following clearer local statutes. Nonetheless, E-commerce is on a 21.86% CAGR trajectory. In the CBD market, patients dealing with chronic conditions often prefer one-click reordering and discreet delivery options to avoid stigma and maintain privacy.
Convenience retailers like Circle K expand pilot kiosks stocked with broad-spectrum gummies and seltzers, while Yesway’s Feel Good Shop+ curates impulse-purchase SKUs adjacent to energy drinks. Potential U.S. Schedule III rescheduling would channel FDA-approved cannabinoid drugs into hospital and specialty pharmacies, cementing medical supply chains that align with payer reimbursement and physician prescribing workflows.
Geography Analysis
North America and LATAM Cannabidiol (CBD) Market
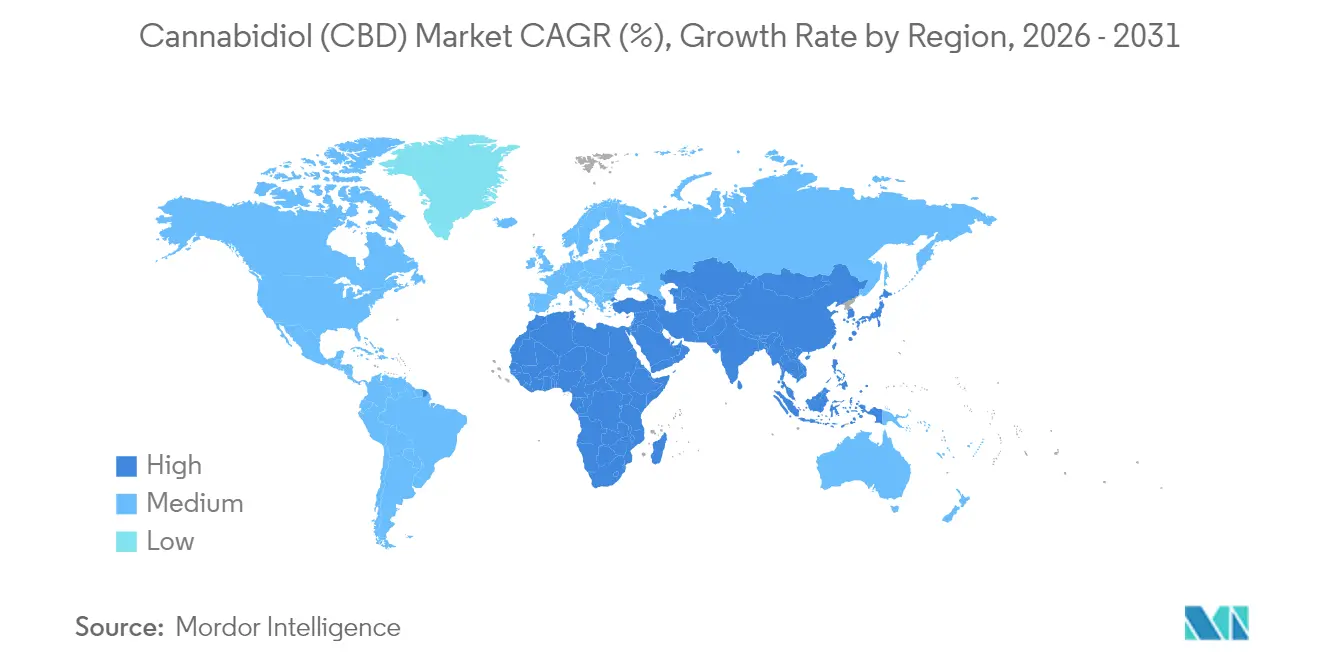
North America remained the epicenter of the CBD market with 46.55% revenue in 2025. Imminent federal rescheduling is expected to shrink illicit channels, reduce possession arrests, and catalyze double-digit investment in clinical trials. Consolidation is also reshaping the landscape; Cresco Labs’ USD 2 billion acquisition of Columbia Care exemplifies scale pursuit under tightening capital markets. Canada remains the hub for GMP-grade cannabinoid research, while Mexico’s pending secondary regulations could open Latin America’s most populous market.
APAC Cannabidiol (CBD) Market
Asia-Pacific is projected to post a 19.74% CAGR through 2031, propelled by Japan’s landmark reforms that legalize medical cannabinoid products. China’s beauty sector leads CBD adoption via cross-border e-commerce, with luxury serums commanding premium pricing. Australia’s Special Access Scheme facilitates prescription CBD for anxiety and insomnia, building physician familiarity and patient loyalty.
Europe Cannabidiol (CBD) Market
Europe presents sizable upside as Germany moves to decriminalize adult-use cannabis, lifting investor sentiment and reviving Canopy Growth’s European restructuring. The European Monitoring Centre for Drugs and Drug Addiction is drafting a harmonized CBD safety framework, addressing current patchworks that hamper trade. The UK emphasizes novel-food authorizations, fostering white-label supply chains. France and Italy accelerate medical-cannabis trials, stimulating pharmaceutical demand for GMP isolate and distillate.

Regulatory Landscape
Regulation continues to split between pharmaceutical and consumer pathways. In the United States, the FDA maintains that CBD cannot be marketed as a dietary supplement or added to food under the current statutory framework, while enforcement activity continues through warning letters and postmarket monitoring. In April 2026, the FDA also outlined limited enforcement-discretion conditions tied to physician-directed furnishing for certain hemp-derived CBD products within Medicare-linked contexts. On the controlled-substances side, an April 2026 Federal Register rule clarified the DEA Administrator's scheduling authority for FDA-approved drug products containing marijuana (or marijuana components), reinforcing an established compliance route for approved cannabinoid pharmaceuticals.
In Europe, CBD ingestibles face a high evidentiary bar under the Novel Food regime. In February 2026, the European Commission issued Implementing Decision C(2026) 683, terminating an authorization procedure for CBD from Cannabis sativa L. as a novel food without adding it to the Union list. EFSA, in February 2026, set a provisional safe intake level for CBD in novel food formulations (0.0275 mg/kg body weight per day), and in May 2026 published an opinion stating that safety for a specific CBD isolate novel food could not be established due to data gaps. For medicines, the EMA continues to manage cannabinoid product development through established procedures, including a January 2025 decision modifying the agreed paediatric investigation plan for Epidyolex (cannabidiol).
Competitive Landscape
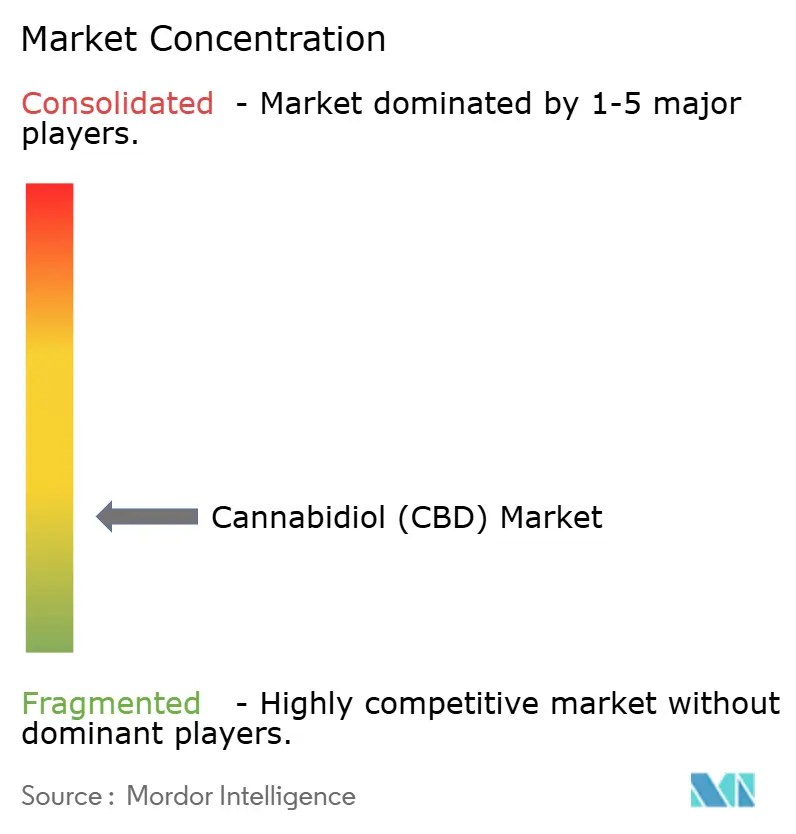
The CBD market exhibits fragmentation; top multinationals are pursuing vertical integration to control genetics, extraction, and branded distribution. Canopy Growth’s 2024 purchase of Wana and Jetty refocuses its United States strategy on high-margin edibles and solventless concentrates. CV Sciences’ USD 1.4 million acquisition of Extract Labs brings in-house manufacturing and CBD-isolate supply, improving gross margin resilience.
Pharma players anchor the prescription segment: Jazz Pharmaceuticals leverages GW’s IP estate to defend Epidiolex exclusivity while exploring cannabidiol combinations with standard anti-epileptics. Patents for novel delivery, including Real Isolates’ Smokenol, signal a rising R&D intensity and potential litigation barriers for late entrants. Meanwhile, Radicle Science and Open Book Extracts co-develop rigorously tested consumer products, responding to calls from retailers and consumers for transparency.
Startups capitalize on white spaces in the pet wellness, beauty, and sleep aid niches. Capital inflows favor firms with differentiated technology or proprietary genetics, leaving commodity tincture sellers vulnerable amid raw-material price compression. As branding dictates shelf impact, marketing spend shifts toward clinical substantiation and QR-code traceability to reassure cautious shoppers.
Cannabidiol (CBD) Industry Leaders
Cannoid LLC
Medical Marijuana, Inc
Nuleaf Naturals LLC
Elixinol Wellness Ltd.
Aurora Cannabis Inc.
- *Disclaimer: Major Players sorted in no particular order
Cannabidiol (CBD) Market Companies Covered in this Report
- Canopy Growth
- Charlotte’s Web Holdings Inc.
- Jazz Pharmaceuticals plc (GW Pharmaceuticals)
- Tilray Brands Inc.
- Aurora Cannabis Inc.
- CV Sciences
- Medical Marijuana
- Elixinol Wellness Ltd.
- Endoca BV
- NuLeaf Naturals
- Pharmahemp d.o.o.
- Isodiol International Inc.
- Medterra CBD
- Green Roads LLC
- Cannoid
- Pet Releaf
- Lazarus Naturals
- HempMeds Brasil
- Holistic Hound
- Kazmira LLC

Market Opportunities and Future Outlook
Pharmaceutical-grade CBD market access is expanding through clearer, country-specific authorization pathways and drug-development milestones. In the United States, April 2026 actions combined a controlled-substances compliance clarification for FDA-approved marijuana-derived drug products (Schedule III handling for approved products) with an FDA enforcement-discretion posture that is narrower and more clinical in nature. That combination creates room for compliant CBD offerings that align more closely with healthcare delivery than general retail supplementation. In Brazil, ANVISA published Resolution RDC No. 1.015 in February 2026 (effective May 4, 2026), establishing requirements for manufacturing, importing, and commercializing CBD or Cannabis sativa L. extract products for human medicinal use, and defining a route for registered operators and contract manufacturers serving the regulated medical channel.
Product and supply-chain differentiation is shifting away from commodity tinctures toward regulated formulations, novel delivery approaches, and alternative inputs. A notable proof point is India, where Zenara Pharma received CDSCO approval in July 2026 for a 150 mg/mL synthetic CBD oral solution for mild-to-moderate anxiety, developed with Leiutis Pharmaceuticals LLP. The approval highlights a pathway that bypasses botanical THC-threshold variability and can fit conventional pharmaceutical quality systems. At the same time, EU novel-food scrutiny and EFSA safety data requirements are tightening near-term whitespace toward topical cosmetics in permissive jurisdictions and toward prescription or medically supervised use cases globally, leaving brands with defensible IP (bioavailability technologies, validated COAs, and GMP-grade supply) with stronger positioning in pharmacy and reimbursable ecosystems compared with general wellness SKUs.
Recent Industry Developments in Cannabidiol (CBD) Market
- April 2026: NuLeaf Naturals began pursuing participation in the CMS Innovation Center's Beneficiary Engagement Incentive (BEI) pilot program launched April 1, 2026, positioning eligible hemp-derived CBD products to be furnished to Medicare beneficiaries under defined conditions. The move aligns consumer-facing CBD with healthcare engagement models and raises documentation, quality, and compliance expectations for products used in covered populations.
- March 2026: NuLeaf Naturals joined the National Compassionate Care Council (NCCC) as a founding member to support development of U.S. federal and state cannabinoid therapy policy. Participation increases the company's visibility in policy shaping and can influence how CBD therapies are framed across regulated medical access, labeling, and standards discussions.
- January 2026: Medical Marijuana, Inc. entered a strategic alliance with AXIM Biotechnologies, Inc. to research and develop applications for AXIM's U.S. Patent No. 11,542,226 B2 covering water-soluble cannabinoids, under a one-year consulting arrangement with a monthly service fee of USD 62,500. The collaboration targets formulation capabilities that can improve bioavailability and enable new ingestible formats, supporting differentiation beyond commodity hemp inputs.


Cannabidiol (CBD) Market Report Scope and Research Methodology
Market Definition and Coverage
For this methodology, the cannabidiol market covers the value of CBD ingredients and finished CBD products sold through legal channels for pharmaceutical, wellness, personal care, and related uses, across major global regions. We size it in value terms at the point of sale into the market.
Scope exclusions: We exclude illegal or untracked sales and avoid double counting intermediate CBD trades that do not reflect final market consumption.
Segments Covered in This Report
- By Source
- Hemp
- Marijuana
- By End Use
- Pharmaceuticals
- Wellness & Personal Use
- Food & Beverages
- Cosmetics & Skin Care
- Pet Care
- Nutraceuticals & Supplements
- By Product Form
- Oils & Tinctures
- Capsules & Softgels
- Gummies & Confectionery
- Topicals / Skin Care
- Vape Products
- Others
- By Distribution Channel
- Hospital & Specialty Pharmacies
- Retail Stores
- E-commerce
- Medical Dispensaries
- By Geography
- North America
- United States
- Canada
- Mexico
- Europe
- Germany
- United Kingdom
- France
- Italy
- Spain
- Rest of Europe
- Asia-Pacific
- China
- Japan
- India
- Australia
- South Korea
- Rest of Asia-Pacific
- Middle East & Africa
- GCC
- South Africa
- Rest of Middle East & Africa
- South America
- Brazil
- Argentina
- Rest of South America
- North America
Data Sources, Market Sizing, and Validation
Desk Research
Desk research was used to build the basic market structure and to anchor the model to observable signals such as legal status, product formats, and channel presence across regions. We relied on public sources such as the US FDA (CBD and cannabis related communications), the US National Institutes of Health (including PubMed indexed literature), the European Monitoring Centre for Drugs and Drug Addiction, and UNODC publications to understand policy context and demand drivers.
To quantify inputs, we also reviewed statistics and releases from sources such as the US Census Bureau (retail and trade series where relevant) and the US International Trade Commission data portals for trade context, and we used selected peer reviewed clinical and safety publications that influence adoption. Company filings, investor presentations, reputable press coverage, and trusted association websites were used to cross-check product mix and channel shifts. Paid subscriptions were used selectively for company financials and intelligence, news and financials screening, patent databases, and an import and export shipment-level database to validate supply-side direction. The desk sources listed here are illustrative, and many other public datasets and documents were also used for data collection, validation, and clarification.
Primary Interviews and Surveys
Primary work focused on validating what is actually being sold, where it is sold, and how pricing is moving by form and channel. We interviewed a mix of ingredient suppliers, brand owners, distributors, and channel participants, and then cross-checked assumptions by region so that gaps from desk research could be closed with practical inputs.
Distribution of primary research fieldwork respondents
| Company type | Respondent position | Region |
|---|---|---|
| Top tier: 28% | CXOs: 14% | APAC: 42% |
| Mid tier: 54% | Functional/Unit leaders: 34% | EMEA: 35% |
| Smaller Players: 18% | Managers: 52% | Americas: 23% |
Market-Sizing & Forecasting
Sizing was built using a top-down and bottom-up approach, where the main totals are reconstructed from region-level demand pools and then checked against supplier and channel signals before finalization. On the top-down side, we used a penetration and consumption build-up by region that ties CBD demand to the addressable base of legal access and typical purchasing behavior, and then converts it into value through observed price bands.
A few key inputs that shaped the model include the split of hemp-derived versus marijuana-derived CBD where legally relevant, the mix of product forms (such as oils and tinctures, capsules and softgels, and other common formats), the share of sales moving through hospital and specialty pharmacies versus retail stores and other channels, and the direction of average selling prices as potency, compliance testing, and formulation shift over time. Where direct data was thin, selective bottom-up approximations were used, such as sampled brand and channel price checks, supplier capacity and utilization cues, and revenue range checks from public financial disclosures, which were then adjusted to avoid double counting between ingredient and finished product value.
For forecasting, we used scenario analysis supported by an exponential smoothing style trend layer for price and channel mix, because regulation timing and product standardization can change demand quickly. Assumptions for legalization pace, channel expansion, and pricing normalization were stress-tested with primary inputs so the forecast is explainable and repeatable.
Data Validation & Update Cycle
Outputs were validated through multiple passes, starting with basic arithmetic checks, currency and unit consistency checks, and year-on-year variance reviews by region and by major form and channel. The model was also compared with independent signals such as regulatory milestones, visible retail expansion patterns, and shifts in product format adoption, and then revised when gaps were found.
Before sign-off, a second analyst review is done to re-check assumptions, confirm that exclusions were applied consistently, and ensure the narrative matches the numbers. The report is refreshed annually, and we also trigger interim updates when material events occur (for example, major regulatory changes or sudden price movements). Right before delivery, a final pass is completed so clients receive the most current view available.
Mordor Intelligence's Cannabidiol Market Estimate Compared With Other Published Estimates
Published CBD market values can look far apart because the market is still shaped by changing rules, mixed product definitions, and differences in where revenue is counted. Some studies size only consumer packaged goods, while others also count bulk CBD ingredients, pharmacy-led sales, or certain high-THC adjacent items, which changes the total quickly.
The biggest gap drivers we see are scope choices (ingredient versus finished products, and inclusion of hemp-derived versus marijuana-derived CBD), the handling of channels like hospital and specialty pharmacies versus general retail, and how price trends are projected when compliance testing and potency mix shift. When intermediate ingredient trades are kept out and channel-level pricing by form is refreshed during updates, the 2026 value stays closer to real consumption patterns, which is why it is modeled that way in Mordor Intelligence.
Benchmark comparison
| Source | Market Size | Gaps in Research Methodology |
|---|---|---|
| Mordor Intelligence | USD 11.64 B (2026) | |
| Trade Journal A | USD 9.10 B (2024) | Uses an earlier base year and often blends CBD definitions across product and ingredient revenue, which can understate later-year channel expansion and updated price bands. |
| Industry Publisher B | USD 9.70 B (2024) | Focuses on nutraceutical-oriented CBD demand and may exclude pharmacy-led sales and some personal care formats, which compresses the measured demand pool and value total. |
The table shows that a large share of the spread comes from the year selected and from what is counted as CBD revenue versus adjacent cannabis items or intermediate ingredient flows. By keeping the scope tied to legal, trackable sales and by checking the totals with channel and pricing signals, we end up with a market size that can be traced back to clear, repeatable inputs.


Key Questions Answered in the Report
What is the current global CBD market size?
The CBD market size stands at USD 11.64 billion in 2026.
What is the forecast compound annual growth rate (CAGR) for the CBD market to 2031?
The market is projected to expand at a 15.94% CAGR and reach USD 24.39 billion by 2031.
Which application segment holds the largest CBD market share?
The pharmaceutical segment led with 40.91% revenue share in 2025.
Which geographic region is expected to grow fastest through 2031?
Asia-Pacific is forecast to post a 19.74% CAGR, the highest among all regions.
What technology is improving CBD product bioavailability and onset time?
Nanoemulsion technology shortens onset to 15–30 minutes and boosts absorption.
How could U.S. Schedule III rescheduling affect CBD pharmaceuticals?
Rescheduling would allow FDA approval of cannabinoid drugs for pharmacies, expanding prescription access and accelerating R&D investment.
Page last updated on:


 Your data is secure and never sold or shared.


