Enterprise Mobility In Manufacturing Market Size and Share
Market Overview
| Study Period | 2019 - 2030 |
|---|---|
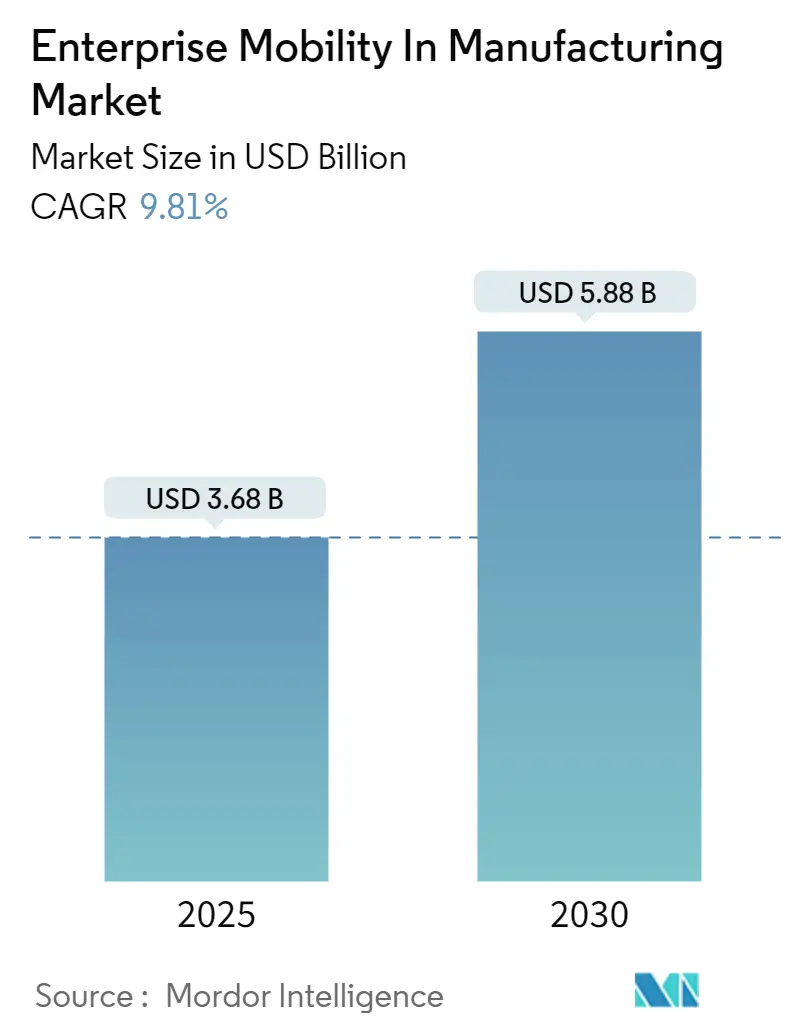
| Market Size (2025) | USD 3.68 Billion |
| Market Size (2030) | USD 5.88 Billion |
| Growth Rate (2025 - 2030) | 9.81% CAGR |
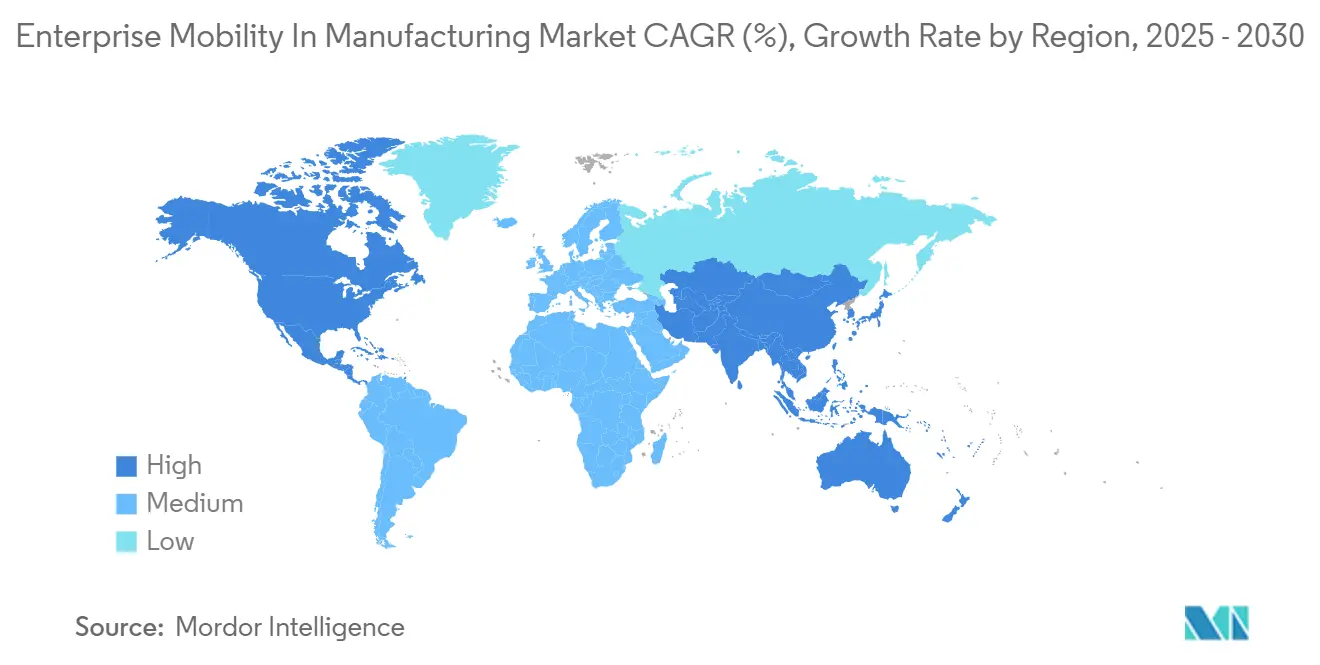
| Fastest Growing Market | Asia Pacific |
| Largest Market | North America |
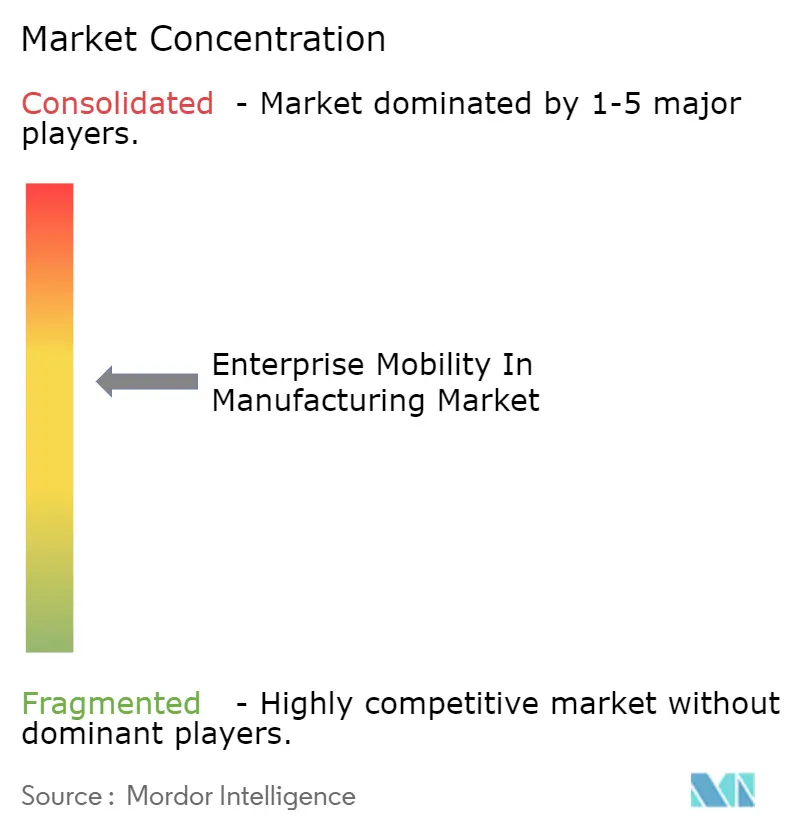
| Market Concentration | Medium |
Major Players *Disclaimer: Major Players sorted in no particular order Image © Mordor Intelligence. Reuse requires attribution under CC BY 4.0. | |
Enterprise Mobility In Manufacturing Market Analysis by Mordor Intelligence
The enterprise mobility in manufacturing market size was USD 3.68 billion in 2025 and is forecast to reach USD 5.88 billion by 2030, expanding at a 9.8% CAGR. The uptrend mirrors the sector’s rapid transition toward Industry 4.0, where mobile-enabled workflows shorten response times, elevate asset visibility, and reinforce operational resilience. Growing deployment of private 5G networks, tighter integration between mobile devices and Manufacturing Execution Systems (MES), and the spread of edge-based augmented-reality applications collectively widen use cases for shop-floor mobility. Yet only 16% of manufacturers enjoy real-time production visibility, underscoring the sizeable headroom for digital tools that dissolve long-standing information silos. Cyber-physical security gaps and data-sovereignty constraints temper adoption, pushing vendors toward zero-trust architectures and region-specific cloud strategies.
Key Report Takeaways
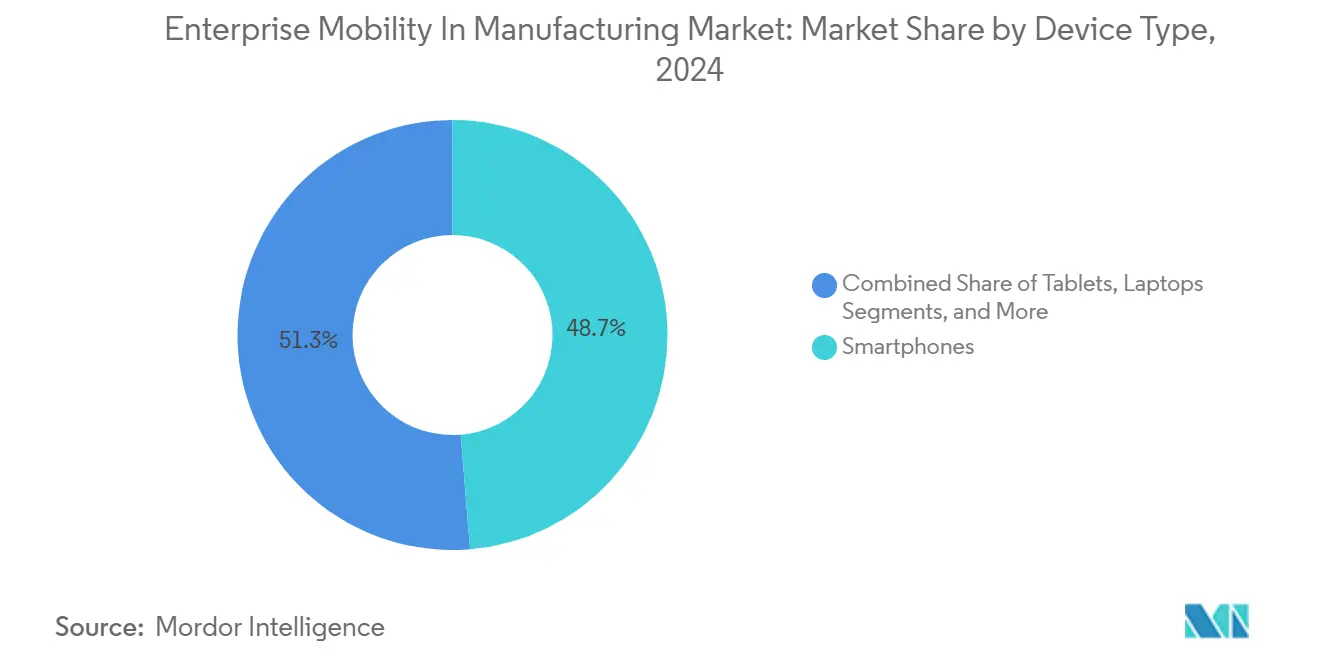
- By device type, smartphones captured 48.7% of the enterprise mobility in manufacturing market share in 2024, whereas wearables are advancing at a 9.9% CAGR through 2030.
- By solution, Mobile Device Management accounted for 46.2% share of the enterprise mobility in manufacturing market size in 2024; Unified Endpoint Management is rising at a 10.1% CAGR to 2030.
- By deployment mode, on-premise installations held 67.8% share in 2024, while cloud deployments are scaling at an 11.5% CAGR to 2030.
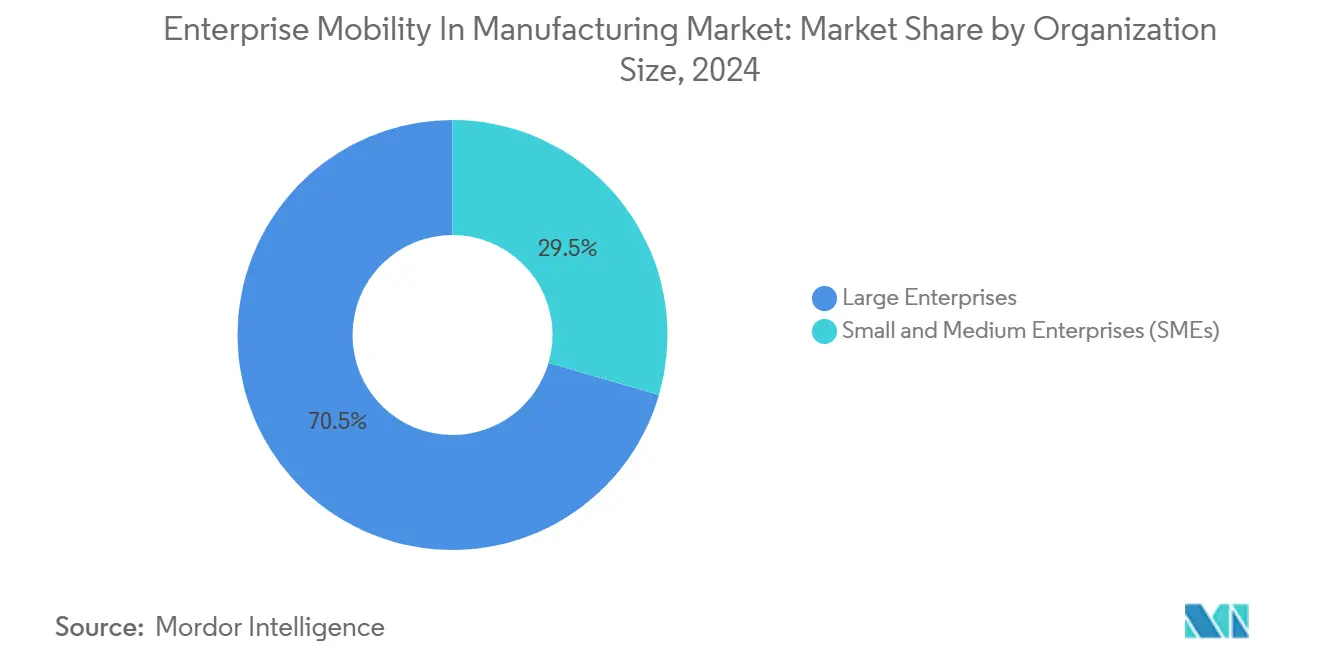
- By organization size, large enterprises dominated with 70.5% share in 2024; small and medium enterprises (SMEs) are forecast to grow at an 11.2% CAGR during 2025-2030.
- By manufacturing vertical, discrete manufacturing commanded 68.9% of the enterprise mobility in manufacturing market size in 2024; process manufacturing is on track for a 10.6% CAGR.
- By geography, North America led with 39.1% revenue share in 2024, whereas Asia-Pacific is projected to grow at a 10.4% CAGR.
Global Enterprise Mobility In Manufacturing Market Trends and Insights
Drivers Impact Analysis*
| Driver | (~) % Impact on CAGR Forecast | Geographic Relevance | Impact Timeline |
|---|---|---|---|
| Accelerating Industry 4.0 and IIoT adoption | +2.1% | Global, early gains in Germany, China, South Korea | Medium term (2-4 years) |
| BYOD/CYOD policies expand connected workforce | +1.8% | North America and EU, spill-over to APAC | Short term (≤ 2 years) |
| Private 5G and Wi-Fi 6 enable low-latency mobility | +1.5% | APAC core, expanding to North America | Medium term (2-4 years) |
| Integration of mobile devices with MES and cloud PLM | +1.3% | Global, automotive and electronics hubs | Long term (≥ 4 years) |
| Edge-powered AR and digital twins boost rugged-tablet demand | +1.2% | North America, Germany, Japan | Medium term (2-4 years) |
| Paperless ESG compliance drives mobile e-logbooks | +0.9% | EU leading, North America following | Long term (≥ 4 years) |
| Source: Mordor Intelligence | |||
Accelerating Industry 4.0 and IIoT adoption
Manufacturers are scaling Industrial Internet of Things deployments from proof-of-concept projects to plant-wide rollouts, linking sensors, machines, and mobile endpoints into unified data loops. Eighty-three percent of producers intend to embed generative AI in decision support during 2024, reflecting confidence that mobile dashboards can operationalize complex analytics at the edge.[1]Rockwell Automation, “State of Smart Manufacturing Report 2024,” rockwellautomation.com The pronounced impact shows in process plants where mobile cyber-physical systems let operators tweak parameters remotely in minutes rather than hours. Asian factories lead readiness, with 53% of managers targeting autonomous operations by 2040 compared to under half in Western facilities. Increased IIoT maturity lifts demand for rugged smartphones that merge scanning, visualization, and voice in a single device, streamlining maintenance and quality tasks. Vendors in the enterprise mobility in manufacturing market that pre-integrate hardware with low-code app builders shorten deployment cycles and reduce IT overhead.
BYOD/CYOD policies expand connected workforce
Factory policies are shifting from restrictive device rules toward structured Bring-Your-Own-Device and Choose-Your-Own-Device programs that broaden workforce access to digital tools. Sixty-three percent of manufacturers already tolerate personal devices on the floor, yet only 17% run formal BYOD frameworks, signalling a wide adoption gap. Formalized schemes enhance agility during labor shortages by enabling new hires to onboard with familiar equipment. Samsung’s eight-step CYOD blueprint highlights the need for executive sponsorship, risk-based segmentation, and user training to safeguard data while sustaining productivity. Successful rollouts embed enterprise credentials into secure containers, route traffic through zero-trust gateways, and synchronize with MES and ERP back ends. Early adopters report shorter shift handovers and lower provisioning costs relative to a corporate-only hardware fleet.
Private 5G and Wi-Fi 6 enable low-latency mobility
Dedicated cellular networks inside factories eliminate the contention and roaming delays that hamper legacy Wi-Fi, delivering deterministic sub-10 ms latency for automated guided vehicles and safety interlocks. Deployments show double-digit throughput gains and sharper positioning accuracy, enabling mobile human-machine interfaces (HMIs) to handle time-critical controls formerly restricted to fixed panels. Hybrid 5G/Wi-Fi 6 architectures segment traffic by need: 5G handles tele-robotics and vision-guided lifting, while Wi-Fi serves label printing and engineering collaboration. Early adopters record fewer production halts and higher overall equipment effectiveness, validating the investment case for spectrum licenses and edge cores. Equipment vendors are now bundling private-network starter kits with mobile apps and analytics subscriptions to simplify entry for midsize plants.
Integration of mobile devices with MES and cloud PLM
Linking smartphones and tablets to Manufacturing Execution Systems delivers real-time production KPIs, electronic batch records, and digital work instructions directly to frontline staff. Companies that paired mobile interfaces with MES experienced 30% administrative time savings and USD 2.2 million operator productivity gains in year one. Discrete manufacturers add further value by feeding in-process quality metrics to cloud Product Lifecycle Management platforms, enabling engineers to adjust designs within the same shift. Cloud deployment eases data aggregation across multi-site operations, while mobile front ends keep critical information accessible in low-visibility or hazardous areas. Sustained returns depend on role-based user experience design and tight identity management that secures intellectual property across global sites in the enterprise mobility in manufacturing market.
Restraints Impact Analysis*
| Restraint | (~) % Impact on CAGR Forecast | Geographic Relevance | Impact Timeline |
|---|---|---|---|
| Cybersecurity vulnerabilities and mobile malware | -1.4% | Global, acute in critical infrastructure sectors | Short term (≤ 2 years) |
| Legacy OT integration complexity | -1.1% | North America and EU manufacturing heartlands | Medium term (2-4 years) |
| Data-sovereignty barriers to mobile cloud | -0.8% | EU leading, expanding to APAC and select US states | Long term (≥ 4 years) |
| Limited supply of ATEX-certified intrinsically safe devices | -0.6% | Global, oil and gas, chemical, mining regions | Medium term (2-4 years) |
| Source: Mordor Intelligence | |||
Cybersecurity vulnerabilities and mobile malware
The fusion of IT and OT domains leaves production assets more exposed, with 93% of firms recording an OT intrusion last year while only 13% enjoy consolidated oversight. Mobile endpoints enlarge the attack surface as legacy antivirus and patch cycles rarely align with continuous operations. Ransomware campaigns increasingly target human-machine interface tablets, locking out supervisors from control systems. Manufacturers counter with micro-segmentation, mobile threat defense agents, and strict least-privilege policies, yet shortages in dual-skilled security professionals slow program maturity. Insurance underwriters respond by demanding proof of zero-trust frameworks before renewing cyber-risk coverage, adding financial pressure to remediate weaknesses.
Legacy OT integration complexity
Decades-old programmable logic controllers, proprietary fieldbuses, and serial gateways complicate any plan to route plant data to modern apps. Many factories lack up-to-date asset inventories, forcing manual mapping before mobile pilots can start. Integration projects thus span electrical retrofits, protocol converters, and middleware investments that stretch budgets and extend timelines. Organizational friction intensifies the challenge as IT and OT teams operate with distinct metrics and change-control procedures. Progressive plants address the divide through joint governance boards, phased modernization road-maps, and shared incident response playbooks. Even so, brownfield constraints remain a material drag on widespread mobility rollouts across mature regions.
*Our forecasts treat driver/restraint impacts as directional, not additive. The impact forecasts reflect baseline growth, mix effects, and variable interactions.
Segment Analysis
By Device Type: Smartphones Lead Despite Wearable Surge
The smartphones segment of enterprise mobility in manufacturing market generated 48.7% of total revenue in 2024, confirming smartphones as the primary mobile gateway for factory staff in the enterprise mobility in manufacturing market. Their all-in-one scanning, voice, and data functions cut hardware counts and lighten IT provisioning. Over the review period, vendors ruggedized form factors with MIL-STD-810H housings, hot-swappable batteries, and glove-friendly touchscreens, widening suitability for harsh shop-floor conditions. Operators value integrated cameras for remote assistance and AI-driven defect recognition, while supervisors exploit high-resolution displays for KPI dashboards during gemba walks.
The wearables sub-segment nonetheless records a 9.9% CAGR, propelled by hands-free picking, heads-up maintenance, and ergonomic load balancing. Smart glasses paired with digital twins reduce cognitive effort by overlaying repair steps and sensor trends in the worker’s line of sight. Tablets anchor quality-assurance benches and engineering work cells where larger screens support CAD drawings and deviation logs. Laptops remain niche-bound to simulation and MES administration tasks that demand full keyboards. Emerging smart rings and industrial handhelds cluster under “other” but signal continual experimentation with task-specific form factors that could reshape device hierarchies as 2030 approaches.


By Solution: MDM Dominance Faces UEM Challenge
Mobile Device Management held 46.2% revenue in 2024 in the enterprise mobility in manufacturing market, a reflection of its long tenure as the compliance backbone for corporate-owned phones. MDM suites enforce password hygiene, remote wipe, and application whitelists, aligning with audit mandates under ISO 27001 and NIST CSF guidelines. However, the shift toward heterogenous fleets spanning laptops, scanners, and IoT sensors elevates Unified Endpoint Management to a 10.1% CAGR.[2]IBM Newsroom, “IBM to Acquire HashiCorp,” ibm.com
UEM consolidates policy orchestration and patch status across Windows, Android, iOS, and Linux, reducing duplicated administrative effort. Manufacturing clients gravitate to UEM’s automation hooks that trigger remedial actions when a device crosses geofences or anomalous traffic trips a zero-trust rule. Mobile Application Management delivers containerization where personal devices participate in BYOD schemes, isolating corporate data without owning the hardware. Stand-alone mobile security plugins add machine-learning-based threat hunts, an asset in plants subject to critical infrastructure standards. Across all solution types, the momentum favors modular subscription bundles that flex with project scope and integrate native analytics consoles to evidence ROI for finance teams.
By Deployment Mode: Cloud Adoption Accelerates
On-premise systems retained a 67.8% share in 2024, consistent with long-standing preferences for local control over sensitive intellectual property and deterministic latency. Many plants reside in rural zones where intermittent connectivity advocates for self-contained control loops. Yet cloud deployments are compounding at 11.5% as hyperscalers bolster regional availability zones and deliver manufacturing-specific blueprints. Smaller suppliers leverage SaaS consoles to enroll hundreds of devices in hours, a process that once required imaging labs and enterprise agreements.
Hybrid architectures knit edge nodes to cloud dashboards, letting workloads swing between the two depending on latency tolerance. Automatic firmware updates, telemetry-driven support, and usage-based billing appeal to CFOs keen on capex-to-opex conversions. Security postures improve through shared-responsibility models where providers maintain hardened infrastructure, freeing internal teams to focus on identity governance. Regulatory bodies in the EU and selected US states impose data-residency clauses, steering multinationals toward sovereign-cloud regions and privacy gateways in the enterprise mobility in manufacturing market.
By Organization Size: SME Growth Outpaces Enterprise Adoption
Large enterprises accounted for 70.5% of 2024 revenue in the enterprise mobility in manufacturing market, owing to complex operations that necessitate wide-area device fleets and tight integration with ERP, PLM, and SCADA layers. Multi-site plants standardize on single mobility stacks to ease support, often negotiating global master service agreements that bundle software, connectivity, and rugged hardware maintenance. Nevertheless, SMEs are expanding at an 11.2% CAGR, fuelled by low-code app builders, pay-as-you-go device leasing, and managed service offers that bypass deep IT investments.
These firms cherry-pick high-impact use cases like cycle-count automation, e-kanban restock alerts, and maintenance ticketing to secure swift payback. Success hinges on intuitive user interfaces that minimize training and on partner ecosystems that provide implementation templates. As labor constraints bite, SMEs prize mobility to cross-skill staff and embed digital standard work, suggesting continued outperformance in the segment through 2030.
By Manufacturing Vertical: Discrete Manufacturing Leads Process Adoption
Discrete manufacturing supplied 68.9% of segment turnover in 2024, spearheaded by automotive, electronics, and aerospace plants that orchestrate a multitude of sub-assemblies and just-in-time logistics. Mobile scanning bridges assembly and warehouse zones, while digital work instructions replace static binders, lifting first-pass yields. Process manufacturers, though historically slower to adopt due to continuous-flow constraints, now post a 10.6% CAGR as pharmaceuticals, chemicals, and food processors integrate mobility for batch record compliance, hazard management, and operator rounds.
Mobile intrinsically safe devices penetrate oil, gas, and mining, enabling inspection in Zone 1 areas without hot-work permits. Vertical nuance shapes app design: automotive lines demand vehicle-identification "birth certificates" accessible via QR codes, whereas life-science facilities require electronic signatures to satisfy FDA 21 CFR Part 11. Suppliers with domain templates accelerate time-to-value by pre-configuring workflows around these industry regulations.
Geography Analysis
North America led the enterprise mobility in manufacturing market with 39.1% of 2024 global revenue, benefiting from entrenched automation cultures and well-funded digitization road-maps in the enterprise mobility in manufacturing market. United States automotive and aerospace clusters upgrade existing mobility pilots to enterprise scopes, layering 5G campus networks over brownfield PLCs to support autonomous material handling and predictive service. Canada’s food-processing sector rises as a niche adopter, harnessing tablets for allergen control and cold-chain documentation.
Europe follows, anchored by Germany’s Industry 4.0 program and its Mittelstand champions that retrofit legacy machine parks with mobile dashboards. French pharmaceuticals employ intrinsically safe smartphones for clean-room documentation, while Italian machinery firms deploy augmented-reality wearables for remote field service. EU General Data Protection Regulation drives high demand for on-device encryption and data-sovereign cloud options, shaping procurement criteria across the bloc.
Asia-Pacific is the fastest-growing territory, posting a 10.4% CAGR as China, India and Southeast Asian economies leapfrog legacy systems. Chinese electronics giants deploy private 5G slices across megafactories to coordinate human and robotic tasks. India’s government incentives under the Production Linked Incentive scheme accelerate SME adoption of cloud-based mobility dashboards. Singapore and South Korea spearhead pilot zones where smart-glasses equipped technicians interface with digital twins hosted in sovereign clouds. The region’s momentum signals a potential shift in revenue leadership beyond 2030 as plants embrace high-density automation paired with mobile workforce augmentation.

Competitive Landscape
Market structure remains moderately concentrated as diversified software giants, industrial automation specialists and rugged-hardware vendors jostle for wallet share. Microsoft strengthens its foothold through an eight-year, USD 1.65 billion alliance with Cloud Software Group, positioning Azure as a preferred platform for Citrix virtual workspaces in manufacturing back rooms.[3]Citrix, “Citrix and Microsoft Expand Partnership,” citrix.com
VMware’s former End-User Computing assets re-emerge under KKR ownership, sharpening focus on cross-platform digital workspaces tuned for shop-floor latency and rugged use cases. Strategic consolidation accelerates as players knit mobility into broader cloud and AI portfolios. IBM’s USD 6.4 billion acquisition of HashiCorp injects infrastructure-as-code and secrets management into its hybrid-edge blueprint, simplifying secure device onboarding at scale. ServiceNow’s USD 2.85 billion purchase of Moveworks adds agentic AI chatbots that triage frontline support requests, easing help-desk loads in multi-site plants.
Industrial device maker Zebra Technologies pairs with Merck KGaA on the M-Trust authenticity platform, blending TC58 handhelds, secure barcodes and cloud blockchain to counter supply-chain counterfeit risks. Zebra further partners with Google Cloud and Qualcomm to embed generative AI that guides operators through pick-and-place tasks with voice prompts and real-time anomaly detection. Across the landscape, vendors that pre-integrate mobile management with MES, ERP and IIoT stacks gain competitive edge as buyers prefer unified ecosystems over point solutions.
Enterprise Mobility In Manufacturing Industry Leaders
Blackberry Limited
Cisco Systems, Inc.
Citrix Systems, Inc.
Microsoft Corporation
McAfee, LLC
- *Disclaimer: Major Players sorted in no particular order

Recent Industry Developments
- March 2025: ServiceNow announced the USD 2.85 billion acquisition of Moveworks to embed agentic AI across enterprise workflows, targeting manufacturing productivity gains.
- March 2025: Zebra Technologies and Merck KGaA revealed the M-Trust platform, combining TC58 scanners with authentication tech to combat counterfeit components.
- April 2024: Cloud Software Group and Microsoft entered an eight-year, USD 1.65 billion partnership making Citrix preferred on Azure for enterprise desktops.
- February 2024: KKR finalized the USD 4 billion takeover of VMware’s End-User Computing division, forming a dedicated digital workspace entity for industrial customers.


Global Enterprise Mobility In Manufacturing Market Report Scope
The Enterprise Mobility in Manufacturing Market is segmented by Device Type (Smartphones, Tablets, Laptops, Wearables, and Other Device Types), Solution (Mobile Device Management (MDM), Mobile Application Management (MAM), Mobile Security and Threat Defense, Unified Endpoint Management (UEM), and Other Solutions), Deployment Mode (On-Premise and Cloud), Organization Size (Large Enterprises and Small and Medium Enterprises (SMEs)), Manufacturing Vertical (Discrete Manufacturing (Automotive, Electronics & Semiconductor, Aerospace & Defense, Industrial Machinery, and Others) and Process Manufacturing (Food & Beverage, Pharmaceuticals & Life Sciences, Chemicals, Oil & Gas, Metals & Mining, and Others), and Geography (North America, Europe, Asia-Pacific, South America, and Middle East & Africa). The Market Forecasts are provided in terms of value (USD).
| Mainframe Computers |
| Minicomputers |
| Microcomputers |
| Workstations |
| Servers |
| Blade Servers |
| Rack Servers |
| Cloud-Based Host Computers |
| On-Premises Host Computers |
| Hybrid Deployments |
| Data Processing |
| Cloud Computing |
| Virtualization |
| Networking |
| Big Data Analytics |
| Artificial Intelligence And Machine Learning |
| High-Performance Computing (HPC) |
| IT And Telecom |
| Banking, Financial Services, And Insurance (BFSI) |
| Healthcare |
| Government |
| Manufacturing |
| Retail |
| Media And Entertainment |
| Education |
| Other End User Industries |
| Windows-Based Host Computers |
| Linux-Based Host Computers |
| Unix-Based Host Computers |
| Free Hosting |
| Shared Hosting |
| Dedicated Hosting |
| Collocated Hosting |
| North America | United States |
| Canada | |
| Mexico | |
| South America | Brazil |
| Argentina | |
| Rest of South America | |
| Europe | Germany |
| United Kingdom | |
| France | |
| Italy | |
| Spain | |
| Russia | |
| Rest of Europe | |
| Asia Pacific | China |
| Japan | |
| India | |
| South Korea | |
| Australia | |
| Rest of Asia Pacific | |
| Middle East | Saudi Arabia |
| United Arab Emirates | |
| Turkey | |
| Rest of Middle East | |
| Africa | South Africa |
| Egypt | |
| Nigeria | |
| Rest of Africa |
| By Type | Mainframe Computers | |
| Minicomputers | ||
| Microcomputers | ||
| Workstations | ||
| Servers | ||
| Blade Servers | ||
| Rack Servers | ||
| By Technology | Cloud-Based Host Computers | |
| On-Premises Host Computers | ||
| Hybrid Deployments | ||
| By Application | Data Processing | |
| Cloud Computing | ||
| Virtualization | ||
| Networking | ||
| Big Data Analytics | ||
| Artificial Intelligence And Machine Learning | ||
| High-Performance Computing (HPC) | ||
| By End User Industry | IT And Telecom | |
| Banking, Financial Services, And Insurance (BFSI) | ||
| Healthcare | ||
| Government | ||
| Manufacturing | ||
| Retail | ||
| Media And Entertainment | ||
| Education | ||
| Other End User Industries | ||
| By Operating System | Windows-Based Host Computers | |
| Linux-Based Host Computers | ||
| Unix-Based Host Computers | ||
| By Deployment Mode | Free Hosting | |
| Shared Hosting | ||
| Dedicated Hosting | ||
| Collocated Hosting | ||
| By Geography | North America | United States |
| Canada | ||
| Mexico | ||
| South America | Brazil | |
| Argentina | ||
| Rest of South America | ||
| Europe | Germany | |
| United Kingdom | ||
| France | ||
| Italy | ||
| Spain | ||
| Russia | ||
| Rest of Europe | ||
| Asia Pacific | China | |
| Japan | ||
| India | ||
| South Korea | ||
| Australia | ||
| Rest of Asia Pacific | ||
| Middle East | Saudi Arabia | |
| United Arab Emirates | ||
| Turkey | ||
| Rest of Middle East | ||
| Africa | South Africa | |
| Egypt | ||
| Nigeria | ||
| Rest of Africa | ||


Key Questions Answered in the Report
What is the current value of the enterprise mobility in manufacturing market?
The market stands at USD 3.68 billion in 2025 and is set to reach USD 5.88 billion by 2030.
Which device type leads adoption on the factory floor?
Smartphones hold 48.7% share owing to their versatility, though wearables are expanding fastest at a 9.9% CAGR.
Why are private 5G networks gaining traction in plants?
They deliver ultra-reliable low-latency links that support autonomous vehicles, real-time controls and hybrid human-robot workflows.
What hampers faster mobility rollouts in manufacturing?
Cybersecurity vulnerabilities, legacy OT integration hurdles and data-sovereignty regulations pose the strongest constraints.
Which region is growing most rapidly?
Asia-Pacific posts a 10.4% CAGR as China, India and Southeast Asia invest heavily in digitized production ecosystems.
How concentrated is the competitive landscape?
With the top five vendors controlling about 60% of revenue, competition remains moderate, fostering continuous innovation.
Page last updated on:


