Enterprise Flash Storage Market Size and Share
Market Overview
| Study Period | 2019 - 2030 |
|---|---|
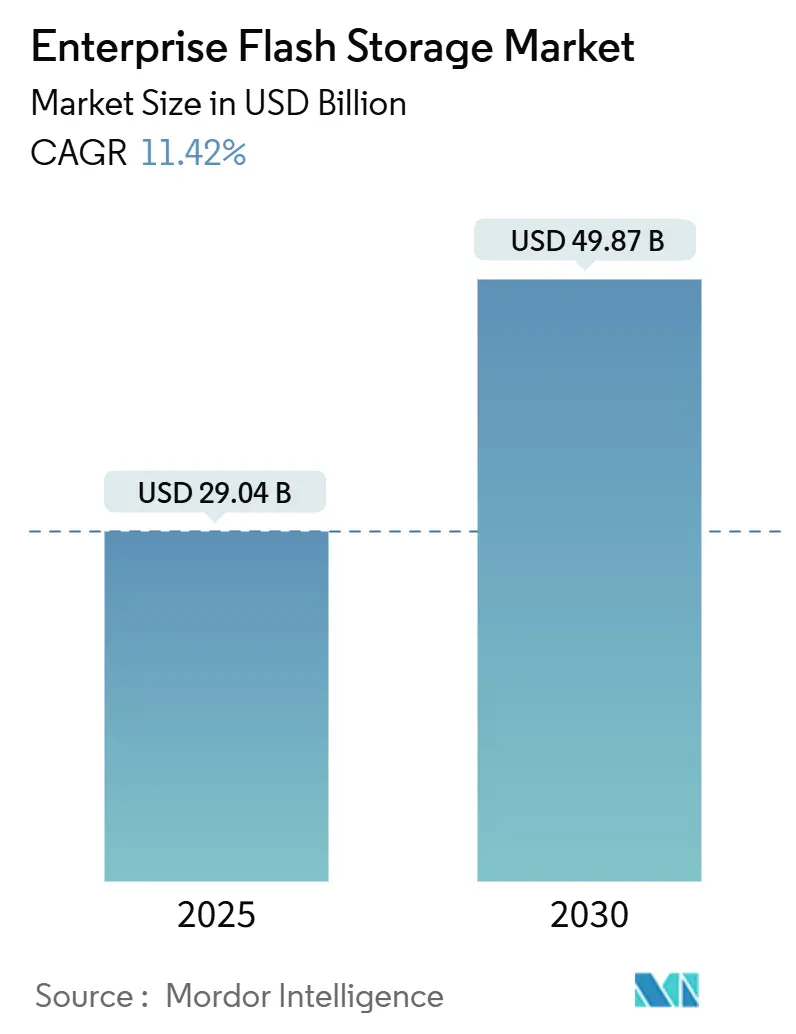
| Market Size (2025) | USD 29.04 Billion |
| Market Size (2030) | USD 49.87 Billion |
| Growth Rate (2025 - 2030) | 11.42% CAGR |
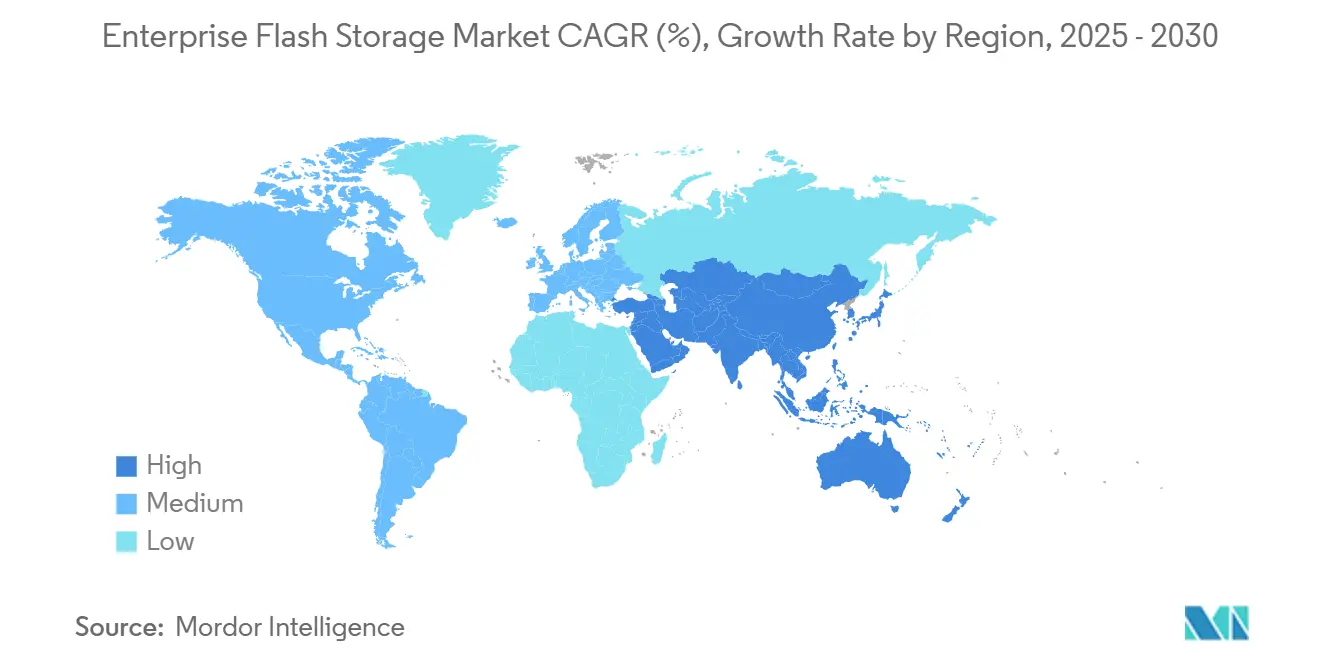
| Fastest Growing Market | Asia Pacific |
| Largest Market | North America |
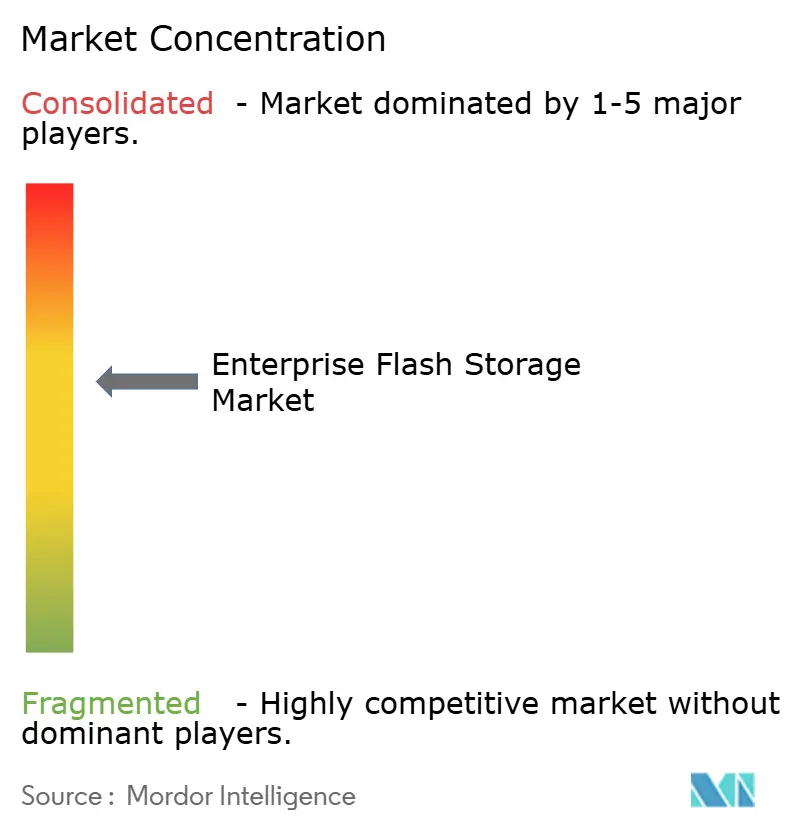
| Market Concentration | Medium |
Major Players *Disclaimer: Major Players sorted in no particular order Image © Mordor Intelligence. Reuse requires attribution under CC BY 4.0. | |
Enterprise Flash Storage Market Analysis by Mordor Intelligence
The enterprise flash storage market size is projected to reach USD 29.04 billion in 2025 and is expected to expand at a 11.42% CAGR to USD 49.87 billion by 2030. This growth reflects the steep decline in NAND cost per bit, the surge in artificial intelligence workloads demanding sub-millisecond latency, and data center consolidation strategies that reward higher rack density. All-flash arrays now handle mixed production workloads at total cost-of-ownership parity with disk systems, a milestone reached when enterprise-grade QLC NAND pricing fell to USD 0.08 per GB in late 2024. Over the forecast, hybrid flash arrays will remain relevant for warm data archives in regulated sectors, while NVMe-over-fabrics architectures push storage disaggregation into tier-two clouds and large enterprises. Form-factor innovation, led by E3.S drives, improves volumetric density and thermal efficiency, and hyperscalers’ vertical integration reshapes vendor competition by internalizing controller design.
Key Report Takeaways
- By product type, all-flash arrays led with 69.23% of the enterprise flash storage market size in 2024, while hybrid flash arrays are projected to record the fastest growth at an 11.71% CAGR through 2030.
- By interface protocol, NVMe captured 48.14% of the enterprise flash storage market size in 2024 and is expected to expand at a 12.39% CAGR to 2030, the quickest rate among all protocols.
- By form factor, 2.5-inch U.2/U.3 drives accounted for 42.86% of the enterprise flash storage market size in 2024, whereas E3.S/E3.L drives represent the fastest-growing slice at a 12.54% CAGR.
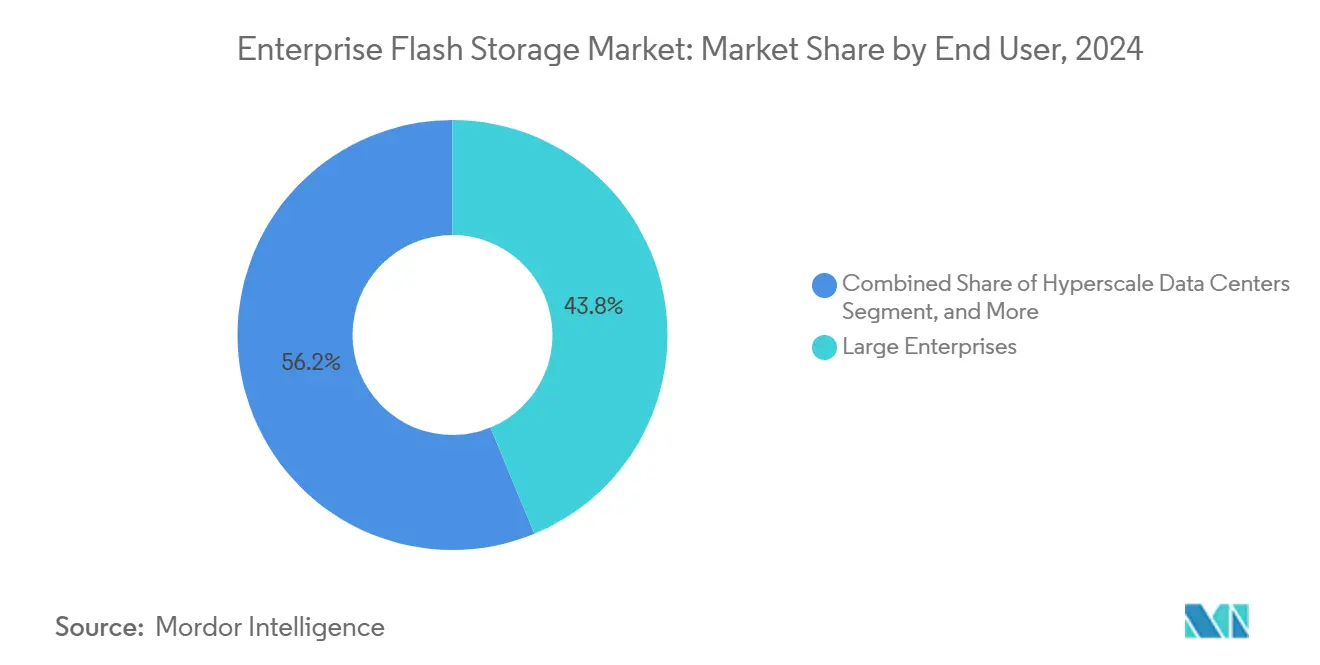
- By end user, large enterprises held a 43.78% of the enterprise flash storage market size in 2024; however, hyperscale data centers are projected to advance at a 12.42% CAGR, surpassing segment growth.
- By application, database and transaction processing generated 33.71% of the enterprise flash storage market size in 2024, while artificial intelligence and machine learning workloads are forecast to climb at a 12.33% CAGR through 2030.
- By geography, North America commanded a 35.83% of the enterprise flash storage market size in 2024, whereas the Asia-Pacific is projected to achieve the highest regional growth with a 12.49% CAGR to 2030.
Global Enterprise Flash Storage Market Trends and Insights
Drivers Impact Analysis*
| Driver | (~) % Impact on CAGR Forecast | Geographic Relevance | Impact Timeline |
|---|---|---|---|
| Rapid Decline in NAND Flash Cost Per Bit | +2.8% | Global, with accelerated adoption in Asia-Pacific and South America | Medium term (2-4 years) |
| Performance Demands of AI-Enabled Workloads | +2.5% | North America and Europe core, expanding to Asia-Pacific hyperscalers | Short term (≤ 2 years) |
| Data Center Consolidation and Rack Density Optimization | +1.9% | Global, concentrated in North America and Europe tier-three data centers | Medium term (2-4 years) |
| Proliferation of NVMe-over-Fabrics Ecosystems | +1.6% | North America and Asia-Pacific hyperscale operators, spillover to Europe | Medium term (2-4 years) |
| Sustainability Imperatives Driving Energy-Efficient Storage | +1.2% | Europe and North America, driven by regulatory mandates | Long term (≥ 4 years) |
| Emergence of Computational Storage for Edge Flash Arrays | +0.9% | Global, early adoption in telecommunications and manufacturing edge sites | Long term (≥ 4 years) |
| Source: Mordor Intelligence | |||
Rapid Decline in NAND Flash Cost Per Bit
Enterprise SSD average selling prices fell 23% year-over-year in Q4 2024, positioning flash arrays below hard-disk platforms on five-year TCO for workloads exceeding 5,000 IOPS.[1]Samsung Electronics, “9th Generation V-NAND Technology,” samsung.com The transition to 200-plus-layer 3D NAND doubled bit density per wafer and trimmed manufacturing cost per GB by 18%. Organizations that once limited flash to acceleration tiers now deploy all-flash as primary storage, collapsing tiering complexity and flattening latency outliers. Suppliers are curbing capacity expansions to avoid 2019-style oversupply, yet QLC now constitutes 41% of enterprise shipments, broadening addressable workloads. Endurance constraints, however, still cap QLC to write-once-read-many scenarios, preserving a niche for TLC in write-intensive databases.
Performance Demands of AI-Enabled Workloads
Training large language models surpassing 100 billion parameters requires storage capable of 400 GB/s sequential throughput, a threshold that flash arrays with NVMe-over-fabrics achieve while network-attached storage stalls GPUs at sub-40% utilization.[2]Storage Networking Industry Association, “NVMe-oF Deployment Guide 2024,” snia.org Latency-sensitive inference pipelines favor locally attached NVMe media, prompting hyperscalers to adopt composable infrastructure linked through Compute Express Link running at 64 GT/s. Processing-in-memory additions within NAND controllers offload compression and filter tasks, cutting network traffic 38% and inference power per request 22%. These combined gains elevate flash from performance tier to AI system backbone within the enterprise flash storage market.
Data Center Consolidation and Rack Density Optimization
Colocation contract renewals with 30-plus-percent rent hikes motivate operators to shrink footprint by migrating into dense, flash-centric racks. Flash delivers 18× higher storage density per rack unit than HDD enclosures, enabling retirement of 12 legacy racks for each E3.S bay and freeing power for GPU clusters.[3]Open Compute Project, “EDSFF E3 Form Factors,” opencompute.org In markets with construction moratoria, such as Singapore, lower watts-per-terabyte metrics tilt procurement toward flash. Western Digital’s NVMe drives idle at 0.9 W/TB, lowering annual electricity by USD 1,340 per PB in regions billing USD 0.12/kWh. Consolidation also boosts interest in storage-class memory that fits DIMM slots, shaving latency to 8 µs.
Proliferation of NVMe-over-Fabrics Ecosystems
NVMe-over-fabrics cuts array-to-host latency below 100 µs, 73% beneath iSCSI, and supports storage disaggregation that aligns with cloud-style scaling. Ratification of NVMe 2.0 with zoned namespaces reduced write amplification 34%, extending drive life. Pure Storage quantified USD 47,000 per PB network savings after eliminating Fibre Channel switches in RDMA-over-Converged-Ethernet rollouts. Adoption hurdles linger around proprietary metadata formats, yet payback arrives inside 18 months via lower CPU licensing and streamlined cabling.
Restraints Impact Analysis*
| Restraint | (~) % Impact on CAGR Forecast | Geographic Relevance | Impact Timeline |
|---|---|---|---|
| Supply Chain Volatility in NAND Flash Production | -1.4% | Global, acute impact in Asia-Pacific manufacturing hubs | Short term (≤ 2 years) |
| High Upfront Capital Expenditure for Flash Arrays | -1.1% | Small and medium enterprises globally, concentrated in South America and Africa | Medium term (2-4 years) |
| Compatibility Challenges with Legacy Infrastructure | -0.8% | North America and Europe financial services and healthcare verticals | Long term (≥ 4 years) |
| Latency Sensitivity in Multi-Tenant Environments | -0.6% | Cloud service providers and hyperscale data centers globally | Medium term (2-4 years) |
| Source: Mordor Intelligence | |||
Supply Chain Volatility in NAND Flash Production
Four suppliers command 87% of global bit output, so natural disasters or geopolitical rifts quickly ripple through pricing and lead times. The April 2024 Taiwan earthquake pushed enterprise SSD delivery from 8 weeks to 14 weeks, stalling hyperscale server rollouts and delaying USD 620 million in vendor revenue. Export controls that limit advanced lithography shipments to China risk splitting the supply chain into divergent technology nodes. Internal allocation shifts, Samsung redirected 23% of 2024 NAND output to its own cloud further squeeze third-party array producers. With each leading-edge fab demanding USD 18 billion in capex, new entrants remain scarce, prolonging the oligopoly and its attendant volatility.
High Upfront Capital Expenditure for Flash Arrays
A 500-TB all-flash array plus seven-year support lists at USD 420,000 to USD 780,000, roughly 3.2× a disk system, nudging smaller enterprises toward storage-as-a-service. Surveys show 64% of Indian and Brazilian firms cite capex as flash’s top barrier despite acknowledging life-cycle savings. Vendor subscription models lower entry points but still require USD 150,000 annual minimums, excluding 78% of SMEs. Shorter refresh cycles four to five years for flash versus seven to eight for disk raise annualized ownership costs. Lease finance rates near 10% erode operational savings for firms that can self-fund cheaper disk alternatives.
*Our forecasts treat driver/restraint impacts as directional, not additive. The impact forecasts reflect baseline growth, mix effects, and variable interactions.
Segment Analysis
By Product Type: Hybrid Arrays Re-Emerge as Cost-Balancers
All-flash arrays dominated revenue with a 69.23% enterprise flash storage market share in 2024, reflecting their primacy in latency-critical virtualization and database estates. Hybrid arrays, however, are forecast to compound at 11.71% through 2030, anchored by compliance archives in finance and healthcare that demand multi-year retention yet tolerate spinning-disk latency. Automated tiering algorithms now predict data temperature with 91% accuracy, ensuring hot data stays on flash. Cost sensitivity in emerging markets and sustainability mandates that favor lower-power HDDs in warm tiers support hybrid adoption. Vendors positioned across both architectures benefit from customers blending performance and capacity in a single chassis.
The enterprise flash storage market continues to debate a flash-only future, but tier-one application heads remain reluctant to entrust archive repositories to flash when hard disks offer 60% lower cost per TB. NetApp’s refreshed FAS line demonstrates how machine-learning tiering can coexist with ONTAP data services, while pure-play all-flash providers concentrate on service-based pricing to counter hybrid’s upfront advantage. Over the forecast period, all-flash is expected to absorb incremental OLTP and AI training workloads, whereas hybrid arrays will defend long-term archive growth.


By Interface Protocol: NVMe Displaces SCSI
NVMe held 48.14% revenue in 2024 and is projected for a 12.39% CAGR as its 64,000-queue-depth architecture removes SCSI bottlenecks that previously capped SSD utilization. Legacy SAS and SATA persist in retrofit cycles, while Fibre Channel inherits 18% revenue from mission-critical SANs where stability trumps raw speed. Ethernet convergence accelerates as RDMA-capable NICs drop below USD 400, amplifying NVMe-over-TCP uptake. The enterprise flash storage market size tied to NVMe deployments is expected to breach USD 25 billion by 2030, underpinned by hyperscaler preference for protocol uniformity across compute and storage fabrics.
Emerging Compute Express Link storage-class memory promises sub-microsecond tiers, but NVMe’s streamlined command set and CPU-offload gains ensure longevity. Vendors now expose zoned namespaces for write-amplification control, integrating applications with media management, and freeing 14% cache overhead formerly spent on garbage collection. Interoperability remains a friction point; proprietary metadata can lock customers into single-vendor ecosystems until standards harden.
By Form Factor: EDSFF Drives Elevate Density
The 2.5-inch U.2/U.3 standard retained 42.86% share in 2024, due to backward compatibility with existing servers. E3.S and E3.L, though, are expanding at 12.54% CAGR, offering 30% better volumetric density and 18% lower thermal design power per TB. Intel’s 61.44-TB E3.S drive enables 1-PB nodes in 1U servers, reshaping rack economics. The enterprise flash storage market size attributed to E3 drives is expected to reach USD 9 billion by 2030. Adoption lags in brownfield sites awaiting motherboard refreshes, keeping U.2 dominant through 2027.
M.2 modules thrive at the edge where footprint priorities eclipse capacity demands, and PCIe add-in cards satisfy sub-10-µs trading systems. Storage-class memory DIMMs furnish 8-µs latency for in-memory analytics yet carry 4.2× NVMe pricing, limiting scope to niche real-time workloads. Collectively, these choices add complexity to vendor roadmaps but allow buyers to optimize for power, capacity, or latency across heterogeneous estates.
By End User: Hyperscalers Stretch the Curve
Large enterprises generated 43.78% of 2024 revenue, leveraging diversified workloads and negotiated rebates. Hyperscalers, expanding at 12.42% CAGR, internalize controller IP to shave per-TB costs 27% and tailor firmware to application profiles. The enterprise flash storage market size tied to small and medium enterprises tilts toward subscription models that shift capex to opex, yet eligibility thresholds limit penetration. Government and defense remain governed by FIPS 140-3 mandates that constrain supplier options.
Hyperscalers purchase in 500-plus-unit pods, extracting deep discounts that ripple down to merchant silicon vendors. In contrast, enterprise buyers maintain heterogeneous fleets across four to seven vendors, fragmenting leverage and sustaining higher ASPs. As sovereign cloud policies proliferate, regional hyperscale buildouts will outsprint enterprise refresh cycles, gradually shifting revenue west to east.

By Application: AI and ML Lift Throughput Demand
Databases contributed 33.71% revenue in 2024, validating flash’s roots in IOPS-intensive OLTP. AI and ML workloads, however, will log a 12.33% CAGR to 2030 as training sets surpass 10 PB and inference latencies fall to milliseconds. The enterprise flash storage market has therefore pivoted toward arrays with 100-GbE fabric, RDMA offload, and GPU-optimized data pipelines. Virtual desktop infrastructure still values flash’s low-tail latency to survive boot storms, while HPC favors sequential bandwidth, making QLC attractive for cheaper petascale scratch.
Real-time analytics ingest 50 GB/s write streams while serving dashboard queries, stressing endurance; consequently, overprovisioning increases to 30% to preserve five-year drive life. Application requirements influence form-factor preference: AI clusters gravitate to locally attached E3.S for minimal hop count, whereas database deployments accept shared NVMe-oF infrastructure for transactional consistency.
Geography Analysis
North America maintained 35.83% share in 2024 on the strength of hyperscaler expansions in Virginia, Oregon, and Texas, where sub-USD 0.07/kWh power and dense internet exchanges prevail. AI training clusters consumed 47% of regional flash shipments, and federal agencies accelerated on-prem migrations after cybersecurity events. Department of Energy mandates for sub-1.4 PUEs also favor flash’s lower watts per TB. Canada’s residency rules scatter infrastructure across provinces, slightly tempering density advantages, while Mexico’s nearshoring boom installs hybrid arrays for manufacturing telemetry.
Asia-Pacific is forecast for a 12.49% CAGR and will eclipse North America in incremental capacity by 2029. China’s dual-circulation plan funnels USD 47 billion into domestic semiconductor lines, while India’s Production-Linked Incentive earmarks USD 2.3 billion for electronics, anchoring local controller and packaging plants. Alibaba and Tencent deployed 8.7 EB of flash in 2024, and Japan’s megabanks migrate to NVMe arrays for real-time fraud analytics. South Korea leverages captive NAND supply to underprice foreign vendors. Australia’s dichotomy between coastal hyperscale and interior mining telemetry continues, whereas Southeast Asia focuses on subscription models for SME affordability.
Europe balances digital sovereignty with energy regulations that set sub-1.3 PUE targets by 2030. Germany’s Industry 4.0 factories require 10-ms storage latency, and the United Kingdom’s trading desks refresh NVMe arrays for zero-touch failover. France’s sovereign cloud initiative lifts domestic build costs 23%, but secures data residency. Russian deployments rely on Chinese 128-layer NAND amid export controls. Saudi Arabia and the UAE invest in sovereign clouds, with NEOM budgeting 1.2 EB for smart-city telemetry. South Africa’s finance vertical and Brazil’s ag-tech lead adoption elsewhere.

Competitive Landscape
Revenue concentration is moderate: the five largest vendors captured 61% in 2024, yet competition intensifies as hyperscalers internalize controller IP and commoditize array hardware. OEMs defend share through subscriptions that decouple capacity from hardware refresh, sustaining gross margins near 58%. Software-defined overlays now abstract commodity drives, while captive NAND suppliers like Samsung exploit vertical integration to price 19% below peers. Computational storage differentiates newcomers NGD Systems and ScaleFlux, whose in-situ query execution trims analytics latency 47%. Vendors tout 4-to-1 data-reduction guarantees and AI-based drive health telemetry, filing 2024 patents for NVMe-oF metadata and wear-leveling.
Regional dynamics matter: Huawei and Inspur own 34% combined share inside China but face Western restrictions; Fujitsu and Hitachi Vantara retain Japanese government and finance footholds despite 20% cost premiums. SME-centric brands chase price over features, offering minimal data services. Disaggregation trends threaten to erode hardware-software bundling economics, while FIPS 140-3 certification costs deter new entrants in defense.
Enterprise Flash Storage Industry Leaders
Pure Storage Inc.
NetApp Inc.
Dell Technologies Inc.
Hewlett Packard Enterprise Company
International Business Machines Corporation
- *Disclaimer: Major Players sorted in no particular order

Recent Industry Developments
- September 2025: Samsung Electronics commenced mass production of 286-layer V-NAND delivering 122.88-TB SSDs in 2.5-inch form factor.
- August 2025: Pure Storage partnered with NVIDIA to bundle FlashArray with DGX SuperPOD, sustaining 2 TB/s throughput for LLM training.
- July 2025: Micron Technology completed a USD 3.7 billion Singapore fab expansion adding 232-layer NAND capacity for Q1 2026 output.
- June 2025: NetApp released ONTAP 10.2 with AI-guided tiering and enhanced NVMe-oF RDMA support.


Global Enterprise Flash Storage Market Report Scope
The Enterprise Flash Storage Market Report is Segmented by Product Type (All Flash Arrays, Hybrid Flash Arrays), Interface Protocol (Serial Attached SCSI, Serial ATA, Non-Volatile Memory Express, Fibre Channel, Ethernet), Form Factor (2. 5-Inch U. 2/U. 3 Drives, M. 2 Drives, PCI Express Add-In Cards, E3. S/E3. L Drives, Storage Class Memory Modules), End User (Large Enterprises, Small and Medium Enterprises, Cloud Service Providers, Hyperscale Data Centers, Government and Defense), Application (Database and Transaction Processing, Virtualization and VDI, Artificial Intelligence and Machine Learning, High-Performance Computing, Real-Time Analytics), and Geography (North America, Europe, Asia-Pacific, Middle East and Africa, South America). The Market Forecasts are Provided in Terms of Value (USD).
| All Flash Arrays (AFA) |
| Hybrid Flash Arrays (HFA) |
| Serial Attached SCSI (SAS) |
| Serial ATA (SATA) |
| Non-Volatile Memory Express (NVMe) |
| Fibre Channel |
| Ethernet (iSCSI, NVMe-oF/TCP, RDMA) |
| 2.5-Inch U.2/U.3 Drives |
| M.2 Drives |
| PCI Express Add-In Cards |
| E3.S/E3.L Drives |
| Storage Class Memory Modules |
| Large Enterprises |
| Small and Medium Enterprises |
| Cloud Service Providers |
| Hyperscale Data Centers |
| Government and Defense |
| Database and Transaction Processing |
| Virtualization and VDI |
| Artificial Intelligence and Machine Learning |
| High-Performance Computing |
| Real-Time Analytics |
| North America | United States | |
| Canada | ||
| Mexico | ||
| Europe | Germany | |
| United Kingdom | ||
| France | ||
| Russia | ||
| Rest of Europe | ||
| Asia-Pacific | China | |
| Japan | ||
| India | ||
| South Korea | ||
| Australia | ||
| Rest of Asia-Pacific | ||
| Middle East and Africa | Middle East | Saudi Arabia |
| United Arab Emirates | ||
| Rest of Middle East | ||
| Africa | South Africa | |
| Egypt | ||
| Rest of Africa | ||
| South America | Brazil | |
| Argentina | ||
| Rest of South America | ||
| By Product Type | All Flash Arrays (AFA) | ||
| Hybrid Flash Arrays (HFA) | |||
| By Interface Protocol | Serial Attached SCSI (SAS) | ||
| Serial ATA (SATA) | |||
| Non-Volatile Memory Express (NVMe) | |||
| Fibre Channel | |||
| Ethernet (iSCSI, NVMe-oF/TCP, RDMA) | |||
| By Form Factor | 2.5-Inch U.2/U.3 Drives | ||
| M.2 Drives | |||
| PCI Express Add-In Cards | |||
| E3.S/E3.L Drives | |||
| Storage Class Memory Modules | |||
| By End User | Large Enterprises | ||
| Small and Medium Enterprises | |||
| Cloud Service Providers | |||
| Hyperscale Data Centers | |||
| Government and Defense | |||
| By Application | Database and Transaction Processing | ||
| Virtualization and VDI | |||
| Artificial Intelligence and Machine Learning | |||
| High-Performance Computing | |||
| Real-Time Analytics | |||
| By Geography | North America | United States | |
| Canada | |||
| Mexico | |||
| Europe | Germany | ||
| United Kingdom | |||
| France | |||
| Russia | |||
| Rest of Europe | |||
| Asia-Pacific | China | ||
| Japan | |||
| India | |||
| South Korea | |||
| Australia | |||
| Rest of Asia-Pacific | |||
| Middle East and Africa | Middle East | Saudi Arabia | |
| United Arab Emirates | |||
| Rest of Middle East | |||
| Africa | South Africa | ||
| Egypt | |||
| Rest of Africa | |||
| South America | Brazil | ||
| Argentina | |||
| Rest of South America | |||


Key Questions Answered in the Report
What is the projected value of the enterprise flash storage market in 2030?
Forecasts place the market at USD 49.87 billion by 2030 based on an 11.42% CAGR.
Which product type is expanding fastest?
Hybrid flash arrays are slated for the quickest rise, logging an 11.71% CAGR through 2030.
Why is NVMe overtaking legacy storage protocols?
NVMe’s 64,000-depth queues and lower CPU overhead elevate drive utilization and cut application latency, driving a 12.39% CAGR.
How will Asia-Pacific influence future demand?
Regional incentives for domestic semiconductor capacity and hyperscale buildouts propel Asia-Pacific to a 12.49% CAGR, the fastest globally.
What key restraint limits flash adoption among SMEs?
High upfront capital expenditure—USD 420,000 to USD 780,000 for a 500-TB array—steers small firms toward storage-as-a-service models.
Which emerging technology could redefine storage efficiency?
Computational storage that executes data filtering inside SSD controllers can slash network traffic 38% for AI recommendation workloads.
Page last updated on:


