Market Overview
| Study Period | 2020 - 2031 |
|---|---|
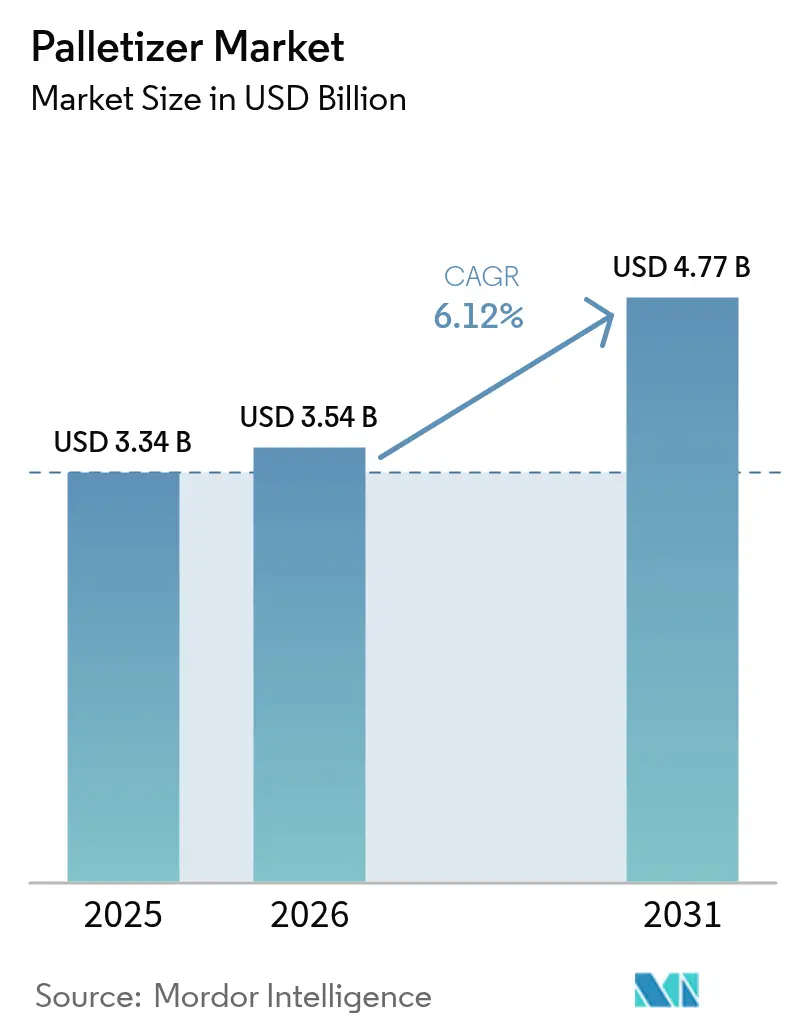
| Market Size (2026) | USD 3.54 Billion |
| Market Size (2031) | USD 4.77 Billion |
| Growth Rate (2026 - 2031) | 6.12% CAGR |
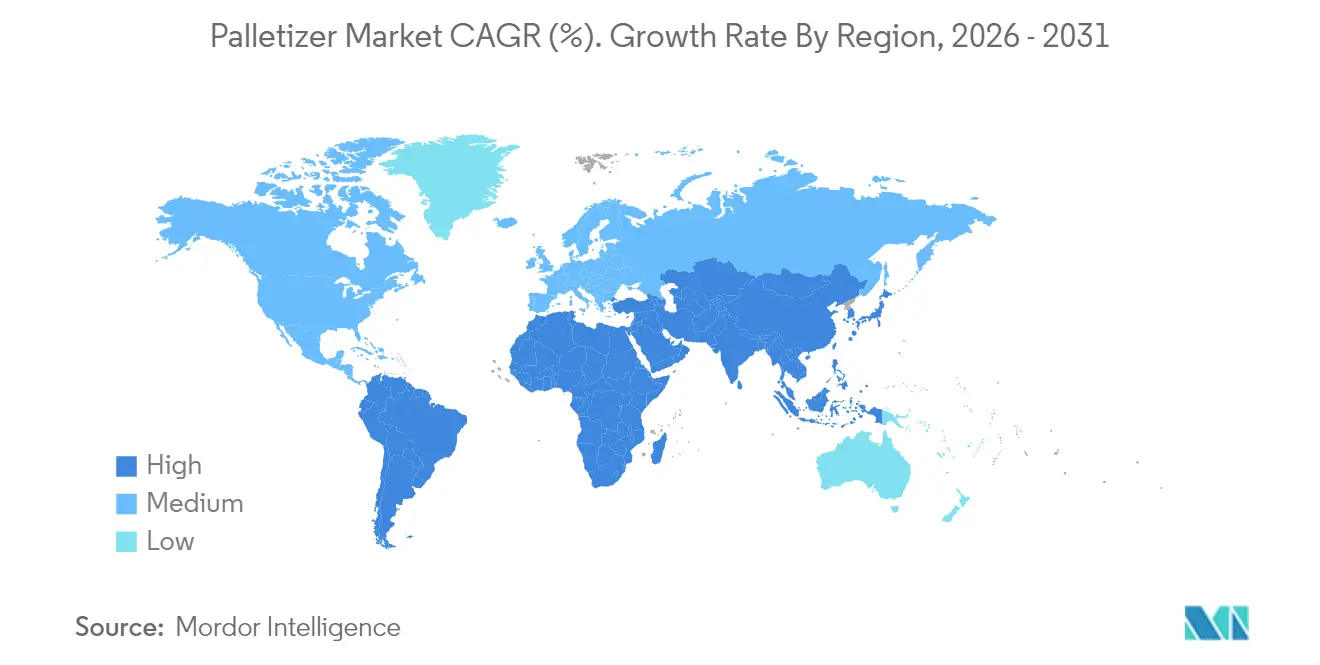
| Fastest Growing Market | Latin America |
| Largest Market | Asia Pacific |
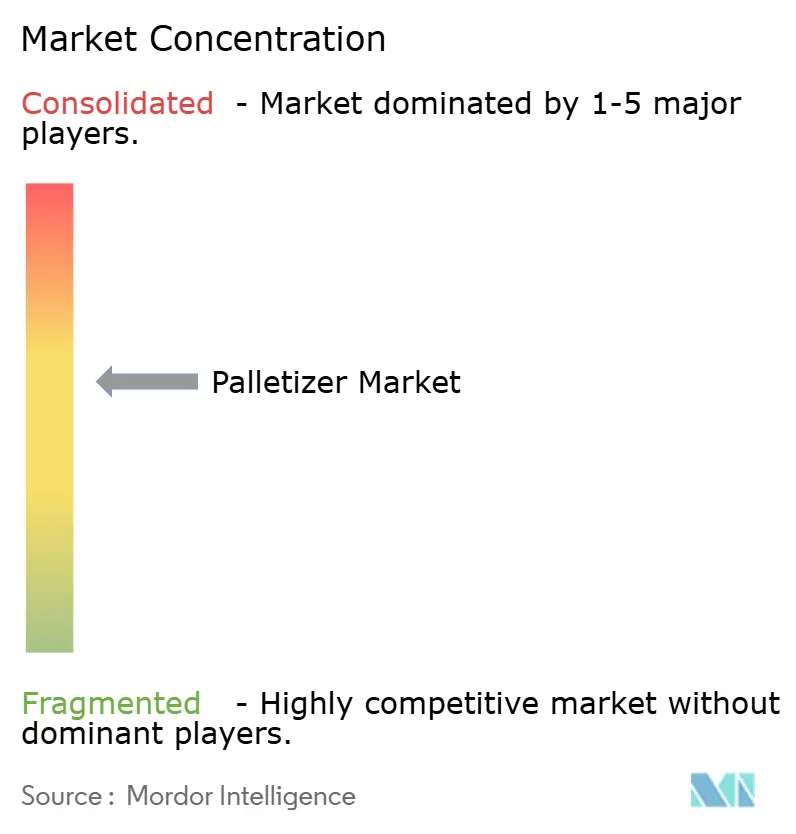
| Market Concentration | Medium |
Major Players *Disclaimer: Major Players sorted in no particular order Image © Mordor Intelligence. Reuse requires attribution under CC BY 4.0. | |
Palletizer Market Analysis by Mordor Intelligence
The palletizer market size is expected to grow from USD 3.34 billion in 2025 to USD 3.54 billion in 2026 and is forecast to reach USD 4.77 billion by 2031 at 6.12% CAGR over 2026-2031. Momentum comes from the sustained shift away from manual pallet building toward automated, software-driven systems that resolve labor shortages, optimize trailer utilization, and meet rising e-commerce throughput requirements. Growth is reinforced by the premium that mixed-SKU, AI-enabled palletizing commands, the rapid spread of rental models that lower upfront costs, and the expanding appeal of collaborative robots in space-constrained factories. Competitive intensity remains moderate: no single player holds more than 15% revenue, yet pricing pressure surfaces as regional integrators package robots with subscription or robotics-as-a-service contracts. South America registers the fastest regional expansion as reshoring and logistics upgrades intersect with government tax incentives; meanwhile APAC maintains volume leadership due to China’s scale in robot production and deployme
Key Report Takeaways
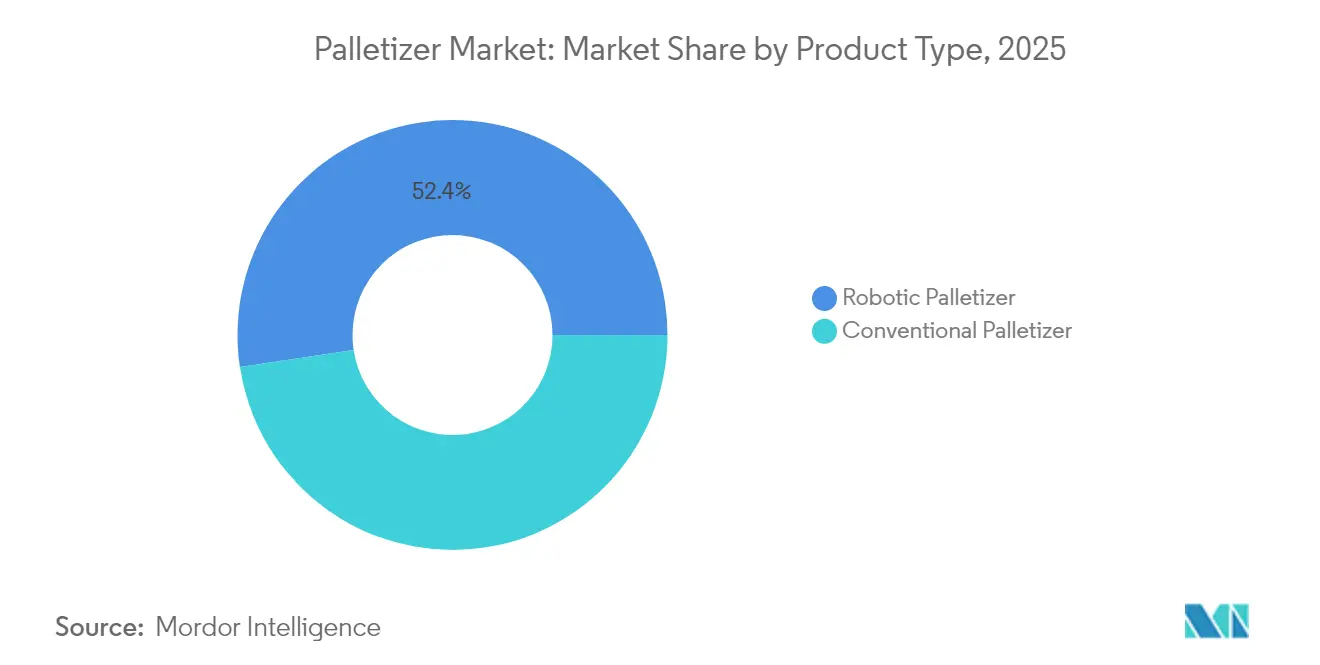
- By product type, conventional palletizers led with 47.62% revenue share in 2025, while collaborative robots are forecast to expand at a 6.09% CAGR through 2031.
- By payload capacity, medium-duty systems (50-150 kg) accounted for 40.88% of the palletizer market share in 2025; heavy-duty models (>150 kg) are projected to deliver the highest 7.18% CAGR to 2031.
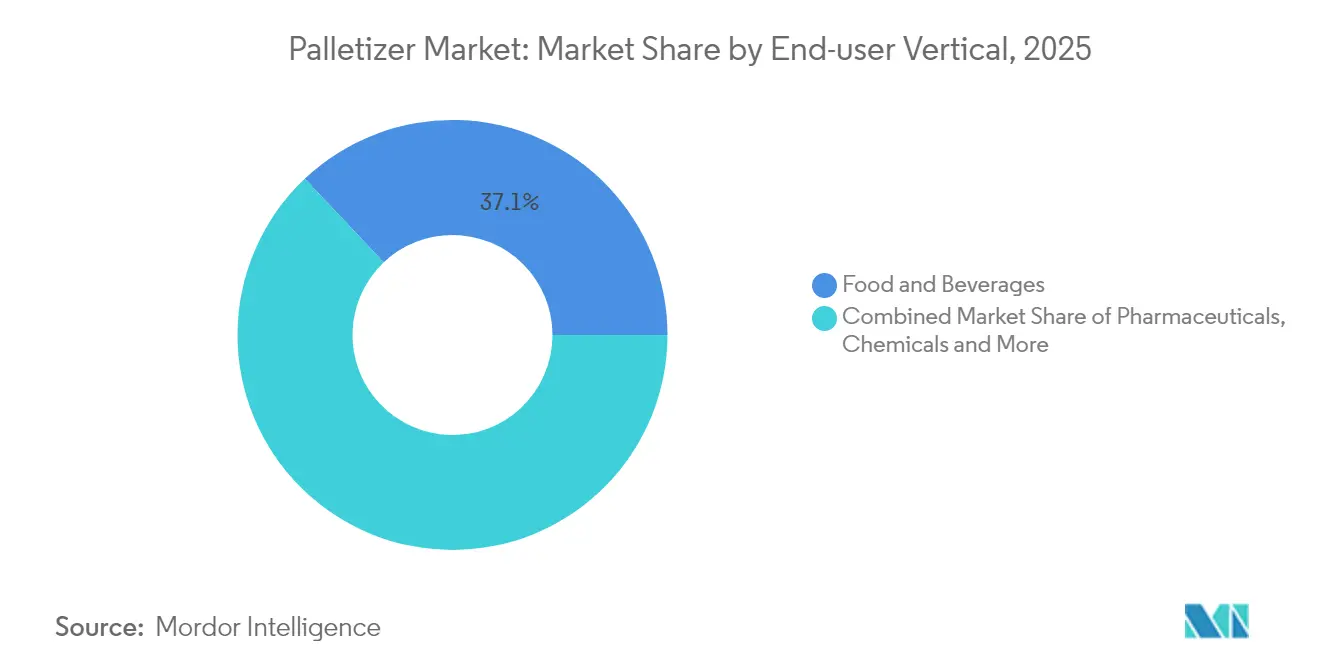
- By end-user vertical, food and beverages represented 37.06% of the palletizer market size in 2025, whereas e-commerce and 3PL facilities are advancing at a 7.55% CAGR.
- By geography, APAC captured 37.84% of 2025 revenue, yet South America shows the fastest 7.86% CAGR through 2031.
- By sales channel, direct OEM sales held 45.48% in 2025, but rental and leasing models are climbing at an 8.24% CAGR.
Note: Market size and forecast figures in this report are generated using Mordor Intelligence’s proprietary estimation framework, updated with the latest available data and insights as of 2026.
Global Palletizer Market Trends and Insights
Drivers Impact Analysis*
| Driver | (~) % Impact on CAGR Forecast | Geographic Relevance | Impact Timeline |
|---|---|---|---|
| Growing e-commerce SKU complexity | +1.8% | Global, concentrated in North America & APAC | Medium term (2-4 years) |
| Labor shortages accelerating warehouse automation | +2.1% | Global, acute in North America & EU | Short term (≤ 2 years) |
| Packaging-line ROI improvements from plug-and-play cobots | +1.2% | North America & EU, expanding to APAC | Medium term (2-4 years) |
| Surge in FMCG sustainability mandates favouring robotic mixed-load palletizing | +0.9% | EU & North America, emerging in APAC | Long term (≥ 4 years) |
| Source: Mordor Intelligence | |||
Growing e-commerce SKU complexity
Fulfilment centres now handle volumes that exceed 180 billion cases yearly, with single sites processing more than 50,000 SKUs—ten times the diversity typical of legacy retail hubs.[1]Apptronik, “Case Picking”, Apptronik, apptronik.comFixed-pattern equipment cannot keep up, prompting adoption of AI-powered systems such as the Lucas Warehouse Optimization Suite, which lifts palletizing efficiency 15-20% by balancing weight, fragility, and stackability in real time. Premium platforms fetch 30-40% higher margins but still lower total shipping cost as optimized loads cut empty trailer space by up to 30%.
Labor shortages accelerating warehouse automation
Critical staffing gaps across 41 factory occupations in China and 15-20% vacancy rates in North American warehouses have compressed automation payback to under 18 months. Mid-market plants now automate runs of just 100 units per hour, unlocking a broader palletizer market as collaborative systems redeploy employees to safer, higher-value roles.
Packaging-line ROI improvements from plug-and-play cobots
A new class of 30 kg-payload cobots such as FANUC’s CRX-25iA eliminates up to 80% of the fencing and programming cost typical of standard industrial robots. Rental offers like Columbia/Okura’s miniPAL at USD 5,450 per month streamline trials, enabling rapid rollout without balance-sheet strain. [2]Columbia/Okura, “Columbia/Okura Launches New miniPAL® Cobot Rental Program”, MHI, og.mhi.org
Surge in FMCG sustainability mandates favouring robotic mixed-load palletizing
EU rules requiring 65% packaging recycling by 2025 spur buyers toward robots that trim voids and reduce cushioning material by 15-25%.[3]Pharma Manufacturing, “Keeping Pace with Pharma Packaging”, Pharma Manufacturing, pharmamanufacturing.com KHS’ Nature MultiPack shows how algorithmic stacking maintains stability while using 90% less adhesive khs.com. Energy-efficient drives and regenerative braking further cut carbon footprints.
Restraints Impact Analysis*
| Restraint | (~) % Impact on CAGR Forecast | Geographic Relevance | Impact Timeline |
|---|---|---|---|
| High upfront CAPEX for heavy-payload robotic arms | −1.4% | Global, acute in developing markets | Short term (≤ 2 years) |
| Integration complexity with legacy MES/WMS | −0.8% | North America & EU, emerging in APAC | Medium term (2-4 years) |
| Source: Mordor Intelligence | |||
High upfront CAPEX for heavy-payload robotic arms
Installations rated above 150 kg often top USD 500,000, a hurdle for manufacturers shipping fewer than 500 pallets daily. Robotics-as-a-service pioneers such as Formic counter this barrier with USD 3,975 monthly bundles, yet tradeoffs around customisation and ownership persist.
Integration complexity with legacy MES/WMS
Connecting palletizers to heterogeneous software stacks can double project budgets and stretch timelines to 12 months. Forthcoming EU Machinery Regulation 2023/1230 tightens cybersecurity validation, raising the bar for vendors that lack deep software integration skills.[4]TÜV SÜD, “Machine Safety & the EU Machinery Directive”, TÜV SÜD, tuvsud.com
*Our forecasts treat driver/restraint impacts as directional, not additive. The impact forecasts reflect baseline growth, mix effects, and variable interactions.
Segment Analysis
By Product Type: Conventional Systems Face Cobot Disruption
Conventional machines retained 47.62% revenue in 2025 as high-speed lines exceeding 1,000 cases per hour depend on proven layer devices. Yet the palletizer market sees collaborative units outpace at 6.09% CAGR, capturing greenfield investments in small-footprint sites that crave safety-certified, fence-free operation. Robotic articulated arms occupy the mid-performance tier, balancing throughput against changeover flexibility for mixed product portfolios. Hybrid systems, blending layer formers with robotic pickers, emerge in niche beverage and personal-care cells but remain cost-intensive.
Vendors differentiate through full-stack ecosystems: Doosan’s P-SERIES coupled with Rocketfarm’s Pally software reduces deployment time and elevates user autonomy. As customers prioritise single-source accountability over stand-alone hardware, suppliers bundling vision, simulation, and lifecycle services widen addressable opportunities inside the palletizer market.


By Payload Capacity: Heavy-Duty Applications Drive Premium Growth
Medium-duty solutions dominated with 40.88% share, reflecting consumer goods’ bias toward 50-150 kg boxes. However the palletizer market size for heavy-duty systems is slated to expand at a 7.18% CAGR as bulk shippers consolidate loads to curb labour and freight costs. Energy-efficient servo architectures and advanced safety scanners now let 180 kg cobots operate alongside staff, as seen in Bob’s Red Mill installations. These capabilities command 40-60% price uplifts compared with mid-tier peers, yet users justify the premium through reduced forklift moves and lower workers’ compensation claims.
Light-duty cells under 50 kg address pharmaceuticals and electronics, where cleanroom compliance and precision trump brute force. Vendors targeting this end of the palletizer market leverage class-10-rated enclosures and vacuum grippers to protect high-value items, maintaining a stable but slower growth profile.
By End-user Vertical: E-commerce Disrupts Traditional Hierarchies
Food and beverages remained the anchor at 37.06% of 2025 revenue, drawn to stainless-steel, wash-down-rated machinery that assures hygiene. Yet the palletizer market size for e-commerce and 3PL segments is forecast to grow 7.55% CAGR as omnichannel retailers demand robots that build mixed SKU pallets in unpredictable sequences. AI-enabled vision and gentle grippers allow cosmetics weighing 0.5 kg to be stacked beside 25 kg components without damage.
Pharmaceuticals apply distinct pressure: drug-trace regulations necessitate serialization-ready palletizers linking vision and data capture, while chemicals require ATEX-certified arms in hazardous areas. Personal-care brands boost demand for quick-changeover cells that mirror rapid product launches.
By Sales Channel: Rental Models Reshape Market Access
Direct OEM contracts still represented 45.48% revenue in 2025, favoured for large plant rollouts needing deep engineering interaction. Nonetheless, rental and leasing lines are pacing the palletizer market at an 8.24% CAGR, appealing to CFOs who prefer OPEX over CAPEX. Columbia/Okura’s miniPAL option with 3-month minimum terms de-risks pilot projects.
System integrators preserve relevance by stitching robots into broader conveyance and quality-inspection flows. Retrofits gain traction as users upgrade decade-old layer machines with AI software and safety scanners to extend asset life without full replacement.
Geography Analysis
APAC held 37.84% of 2025 revenue, with China alone installing 52% of new global robots by 2022. Domestic suppliers now secure 36% of their home market, pushing price points lower and accelerating diffusion among tier-two factories. Japan built 45% of the world’s robots and channelled USD 7.35 billion in 2024 orders into logistics, food, and pharma lines, backed by a USD 39.3 billion (USD 43.7 billion) government supply-chain fund . India’s Production-Linked Incentive schemes spark automation across automotive and generics plants, though adoption pockets remain uneven due to skill gaps.
South America records the strongest 7.86% CAGR trajectory to 2031 as Brazil’s food and auto sectors automate pallet building for export compliance. Mexico rides near-shoring trends to supply the US market with tariff-proof goods, intensifying demand for robots certified to North American safety codes. Argentina’s grain processors install palletizers that stabilise 1-tonne bulk bags for long ocean voyages despite macroeconomic volatility.
North America and Europe show measured growth driven by replacement rather than capacity additions. Upcoming Regulation (EU) 2023/1230 compels vendors to harden cybersecurity, advantaging those with certified software stacks. US reshoring programs lift the palletizer market as SMB manufacturers seek flexible cobots that accommodate frequent SKU changeovers and mitigate labour constraints in ageing rural workforces.

Competitive Landscape
The palletizer market is characterized by moderate fragmentation. Legacy automation majors—ABB, FANUC, KUKA—leverage global service footprints and large installed bases, but none surpass 15% revenue share. Their current strategy emphasises software platforms and vertically integrated service contracts that embed customers for complete line life cycles.
Specialist players pursue blue-ocean tactics: Formic monetises uptime through robotics-as-a-service, assuming maintenance risk and earning subscription fees. Columbia/Okura differentiates via short-term rentals that compress decision cycles and capture demand in midsize enterprises. AI-native entrants such as Ambi Robotics refine perception algorithms to solve complex item variability, targeting e-commerce nodes overlooked by traditional integrators.
M&A remains an accelerant. Krones, after posting EUR 5.29 billion (USD 5.73 billion) in 2024 revenue, is layering software and PET preform capacity through the Netstal acquisition, thereby broadening its packaging ecosystem. Industrial groups like Duravant and ProMach continue roll-ups that deliver cross-selling synergies across conveyors, depalletizers, and stretch-wrappers—extending customer lifetime value.
Palletizer Industry Leaders
ABB Ltd.
BEUMER Group GmbH & Co. KG
Yaskawa Electric Corp.
FANUC Corp.
KUKA AG
- *Disclaimer: Major Players sorted in no particular order

Recent Industry Developments
- January 2025: Ambi Robotics introduced AmbiStack, an AI-powered robotic stacking solution designed to enhance warehouse operations through advanced automation technology for stacking and palletizing processes, representing significant advancement in AI-driven palletizing solutions.
- January 2025: Krones reported a 12.1% revenue increase for 2024, reaching EUR 5.29 billion (USD 5.73 billion) and a 4.1% rise in order backlog, underscoring strong demand for beverage automation including palletizers
- June 2025: ProMach acquired Sentry Equipment & Erectors Inc., broadening conveyor and container handling competencies to integrate tightly with palletizing cells. The deal deepens ProMach’s end-of-line breadth, enabling bundled bids that can outflank single-category rivals.
- August 2024: Duravant acquired T-TEK Material Handling, enriching depalletizing and conveyance offerings for packaged food and beverage clients. The bolt-on scales Duravant’s integrated-solutions approach, increasing wallet share per project.
- July 2024: Doosan Robotics partnered with Rocketfarm to embed Pally software into cobots for faster palletizing deployments. The alliance accelerates time-to-value and differentiates Doosan through ease-of-use.


Research Methodology Framework and Report Scope
Market Definitions and Key Coverage
Our study defines the palletizer market as revenue generated from new, factory-built machines that automatically stack filled cases, bags, drums, or mixed loads onto pallets across food, beverage, chemical, pharmaceutical, e-commerce, and other industrial lines. Rental units and turnkey systems supplied by system integrators are counted because buyers treat them as substitutes for ownership.
Scope exclusion: used or refurbished palletizers and ancillary stretch-wrapping equipment are not included.
Segmentation Overview
- By Product Type
- Conventional Palletizer
- High-Level Palletizer
- Low-Level Palletizer
- Robotic Palletizer
- Cartesian/Gantry
- Articulated
- SCARA
- Collaborative (Cobot)
- Hybrid Palletizer
- Conventional Palletizer
- By Payload Capacity
- Light-Duty (<50 kg)
- Medium-Duty (50-150 kg)
- Heavy-Duty (>150 kg)
- By End-user Vertical
- Food & Beverages
- Pharmaceuticals
- Personal Care and Cosmetics
- Chemicals
- E-commerce and 3PL
- Other Verticals
- By Sales Channel
- Direct OEM Sales
- System Integrators
- After-market Retrofits and Upgrades
- Rental / Leasing
- By Geography
- North America
- United States
- Canada
- Mexico
- South America
- Brazil
- Argentina
- Rest of South America
- Europe
- Germany
- United Kingdom
- France
- Italy
- Russia
- Rest of Europe
- APAC
- China
- Japan
- India
- South Korea
- Rest of APAC
- Middle East & Africa
- United Arab Emirates
- Saudi Arabia
- South Africa
- Rest of Middle East and Africa
- North America
Detailed Research Methodology and Data Validation
Primary Research
We interviewed OEM engineers, line-integration consultants, contract-packing managers, and automation distributors in North America, Europe, Asia Pacific, and Latin America. These discussions helped us reconcile shipment tallies, typical change-order pricing, uptime assumptions, and regional payback thresholds that desk research alone cannot reveal.
Desk Research
We began with public statistics from bodies such as the US Census Manufacturing Survey, Eurostat PRODCOM, China's National Bureau of Statistics, and UN Comtrade import-export codes that itemize palletizing machines. Trade-association data from PMMI, VDMA Robotics + Automation, and the International Federation of Robotics provided shipment volumes and installed bases. Company 10-Ks, investor decks, and procurement filings revealed average selling prices and capacity utilization. To fill qualitative gaps, our analysts extracted news flows on capacity expansions through Dow Jones Factiva and interrogated patent families using Questel to gauge innovation velocity. The sources listed illustrate our approach; many additional references supported data validation.
A second sweep matched production data with demand indicators; for example, global packaged food output, e-commerce parcel growth, and capital-equipment spending indexes; so historical correlations could be mapped before forecasting.
Market-Sizing & Forecasting
Our base year value emerged from a top-down reconstruction of production and cross-border trade, subsequently stress-tested with sampled bottom-up checks on supplier revenues and installed fleet counts. Key inputs include palletizer unit shipments, median ASP shifts by payload class, robot penetration rates, labor cost inflation, and retail warehouse build-outs. Forecasts apply a multivariate regression that links those drivers to macro indicators, then layers scenario analysis for labor-scarcity shocks. Where bottom-up data were missing, for instance, private integrator sales in emerging markets, we imputed values using regional proxy ratios validated by two industry experts.
Data Validation & Update Cycle
Mordor analysts run variance screens against independent metrics each quarter, reroute anomalies for peer review, and refresh the model annually; material events trigger mid-cycle updates so clients receive the latest calibrated view.
Why Our Palletizer Baseline Commands Reliability
Published market numbers often diverge because studies mix unlike product classes, apply different ASP progressions, or freeze currency at outdated rates. By aligning scope to real buyer options and anchoring prices to current invoices, Mordor Intelligence reduces these gaps.
Key gap drivers versus other publishers include narrower product coverage, omitting hybrid or rental models, shorter refresh cadence, and unvalidated ASP deflators that compress growth.
Benchmark comparison
| Market Size | Anonymized source | Primary gap driver |
|---|---|---|
| USD 3.34 B (2025) | Mordor Intelligence | - |
| USD 3.17 B (2024) | Global Consultancy A | Excludes hybrid and rental units; mid-2024 FX base |
| USD 2.90 B (2024) | Industry Analyst B | Counts only conventional and robotic lines; static ASP assumption |
Taken together, the comparison shows that our disciplined scope choices, live ASP tracking, and annual refresh make Mordor's baseline the most transparent starting point for confident planning decisions.


Key Questions Answered in the Report
What is the size of the palletizer market in 2026?
The palletizer market is valued at USD 3.54 billion in 2026.
Which region leads the palletizer market?
APAC leads, accounting for 37.84% of 2025 revenue due to China’s large-scale robot adoption.
Which product segment is growing fastest?
Collaborative palletizers are expanding at a 6.09% CAGR thanks to safety-certified, fence-free deployment.
Why are rental models important in palletizing?
Rental and leasing lower CAPEX, enabling mid-market factories to adopt automation and are rising at an 8.24% CAGR.
What payload class shows the highest growth?
Heavy-duty systems above 150 kg are projected to grow 7.18% annually as firms consolidate shipments.
How does labor shortage influence palletizer adoption?
Acute staffing gaps cut automation payback to less than 18 months, accelerating investment in robotic palletizing.
Page last updated on:


