Employee Engagement Market Size and Share
Market Overview
| Study Period | 2020 - 2031 |
|---|---|
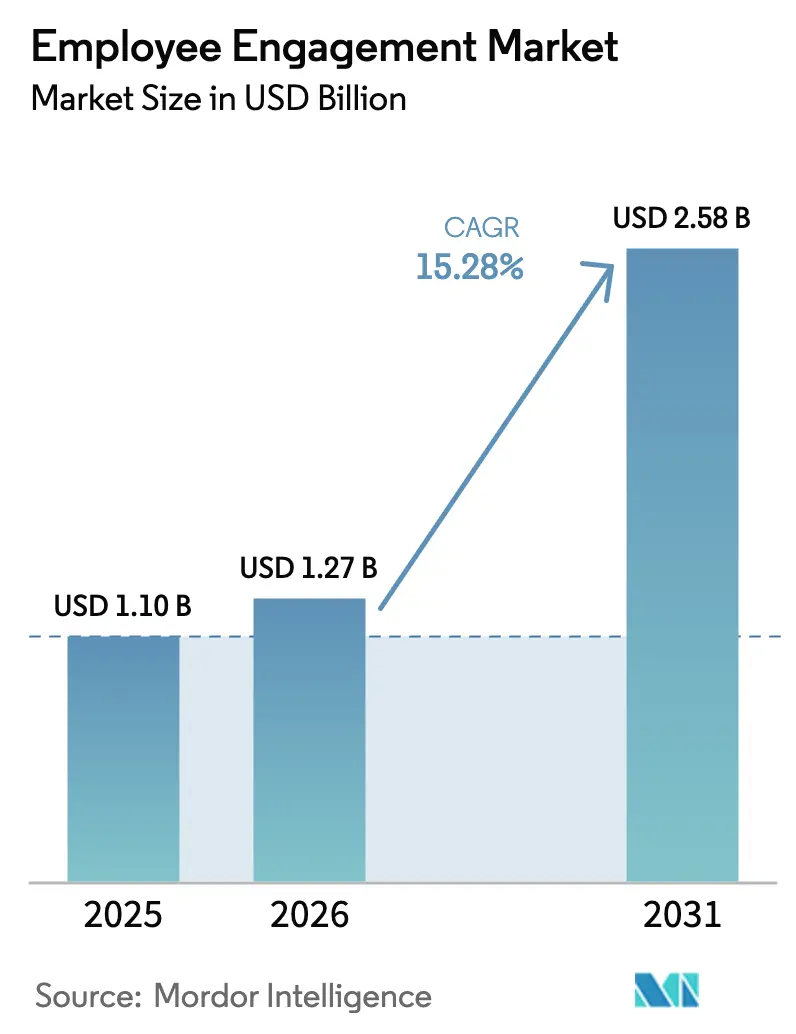
| Market Size (2026) | USD 1.27 Billion |
| Market Size (2031) | USD 2.58 Billion |
| Growth Rate (2026 - 2031) | 15.28% CAGR |
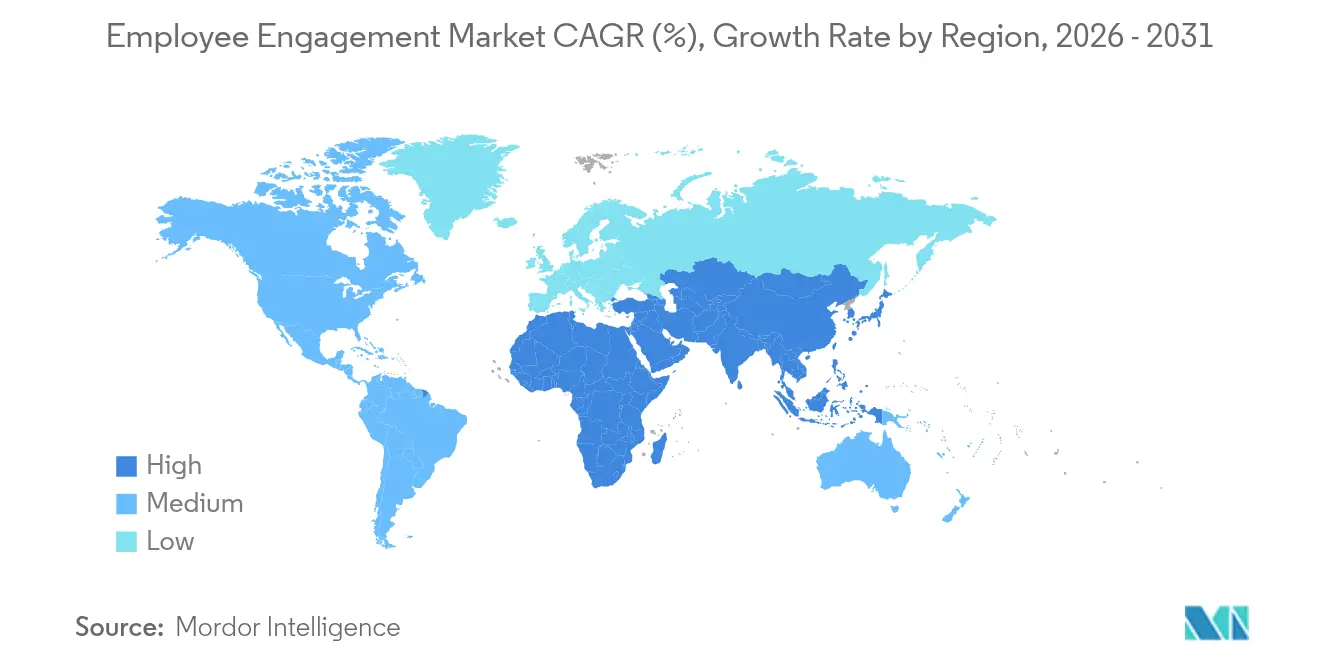
| Fastest Growing Market | Asia Pacific |
| Largest Market | North America |
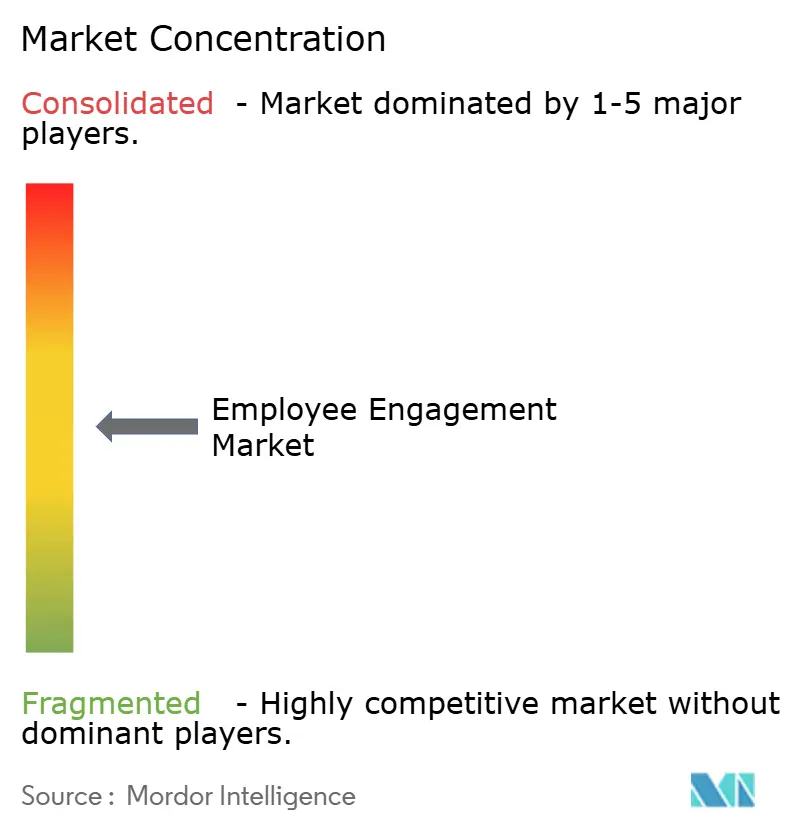
| Market Concentration | Medium |
Major Players *Disclaimer: Major Players sorted in no particular order Image © Mordor Intelligence. Reuse requires attribution under CC BY 4.0. | |
Employee Engagement Market Analysis by Mordor Intelligence
The employee engagement market size is expected to grow from USD 1.10 billion in 2025 to USD 1.27 billion in 2026 and is forecast to reach USD 2.58 billion by 2031 at 15.28% CAGR over 2026-2031. Robust growth reflects an urgent need to lift workforce productivity during talent shortages, combined with rapid adoption of artificial intelligence in human-capital strategies. Enterprise roll-outs scale quickly: Microsoft Viva already underpins engagement programs at more than 60% of Fortune 500 corporations. Solution suites held 70.20% revenue share in 2024, cloud deployment accounted for 75.20%, and large enterprises contributed 56.50%, although the SME segment is growing fastest at a 19.10% CAGR. North America led with 35.80% market share in 2024, while Asia-Pacific is the most dynamic region, expanding at 19.30% CAGR on the back of digital-transformation programs. IT and Telecom dominated industry adoption with 29.20% market share, yet post-pandemic retention pressure is propelling healthcare to the highest vertical CAGR of 19.80%. Competitive intensity is moderate: broad-suite vendors such as Microsoft, Workday, and SAP extend platform reach, whereas focused players like Culture Amp and Lattice win share with AI-driven analytics. Key risks include project complexity, workforce distrust of AI—95% of employees question organizational AI outcomes—and shifting privacy rules that elevate compliance costs, especially in Europe.
Key Report Takeaways
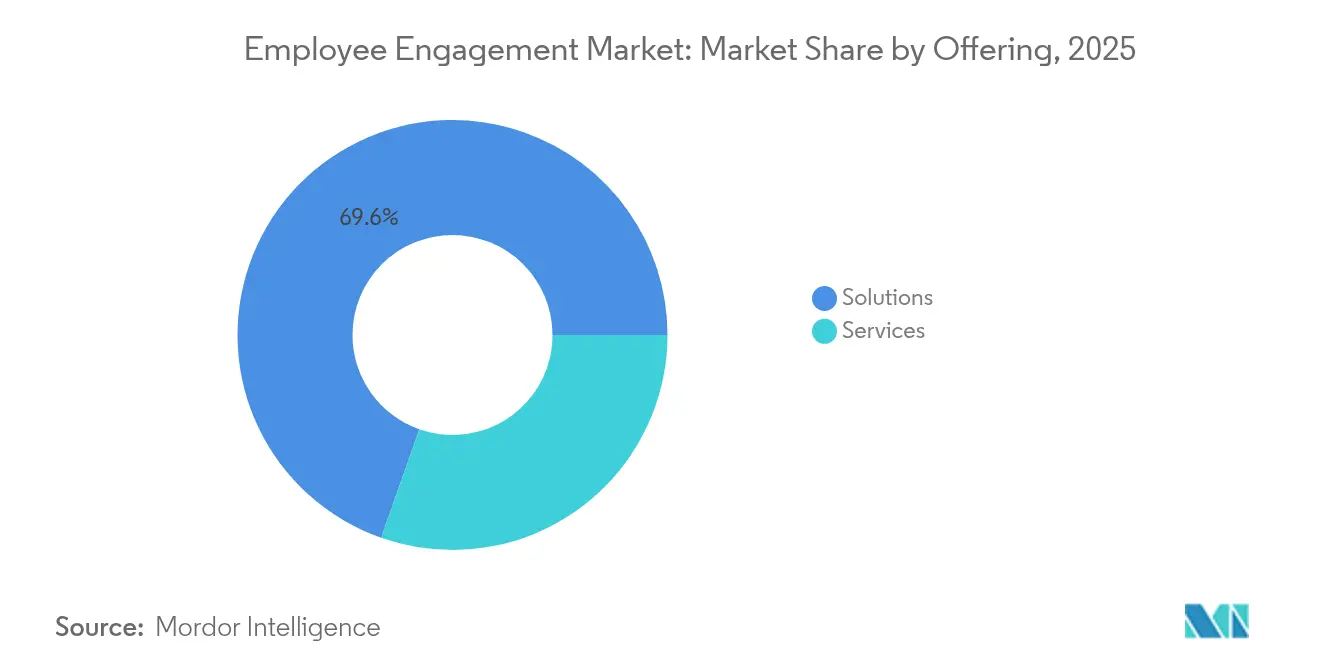
- By offering, solutions captured 69.62% of employee engagement market share in 2025; services are on track for an 18.02% CAGR to 2031.
- By deployment mode, cloud commanded 74.63% share of the employee engagement market size in 2025 and is projected to accelerate at 18.44% CAGR.
- By enterprise size, large organizations held 55.94% share in 2025, while SMEs post the highest 18.68% CAGR through 2031.
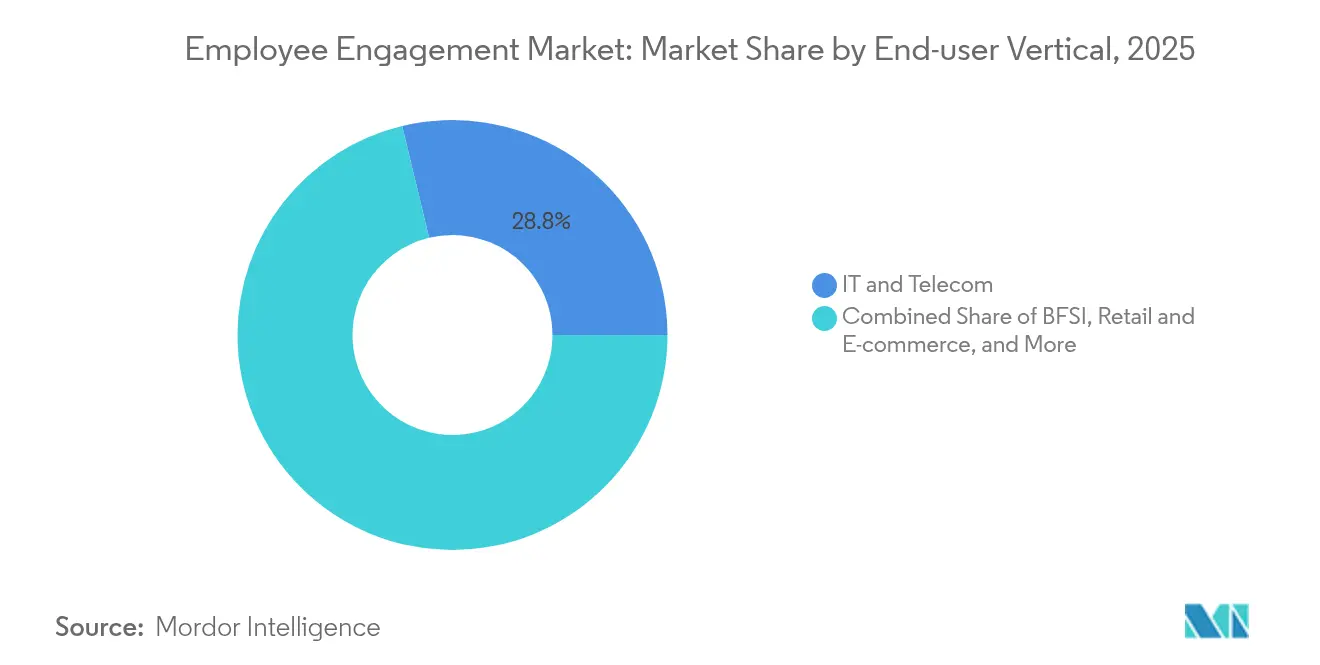
- By end-user vertical, IT and Telecom led with 28.76% revenue share in 2025; healthcare is set to grow at 19.12% CAGR to 2031.
- By functionally, Surveys and Feedback maintained a 33.74% share in 2025; analytics and insights are on track for an 20.46% CAGR to 2031.
- By geography, North America contributed 35.52% of 2025 revenue; Asia-Pacific is the fastest-growing geography at 18.74% CAGR.
Note: Market size and forecast figures in this report are generated using Mordor Intelligence’s proprietary estimation framework, updated with the latest available data and insights as of 2026.
Global Employee Engagement Market Trends and Insights
Drivers Impact Analysis*
| Driver | (~) % Impact on CAGR Forecast | Geographic Relevance | Impact Timeline |
|---|---|---|---|
| AI-powered engagement platforms | +4.2% | Global, with early adoption in North America and EU | Medium term (2-4 years) |
| Rise of remote and hybrid work models | +3.8% | Global, concentrated in developed markets | Short term (≤ 2 years) |
| Shift to cloud-native HR tech stacks | +2.9% | Global, accelerated in Asia-Pacific and emerging markets | Medium term (2-4 years) |
| GenAI copilots for HR analytics | +2.1% | North America and EU, expanding to Asia-Pacific | Long term (≥ 4 years) |
| Neuro-informed engagement nudges | +1.4% | Developed markets, regulatory-dependent adoption | Long term (≥ 4 years) |
| ESG-linked engagement metrics | +1.2% | EU-led, expanding globally through multinational adoption | Medium term (2-4 years) |
| Source: Mordor Intelligence | |||
AI-Powered Engagement Platforms
Predictive analytics is replacing reactive survey cycles. Firms that embed artificial intelligence in engagement suites report 30% cuts in turnover expense and 21% profit uplift, attributable to early warning of disengagement risks [1]Satya Nadella, “Microsoft Viva Overview,” Microsoft Corporation, microsoft.com. Culture Amp’s AI Comment Summaries have eliminated 6,600 staff hours of manual review, validating machine-learning value in qualitative feedback loops cultureamp.com. Microsoft’s Copilot rollout across 220,000 employees lifted task-completion efficiency by 70%, confirming cloud-scale feasibility. Real-time sentiment parsing across chat, email, and collaboration channels enables instant interventions impossible under traditional quarterly surveys. The hurdle is trust: 47% of workers say they are unprepared for workplace AI, signalling the importance of transparent algorithm design.
Rise of Remote and Hybrid Work Models
Permanent hybrid structures have redrawn engagement playbooks. Roughly 30% of all meetings now span multiple time zones, driving demand for asynchronous collaboration features. Microsoft Teams alone added more than 450 hybrid-friendly upgrades in 2024, ranging from spatial audio to AI-generated meeting recaps. Post-pandemic, financial-services engagement rankings climbed from ninth to fifth among 17 sectors, largely due to flexibility initiatives backed by digital collaboration. The strategic challenge now lies in sustaining connection without veering into surveillance, balancing productivity insights with autonomy.
Shift to Cloud-Native HR Tech Stacks
Cloud deployment secures 75.20% share because it strips away on-premise constraints and unlocks elastic analytics. Workday serves more than 11,000 customers via a cloud-first model that generated USD 7.718 billion subscription revenue in fiscal 2025 [2]Chano Fernandez, “Workday FY 2025 Results,” Workday, Inc., workday.com. Unified APIs allow engagement platforms to pool payroll, performance, and learning data into a single experience dashboard, enhancing board-level decision support. Compliance benefits matter: cloud providers continually update controls to match evolving privacy statutes, a task seldom feasible for in-house infrastructure. To succeed, buyers must address data-sovereignty questions and reinforce cyber-resilience as engagement suites ingest richer worker telemetry.
GenAI Copilots for HR Analytics
Generative AI is converting descriptive dashboards into prescriptive coaching. IBM’s watsonx Orchestrate saved HR teams 12,000 hours in one quarter by automating promotion-cycle data collection. Microsoft’s Employee Self-Service Agent improved HR answer accuracy by 25% and raised IT self-help success by 36%. By feeding conversational requests into large language models, employees locate benefits details or draft leave requests in seconds. IBM projects USD 5 million in yearly savings alongside 50,000 managerial hours redirected to talent development. GenAI’s edge lies in contextual recommendations—surfacing personalised nudges or learning modules based on tenure, role, and sentiment signals.
Restraints Impact Analysis*
| Restraint | (~) % Impact on CAGR Forecast | Geographic Relevance | Impact Timeline |
|---|---|---|---|
| High implementation and subscription cost | -2.8% | Global, particularly impacting SMEs in emerging markets | Short term (≤ 2 years) |
| Data-privacy and compliance concerns | -2.1% | EU-led, expanding globally through regulatory adoption | Medium term (2-4 years) |
| App-fatigue reducing tool adoption | -1.6% | Developed markets with high technology saturation | Short term (≤ 2 years) |
| Algorithmic bias in sentiment analytics | -1.3% | Global, with heightened scrutiny in regulated industries | Long term (≥ 4 years) |
| Source: Mordor Intelligence | |||
High Implementation and Subscription Cost
Platform fees compress budgets, especially for SMEs. Culture Amp charges between USD 10,000 and USD 45,000 per year, while SAP SuccessFactors lists USD 28–38 per employee monthly plus implementation charges that can equal the first year’s licence spend. Organisations commonly earmark 1–2% of payroll for engagement; at USD 400,000 monthly wages, this equals USD 4,000–8,000—before change-management outlays. Budget strain slows projects in mid-market firms, even though this segment shows the fastest 19.10% CAGR in adoption.
Data-Privacy and Compliance Concerns
Europe’s GDPR and similar laws heighten scrutiny of behavioural analytics. Annual compliance programmes for a mid-size roll-out can exceed USD 50,000, rivaling software cost. Research in Frontiers in Human Dynamics warns that neuro-monitoring devices demand explicit worker consent and rigorous anonymisation. With 95% of employees voicing distrust of algorithmic monitoring, buyers must invest in transparent data governance, peppering projects with legal audits and ethics reviews. This overhead can delay deployments or constrain advanced sentiment tracking in privacy-sensitive verticals.
*Our forecasts treat driver/restraint impacts as directional, not additive. The impact forecasts reflect baseline growth, mix effects, and variable interactions.
Segment Analysis
By Offering: Solutions Lead Platform Integration
Solutions generated 69.62% revenue in 2025, confirming employer preference for holistic platforms over point tools. The employee engagement market size for solution suites is projected to climb at a 15%-plus trajectory as buyers seek end-to-end feedback, analytics, and intervention in one workspace. Services, however, will outpace at 18.02% CAGR because AI roll-outs demand change-management, integration, and data-science expertise.
Demand now centres on integrated ecosystems. Microsoft Viva amalgamates communication, learning, goals, and feedback in Microsoft 365. Consulting partners wrap these suites with onboarding, survey design, and behavioural-science advisory, widening the total addressable revenue pool. Bundled offerings reduce vendor sprawl, simplify data governance, and speed insight cycles, solidifying platform leadership across the employee engagement market.


By Deployment Mode: Cloud Dominance Accelerates
Cloud captured 74.63% of 2025 spend and will grow at 18.44% CAGR. Real-time analytics and AI workflows flourish in elastic architectures, making cloud the default pathway for global roll-outs. On-premise persists in defence, public sector, and heavily regulated finance, but vendors now launch hybrid options that park sensitive data locally yet leverage cloud engines for modelling.
Workday’s cloud strategy produced USD 8.446 billion total 2025 revenue, validating the model’s economics. Resilience, automatic updates, and geographic reach position cloud as indispensable for dispersed staff. Buyers vet providers for regional data centres, encryption, and compliance certifications to satisfy data-residency statutes while unlocking AI toolsets only available in hyperscale environments.
By Enterprise Size: SMEs Drive Adoption Acceleration
Large companies still hold 55.94% revenue, leveraging deep budgets and global programmes to standardise experience. Yet SMEs are the growth engine, expanding at 18.68% CAGR and gaining tools once reserved for multinationals. The employee engagement market share of SMEs will therefore climb steadily this decade.
Vendors introduced tiered pricing, low-code set-ups, and templated survey packs aimed at organisations with under 1,000 staff. Cloud delivery further lowers entry barriers, while AI-curated dashboards give modest HR teams strategic insight without hiring data scientists. Agile culture lets SMEs pilot features quickly, often realising ROI within one fiscal year.
By End-User Vertical: Healthcare Accelerates Post-Pandemic
IT and Telecom generated 28.76% of 2025 revenue thanks to tech-savvy workforces and existing digital stacks. Healthcare is forecast to post the highest 19.12% CAGR as nursing shortages and clinician burnout intensify retention risk. The employee engagement market size for healthcare programmes is forecast to double by 2031 if current spending intent materialises.
Hospitals layer pulse-survey bots, recognition feeds, and wellbeing modules into electronic medical-record systems to support frontline staff. Post-COVID budgets earmark mental-health and community-building applications. Vendors tailor compliance features around HIPAA and duty-hours tracking, securing footholds that general-purpose platforms cannot.
By Functionality: Analytics Drive Intelligence Evolution
Surveys and Feedback maintained 33.74% share in 2025 as the primary data-capture conduit. Analytics and Insights will expand fastest at 20.46% CAGR, moving the employee engagement market from scorecards to predictive coaching. GenAI engines surface flight-risk cohorts, recommend nudges, and auto-draft action plans.
Recognition modules grow through gamification and micro-bonuses, improving morale in distributed workforces. Performance and Goal Management converges with engagement, aligning individual sentiment with corporate OKRs. Wellness features add stress-tracking and tele-therapy, rounding out holistic experience suites.
Geography Analysis
North America held 35.52% of global 2025 revenue, reflecting large installed SaaS bases and strict compliance mandates that prompt investment in holistic engagement suites. Microsoft Viva permeates more than 60% of Fortune 500 organisations, underlining platform entrenchment. Yet scepticism remains: 95% of workers question boss-led AI decisions, slowing advanced analytics in some firms. Banking illustrates progress, climbing engagement ranks from ninth to fifth among 17 industries after targeted flexibility initiatives.
Asia-Pacific is the fastest-growing region at 18.74% CAGR, driven by cloud adoption, youthful tech talent pools, and aggressive skilling commitments. Hitachi and Microsoft plan to train 50,000 GenAI specialists, demonstrating government-aligned workforce strategies. Multinationals localise engagement modules for language, mobile adoption, and labour codes, propelling the employee engagement market across India, Indonesia, and Vietnam. Regulatory heterogeneity spurs demand for configurable platforms that toggle data-residency and privacy settings per jurisdiction.
Europe prioritises data-protection-centric platforms to comply with GDPR and worker-council oversight. Frontiers in Human Dynamics research stresses ethical guardrails for neuro-monitoring and behavioural analytics . ESG frameworks embed social metrics, making engagement scores part of annual sustainability filings. Vendors that certify ISO/IEC 27001 and offer in-region hosting gain an edge. Economies such as Germany and France focus on healthcare and manufacturing engagement cases, seeking to reduce absenteeism and upskill ageing workforces.

Competitive Landscape
The employee engagement market is moderately concentrated. Microsoft’s Viva ecosystem anchors enterprise deployments and benefits from tight integration with Microsoft 365, fuelling adoption across 60% of Fortune 500 clients. Workday reinforces its HCM moat with new AI Agent Partner Network alliances with Accenture, AWS, and Microsoft, positioning its Agent System of Record as a governance layer for human-and-AI collaboration. SAP embeds experience-management tools within SuccessFactors, targeting compliance-heavy sectors.
Specialists such as Culture Amp and Lattice focus on behavioural-science-based pulse surveys and goals alignment, winning share in mid-market tech and services firms. Healthcare-orientated entrants like WorkStep, bolstered by its WorkHound acquisition, extend analytics to frontline trucking and logistics. Strategic activity features tuck-in buys that close functionality gaps—recognition, wellbeing, or coaching—so vendors can pitch single-vendor stacks. The next competitive frontier is GenAI differentiation: model transparency, data-lineage tracing, and ROI dashboards.
Vendor messaging increasingly highlights ethical AI, privacy-by-design, and international data controls, reflecting procurement scoring that ranks trust as high as feature set. Market participants that link engagement metrics to hard financial outcomes—turnover cost, productivity lift—are best placed to command premium pricing.
Employee Engagement Industry Leaders
Microsoft Corporation
Workday, Inc.
SAP SE
Culture Amp Pty Ltd
15Five, Inc.
- *Disclaimer: Major Players sorted in no particular order

Recent Industry Developments
- June 2025: Workday introduced its AI Agent Partner Network and Agent Gateway to manage third-party agents through a unified Agent System of Record, partnering with Accenture, AWS, and Microsoft.
- May 2025: TELUS Health closed a USD 500 million acquisition of Workplace Options, creating a wellbeing network of 180,000 providers across 200 countries.
- April 2025: Microsoft launched People Skills in Copilot, adding AI abilities that streamline HR processes.
- April 2025: WorkStep acquired WorkHound to deepen AI-based frontline engagement in logistics.


Research Methodology Framework and Report Scope
Market Definitions and Key Coverage
Our study defines the employee engagement market as the annual revenue earned from purpose-built digital tools, pulse-survey suites, continuous recognition modules, real-time feedback dashboards, analytics, and coaching add-ons that are licensed or subscribed to by organizations to lift motivation, retention, and discretionary effort. According to Mordor Intelligence, this market was valued at USD 1.10 billion in 2025 and is forecast to reach USD 2.25 billion by 2030, expanding at 15.46 % CAGR.
The study omits stand-alone HR consulting fees, one-off classroom trainings, and generic intranet or messaging platforms that do not feature engagement-specific measurement or analytics.
Segmentation Overview
- By Offering
- Solutions
- Services
- By Deployment Mode
- Cloud
- On-Premise
- By Enterprise Size
- Small and Medium Enterprises (SMEs)
- Large Enterprises
- By End-user Vertical
- IT and Telecom
- BFSI
- Retail and E-commerce
- Healthcare and Life Sciences
- Manufacturing
- Public Sector and Others
- By Functionality
- Surveys and Feedback
- Recognition and Rewards
- Performance and Goal Management
- Wellness and Well-being
- Analytics and Insights
- By Geography
- North America
- United States
- Canada
- Mexico
- South America
- Brazil
- Argentina
- Rest of South America
- Europe
- Germany
- United Kingdom
- France
- Italy
- Spain
- Russia
- Rest of Europe
- Asia-Pacific
- China
- Japan
- India
- South Korea
- Australia and New Zealand
- Rest of Asia-Pacific
- Middle East and Africa
- Middle East
- Saudi Arabia
- United Arab Emirates
- Turkey
- Rest of Middle East
- Africa
- South Africa
- Nigeria
- Egypt
- Rest of Africa
- Middle East
- North America
Detailed Research Methodology and Data Validation
Primary Research
We interviewed HR chiefs, talent-analytics managers, and channel partners across North America, Europe, and fast-growing Asian economies. Their inputs validated adoption thresholds, average seat pricing, and cloud migration timelines, giving us first-hand evidence to fine-tune assumptions molded from desk work.
Desk Research
We began with recognized public sources such as the US Bureau of Labor Statistics, Eurostat, the International Labor Organization, Gallup workplace polls, and Society for Human Resource Management briefs, which offered baseline workforce counts, voluntary-turnover rates, and engagement benchmarks across industries.
Trade associations like the HR Technology Alliance and the National Retail Federation helped us size end-user cohorts, while financial filings from publicly listed vendors clarified segment revenue splits.
To enrich those fundamentals, analysts tapped paid repositories, including D&B Hoovers for company financials and Dow Jones Factiva for deal news, to verify supplier roll-outs and regional license pricing.
Patent analytics from Questel signaled upcoming functionalities (e.g. AI-led sentiment engines) that could sway adoption curves.
This list is illustrative; many other sources fed into data gathering, cross-checks, and contextual clarification.
Market-Sizing & Forecasting
Mordor's model starts with a top-down build. Global employed workforce by sector is multiplied by tool-penetration ratios and average annual spend per seat, reconstructed from payroll software attach rates and survey-platform user caps. Selective bottom-up roll-ups, vendor revenue samples and regional channel checks, act as guardrails, with variances adjusted where the two approaches differ materially. Key variables include remote-work prevalence, mid-market cloud adoption share, average seat-price erosion, voluntary attrition costs, AI-feature penetration, and GDP-weighted hiring outlooks; each variable is forecast through multivariate regression blended with exponential smoothing to capture cyclical swings. Where bottom-up inputs lacked coverage, penetration gaps were bridged using weighted proxies from adjacent HR tech segments before being re-validated with experts.
Data Validation & Update Cycle
Outputs move through anomaly flags, peer review, and senior-analyst sign-off. We re-contact sources when variance exceeds pre-set thresholds. Reports refresh every twelve months, with interim updates triggered by major funding rounds, regulatory shifts, or step-changes in remote-work policy, ensuring buyers receive the latest calibrated view.
Why Mordor's Employee Engagement Baseline Stands Up to Scrutiny
Published estimates often diverge because firms select different scope boundaries, currency bases, and refresh cadences, so decision-makers bump into wide ranges when comparing figures.
Key gap drivers center on whether services revenue is counted, how aggressive seat-price deflation is modeled, and whether bookings or recognized revenue anchor totals. Our disciplined scope, live-price tracking, and annual refresh mean Mordor's baseline aligns closely with what finance teams actually spend, not what vendors book in pipeline.
Benchmark comparison
| Market Size | Anonymized source | Primary gap driver |
|---|---|---|
| USD 1.10 B (2025) | Mordor Intelligence | - |
| USD 1.05 B (2024) | Global Consultancy A | Counts only software fees, omits advisory and integration services |
| USD 1.05 B (2024) | Industry Journal B | Uses constant 2022 dollars and folds recognition programs inside engagement scope |
| USD 1.07 B (2024) | Regional Consultancy C | Relies on vendor bookings rather than realized revenue, inflating early-stage deals |
The comparison shows that once adjustments for scope breadth, revenue recognition, and currency year are applied, competing figures converge toward Mordor's baseline, underscoring that our transparent variables and repeatable steps deliver a dependable starting point for strategic planning.


Key Questions Answered in the Report
What is the current size of the employee engagement market?
The market generated USD 1.27 billion in 2026 and is projected to hit USD 2.58 billion by 2031.
Which deployment model dominates employee engagement programs?
Cloud solutions hold 74.63% revenue share and are growing at 18.44% CAGR thanks to scalability and AI enablement.
Why is healthcare the fastest-growing vertical?
Post-pandemic retention issues and regulatory emphasis on worker wellbeing are pushing healthcare engagement spending at a 19.12% CAGR.
How quickly are SMEs adopting engagement platforms?
SMEs represent the fastest-growing enterprise segment at 18.68% CAGR, enabled by tiered pricing and low-code cloud deployment.
What are the main barriers to adoption?
High subscription and implementation costs plus stringent data-privacy regulations, especially in Europe, are the two biggest inhibitors.
Which region will expand fastest through 2031?
Asia-Pacific is set to grow the employee engagement market at 18.74% CAGR, driven by large-scale digital-skills programs and cloud investment.
Page last updated on:


