Global Emergency Department Information System Market Size and Share
Market Overview
| Study Period | 2020 - 2031 |
|---|---|
| Forecast Data Period | 2026 - 2031 |
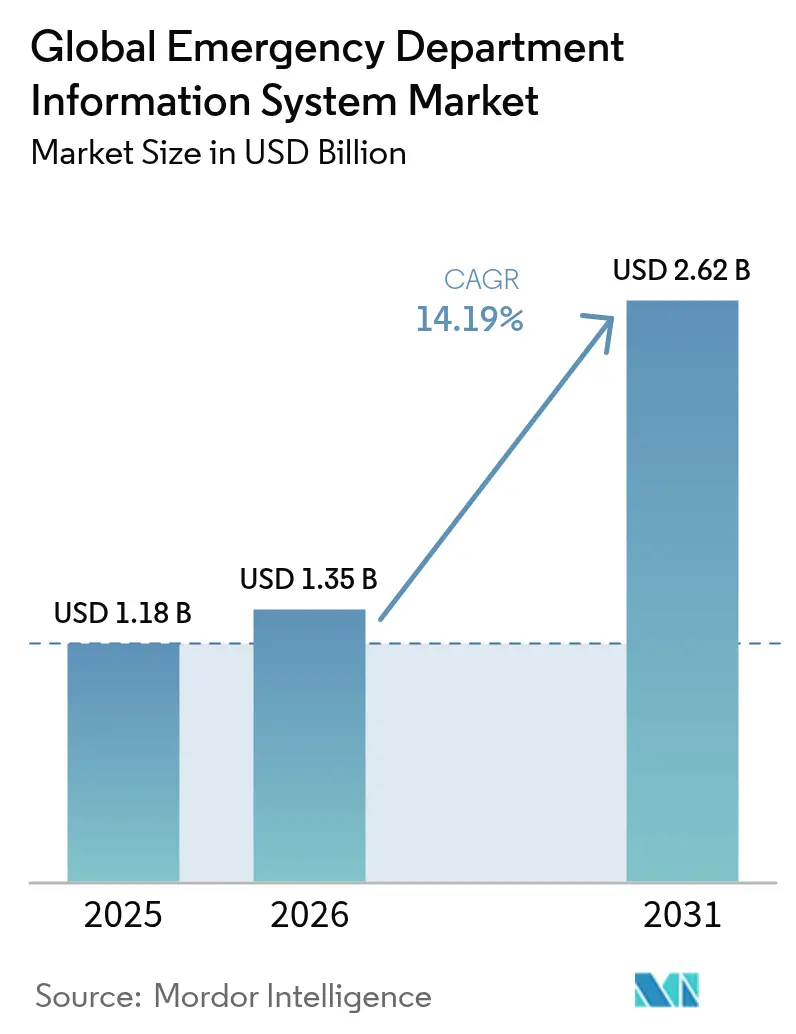
| Market Size (2026) | USD 1.35 Billion |
| Market Size (2031) | USD 2.62 Billion |
| Growth Rate (2026 - 2031) | 14.19% CAGR |
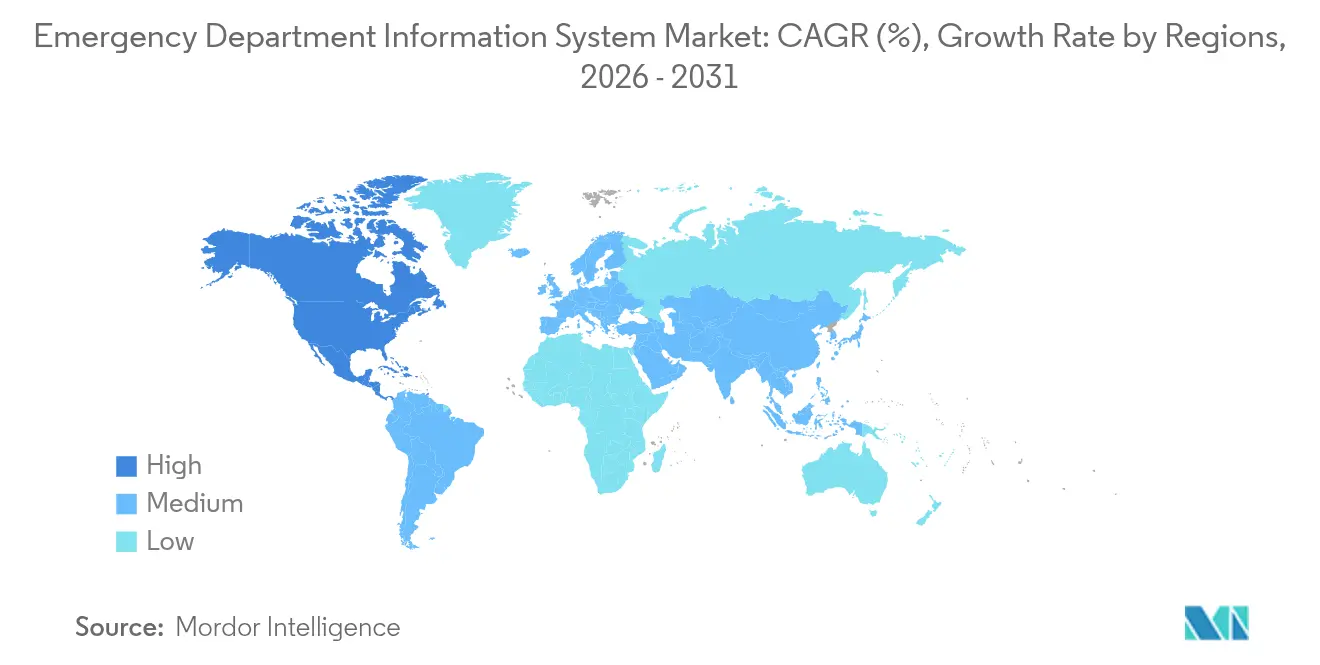
| Fastest Growing Market | Asia Pacific |
| Largest Market | North America |
Major Players *Disclaimer: Major Players sorted in no particular order Image © Mordor Intelligence. Reuse requires attribution under CC BY 4.0. | |
Global Emergency Department Information System Market Analysis by Mordor Intelligence
Emergency Department Information System market size in 2026 is estimated at USD 1.35 billion, growing from 2025 value of USD 1.18 billion with 2031 projections showing USD 2.62 billion, growing at 14.19% CAGR over 2026-2031. Wider adoption is driven by mandatory time-to-treatment indicators, the integration of AI-enabled clinical decision support, and a swift shift toward SaaS deployment in community hospitals. Providers are deploying these systems to cut overcrowding, comply with quality mandates, and secure reimbursement tied to patient-centric metrics cms.gov. Tighter cybersecurity expectations, meanwhile, push vendors to embed zero-trust architectures without slowing clinical workflows. Competitive dynamics are evolving quickly after Oracle’s acquisition of Cerner, which opened white-space for specialist vendors and widened Epic’s installed-base lead.
Key Report Takeaways
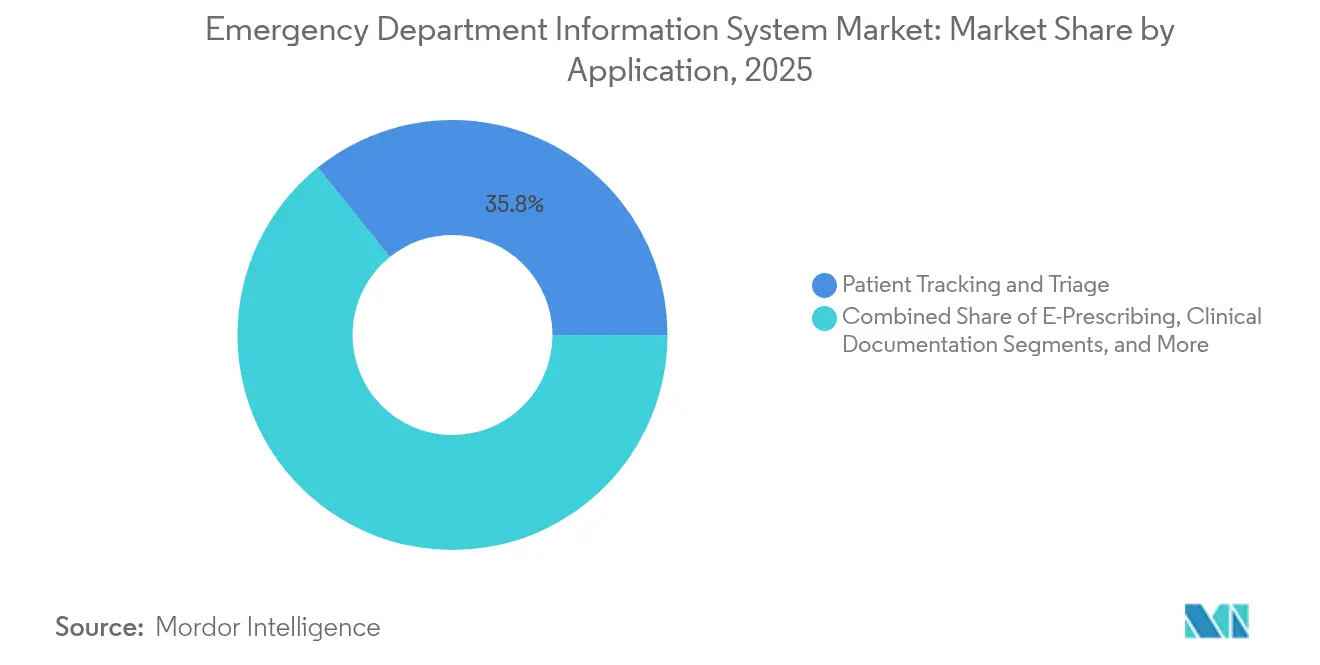
- By application, Patient Tracking & Triage led with 35.78% of Emergency Department Information System market share in 2025, whereas E-Prescribing is projected to post the fastest 14.73% CAGR to 2031.
- By deployment, SaaS captured 64.62% share of the Emergency Department Information System market size in 2025; On-Premise is expected to expand at a 14.85% CAGR through 2031.
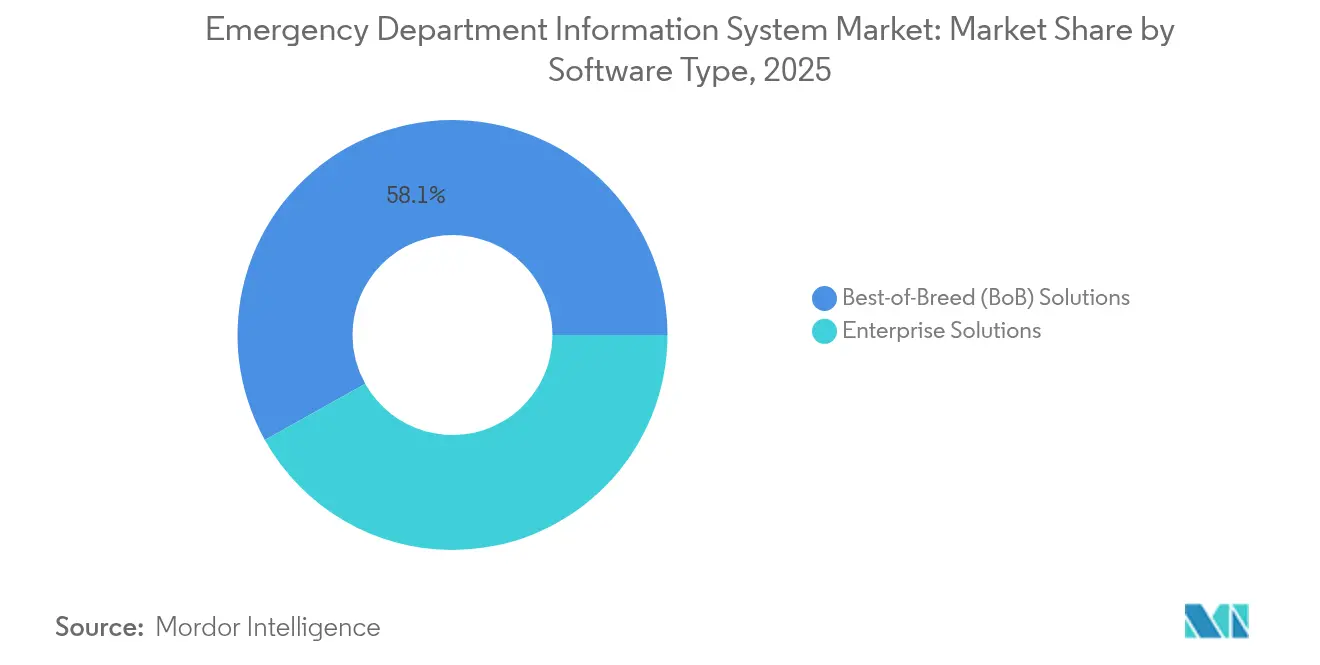
- By software type, Best-of-Breed solutions dominated with 58.11% share in 2025, yet Enterprise platforms are set to record the highest 15.18% CAGR to 2031.
- By end user, medium hospitals (101-299 beds) accounted for 41.98% of the Emergency Department Information System market in 2025, while large hospitals (≥300 beds) are forecast to log a 14.98% CAGR to 2031.
- By geography, North America held 44.78% revenue share in 2025 and Asia-Pacific is poised for a 15.53% CAGR through 2031.
Note: Market size and forecast figures in this report are generated using Mordor Intelligence’s proprietary estimation framework, updated with the latest available data and insights as of 2026.
Market Trends and Insights
Drivers Impact Analysis of Global Emergency Department Information System Market*
| Driver | (~) % Impact on CAGR Forecast | Geographic Relevance | Impact Timeline |
|---|---|---|---|
| AI-enabled clinical decision support integration | +2.8% | Global with early uptake in North America and Europe | Medium term (2-4 years) |
| Patient-centric quality-metric reimbursement models | +2.1% | North America core, expanding to Asia-Pacific | Long term (≥4 years) |
| Rapid growth of SaaS-based EDIS in community hospitals | +3.2% | Global, strongest in rural and community settings | Short term (≤2 years) |
| Mandatory time-to-treatment key performance indicators | +1.9% | North America and European Union | Medium term (2-4 years) |
| Real-time health-data exchange frameworks (FHIR, TEFCA) | +2.4% | North America with spillover to developed markets | Long term (≥4 years) |
| Edge analytics with 5G in ambulance-to-ED data flow | +1.8% | Urban centers worldwide | Long term (≥4 years) |
| Source: Mordor Intelligence | |||
AI-enabled clinical decision support integration
AI tools now match human acuity classification accuracy at 89% and have cut emergency cardiovascular time-to-treatment by 205.4 minutes, proving value in real-world triage [1]Adamson B., “Performance of Large Language Models in Emergency Severity Index Classification,” JAMA Network Open, jamanetwork.com. Large providers such as HCA Healthcare run ambient documentation across 184 departments with 99% patient acceptance. Equally important, predictive models outperform traditional scoring with AUROC readings above 0.92, positioning AI as a core differentiator in both outcomes and operational efficiency.
Increasing patient-centric quality-metric reimbursement models
Medicare’s Value-Based Purchasing ties hospital payment to throughput and experience scores, making emergency department performance a direct revenue lever. Declining commercial reimbursements heighten the urgency to streamline workflows, while new equity measures rolling out in 2024 embed social determinants into emergency metrics. Hospitals that adapt early can safeguard margins and mitigate the 3.8% revenue erosion documented from 2018 to 2022.
Rapid growth of SaaS-based EDIS in community hospitals
Cloud delivery lowers capital outlay and IT staffing requirements. Community facilities replacing legacy systems show cost savings after the first year of SaaS adoption, and rural sites benefit from automated upgrades that keep limited teams compliant with latest standards. The model also simplifies multi-site scaling, which is crucial as private Asian providers plan rapid bed additions
Mandatory time-to-treatment key performance indicators
Joint Commission ED-2 and CMS 42 CFR 482.55 compel providers to record precise admit-decision-to-departure times, driving demand for near-real-time dashboards [2]Joint Commission, “Specification Manual for National Hospital Inpatient Quality Measures,” jointcommission.org. Upcoming enforcement in July 2025 intensifies focus on accurate timestamp capture and automated reporting.
Surge in real-time health-data exchange frameworks (FHIR, TEFCA)
The Trusted Exchange Framework moves toward national QHIN routing in 2025, making FHIR capacity a prerequisite for emergency data liquidity. New Carequality policies and ONC data-element standards further press vendors to embed open APIs, shortening lab result retrieval and improving cross-facility handoffs.
Edge analytics & 5G deployment in ambulance-to-ED data flow
5G-connected ambulances in India and China have extended rescue radius six-fold and cut response times below 20 minutes [3]Li X., “5G Emergency Medical Management System Outcomes,” PubMed, pubmed.ncbi.nlm.nih.gov. FirstNet and Vodafone pilots show that low-latency streaming of vitals enables ED clinicians to prepare interventions before arrival, lifting survival probabilities in trauma and stroke.
Restraints Impact Analysis of Global Emergency Department Information System Market*
| Restraint | (~) % Impact on CAGR Forecast | Geographic Relevance | Impact Timeline |
|---|---|---|---|
| Cyber-security breach liabilities and insurance premiums | -1.4% | Global, greatest in North America and Europe | Short term (≤2 years) |
| Clinician burnout linked to complex EHR interfaces | -0.9% | Global, acute in developed markets | Medium term (2-4 years) |
| Fragmented middleware standards for device integration | -0.7% | Global, varies by vendor ecosystem | Long term (≥4 years) |
| Budget freezes in public hospitals post-pandemic | -1.2% | Global, acute in public systems | Short term (≤2 years) |
| Source: Mordor Intelligence | |||
Cyber-security breach liabilities and insurance premiums
Average breach cost climbed to USD 9.77 million in 2024 and hospitals can lose USD 2 million daily during attacks, prompting CFOs to delay non-essential IT rollouts. Rising cyber-insurance loss ratios are pushing premiums up, particularly for cloud-dependent workflows.
Clinician burnout linked to complex EHR interfaces
Physician-rated usability sits at 45.9 on the SUS, below the acceptable threshold and closely tied to burnout odds. Emergency clinicians, already facing rapid decision cycles, resist systems that add clicks without obvious value. Vendors must pair AI augmentation with stripped-down interfaces to win adoption.
*Our forecasts treat driver/restraint impacts as directional, not additive. The impact forecasts reflect baseline growth, mix effects, and variable interactions.
Global Emergency Department Information System Market Segment Analysis
By Application:
Patient Tracking & Triage Lead WorkflowsPatient Tracking & Triage captured 35.78% of Emergency Department Information System market share in 2025 as hospitals prioritized real-time bed status and acuity dashboards. The segment’s dominance is reinforced by regulatory focus on door-to-doctor benchmarks and by AI tools that flag sepsis and stroke earlier than manual checks. E-Prescribing is the fastest riser at a 14.73% CAGR, fueled by opioid-risk monitoring that mandates electronic scripts across many US states. Clinical Documentation holds significant weight as large providers deploy ambient voice capture to trim physician screen time. CPOE adoption remains steady because medication safety protocols demand closed-loop orders. Emerging analytics that fold predictive acuity scoring into triage modules hint at future convergence where a single workflow covers initial assessment through documentation.
Looking forward, patient-tracking modules will integrate with 5G telemetry to ingest ambulance vitals long before arrival, while triage engines will layer natural-language queries on top of machine-learning recommendations. Hospitals continuing to run siloed tracking boards risk missing capacity triggers that AI can surface minutes sooner. As quality-metric reimbursement deepens, even smaller facilities will adopt advanced triage dashboards that now sit only in academic centers. The Emergency Department Information System market will therefore see rising license penetration for multi-module suites that merge tracking, prescribing, and documentation into a unified record.


By Deployment:
SaaS Extends Reach to Resource-Constrained SitesSaaS delivery held 64.62% share of the Emergency Department Information System market size in 2025. Providers cite lower up-front capital, faster go-live timelines, and automatic regulatory updates as key reasons. Community hospitals with lean IT teams offload maintenance to vendors, freeing budgets for analytics add-ons. Large health systems still expand cloud footprints but also maintain on-premise clusters for latency-sensitive imaging, which explains the segment’s 14.85% CAGR outlook. The post-pandemic workforce crunch accelerates cloud uptake because remote upgrades need fewer in-house engineers.
Hybrid patterns will deepen as edge gateways process high-frequency vitals locally while archiving summary data to a central cloud. Cyber-insurance stipulations now require explicit disaster-recovery run-books, favoring SaaS vendors with audited redundancy. International expansion highlights bandwidth challenges yet multi-zone architectures and offline sync mitigate outages. As regulatory audits increasingly ask for immutable log trails, cloud providers offering real-time compliance dashboards gain mind-share. Growth in the Emergency Department Information System market will therefore pivot on vendor ability to mix cloud economics with hospital-grade resilience.
By Software Type:
Best-of-Breed Retains Specialized EdgeBest-of-Breed platforms held 58.11% share in 2025 because emergency departments need acuity features that generic EHRs lack. Color-coded patient maps, rapid order sets, and AI triage widgets often arrive first in specialist solutions. Nonetheless, Enterprise suites aim for a 15.18% CAGR as CIOs seek single-vendor road maps and unified data models. FHIR standards loosen historical lock-in by enabling specialist apps to exchange data without bespoke interfaces.
The calculus now weighs functional depth against integration overhead. Best-of-Breed vendors respond with packaged middleware and vendor-neutral APIs to dodge the interface tax. Enterprise providers counter with emergency-specific modules that mimic specialist layouts while keeping data native. Decision makers increasingly run total cost scenarios that include upgrade friction and clinician retraining costs. As open API mandates expand, hybrid deployments mixing deep specialty tools with backbone EHRs could become the default configuration for the Emergency Department Information System market.
By End User:
Medium Hospitals Anchor Installed BaseFacilities with 101-299 beds controlled 41.98% of installed systems in 2025, reflecting balanced caseloads and capital budgets. These hospitals face throughput pressure comparable to large centers yet must stretch smaller IT teams, making turnkey SaaS attractive. Large institutions show a 14.98% CAGR because they pilot AI triage, ambient documentation, and predictive staffing. Wide bandwidth and in-house data-science talent help them operationalize advanced models.
Small hospitals and critical-access sites wrestle with aging platforms; 42% still run legacy software. Replacement demand is sizable but won only when vendors offer subscription pricing and minimal downtime conversions. Tele-consult overlays gain traction in rural sites where specialists are scarce. Meanwhile, academic centers bundle EDIS data into research pipelines, generating evidence that feeds vendor road maps. Diverse user requirements push suppliers to modularize offerings, ensuring the Emergency Department Information System market remains responsive across size tiers.
Geography Analysis
North America Emergency Department Information System Market
North America retained 44.78% of Emergency Department Information System market revenue in 2025. CMS quality reporting and Joint Commission accreditation oblige hospitals to document admit-decision-to-departure metrics, and over 130 million annual ED visits intensify the need for precise patient tracking. Medicare payment declines recorded between 2018 and 2022 add financial urgency to efficiency drives. TEFCA rollout and FHIR incentives further compel platform upgrades that guarantee real-time interoperability. Large networks such as Providence Health & Services pursue aggressive cost containment, underscoring technology’s role in offsetting reimbursement stress.
APAC Emergency Department Information System Market
Asia-Pacific is the fastest-growing region at a 15.53% CAGR to 2031. Governments fund hospital modernization and private chains forecast high profit margins from digital expansion. 5G medical command centers in China extend rescue reach and cut cross-district transfer times, proving the value of advanced connectivity. Yet rising bankruptcies among Chinese hospitals highlight uneven financial health, requiring modular pricing that scales with volume. In Southeast Asia, directors prioritize diagnostic imaging and primary care investments which naturally link to emergency-department digital tools.
Europe Emergency Department Information System Market
Europe posts steady uptake shaped by national health-service structures and interoperability regulations. Germany’s Hospital Future Act channels more than EUR 4 billion into digital projects, and audits reveal hospitals excel in infrastructure yet lag in telehealth penetration. The European Health Data Space will standardize record formats, aiding cross-border patient flows. Projects such as eCREAM aim to harmonize emergency documentation, while Italian studies show that larger, teaching hospitals digitize fastest, especially where emergency rooms act as transformation anchors. Eastern European systems seek coordinated funding to bridge their maturity gaps.

Regulatory Landscape
In the United States, emergency department information systems are shaped by ASTP/ONC certification and interoperability rules that increasingly anchor ED workflows to standardized data exchange. The ONC HTI-2 final rule (effective December 17, 2024) updated information blocking policies, while HTI-4 (published in 2025 within the FY 2026 IPPS/LTCH final rule package) advanced Health IT Certification Program requirements that affect certified modules used for ED e-prescribing and reporting. A key compliance lever for vendors is the Standards Version Advancement Process (SVAP), which enables voluntary adoption of newer standards for certified health IT, with the 2026 cycle allowing approved voluntary incorporations beginning August 29, 2026.
In Europe, the European Health Data Space (EHDS) Regulation (EU) 2025/327 entered into force in March 2025 and sets a phased framework for EHR systems and cross-border data use. Member States must establish digital health authorities by March 26, 2027, with primary-use electronic health data obligations for priority categories (including patient summaries and e-prescriptions) applying from March 26, 2029. For global EDIS vendors, this creates parallel tracks: ongoing US certification and information-blocking alignment alongside EU readiness for authority-led governance and standardized EHR exchange requirements.
Value Chain Analysis
The EDIS value chain starts with requirements and standards definition (ASTP/ONC certification criteria, USCDI-aligned data elements such as the Emergency Department Note, and interoperability specifications including HL7 FHIR Release 4.0.1 referenced in 45 CFR 170.215). Product development and configuration follow, spanning clinical workflow design (triage, tracking, documentation, CPOE, e-prescribing), API enablement, cybersecurity controls, and analytics/AI layers. Distribution and delivery increasingly run through SaaS provisioning and integration with enterprise EHRs, health information exchange networks, and adjacent emergency workflows (ambulance-to-ED data feeds and observation capture).
Downstream value capture concentrates in implementation services (clinical build, interface mapping, and change management), ongoing managed operations (updates, monitoring, and compliance reporting), and optimization (dashboards for throughput, time-to-treatment indicators, and reimbursement-linked quality reporting). Interoperability tooling and terminology mapping (for example, LOINC-coded observations in emergency settings and DEEDS-aligned data structures) remain a recurring dependency for both best-of-breed and enterprise platforms. Hardware dependence is lower for pure software vendors, but it remains relevant for on-premise deployments and ED-specific workstations and displays, where hospital procurement and server supply availability can affect timelines.
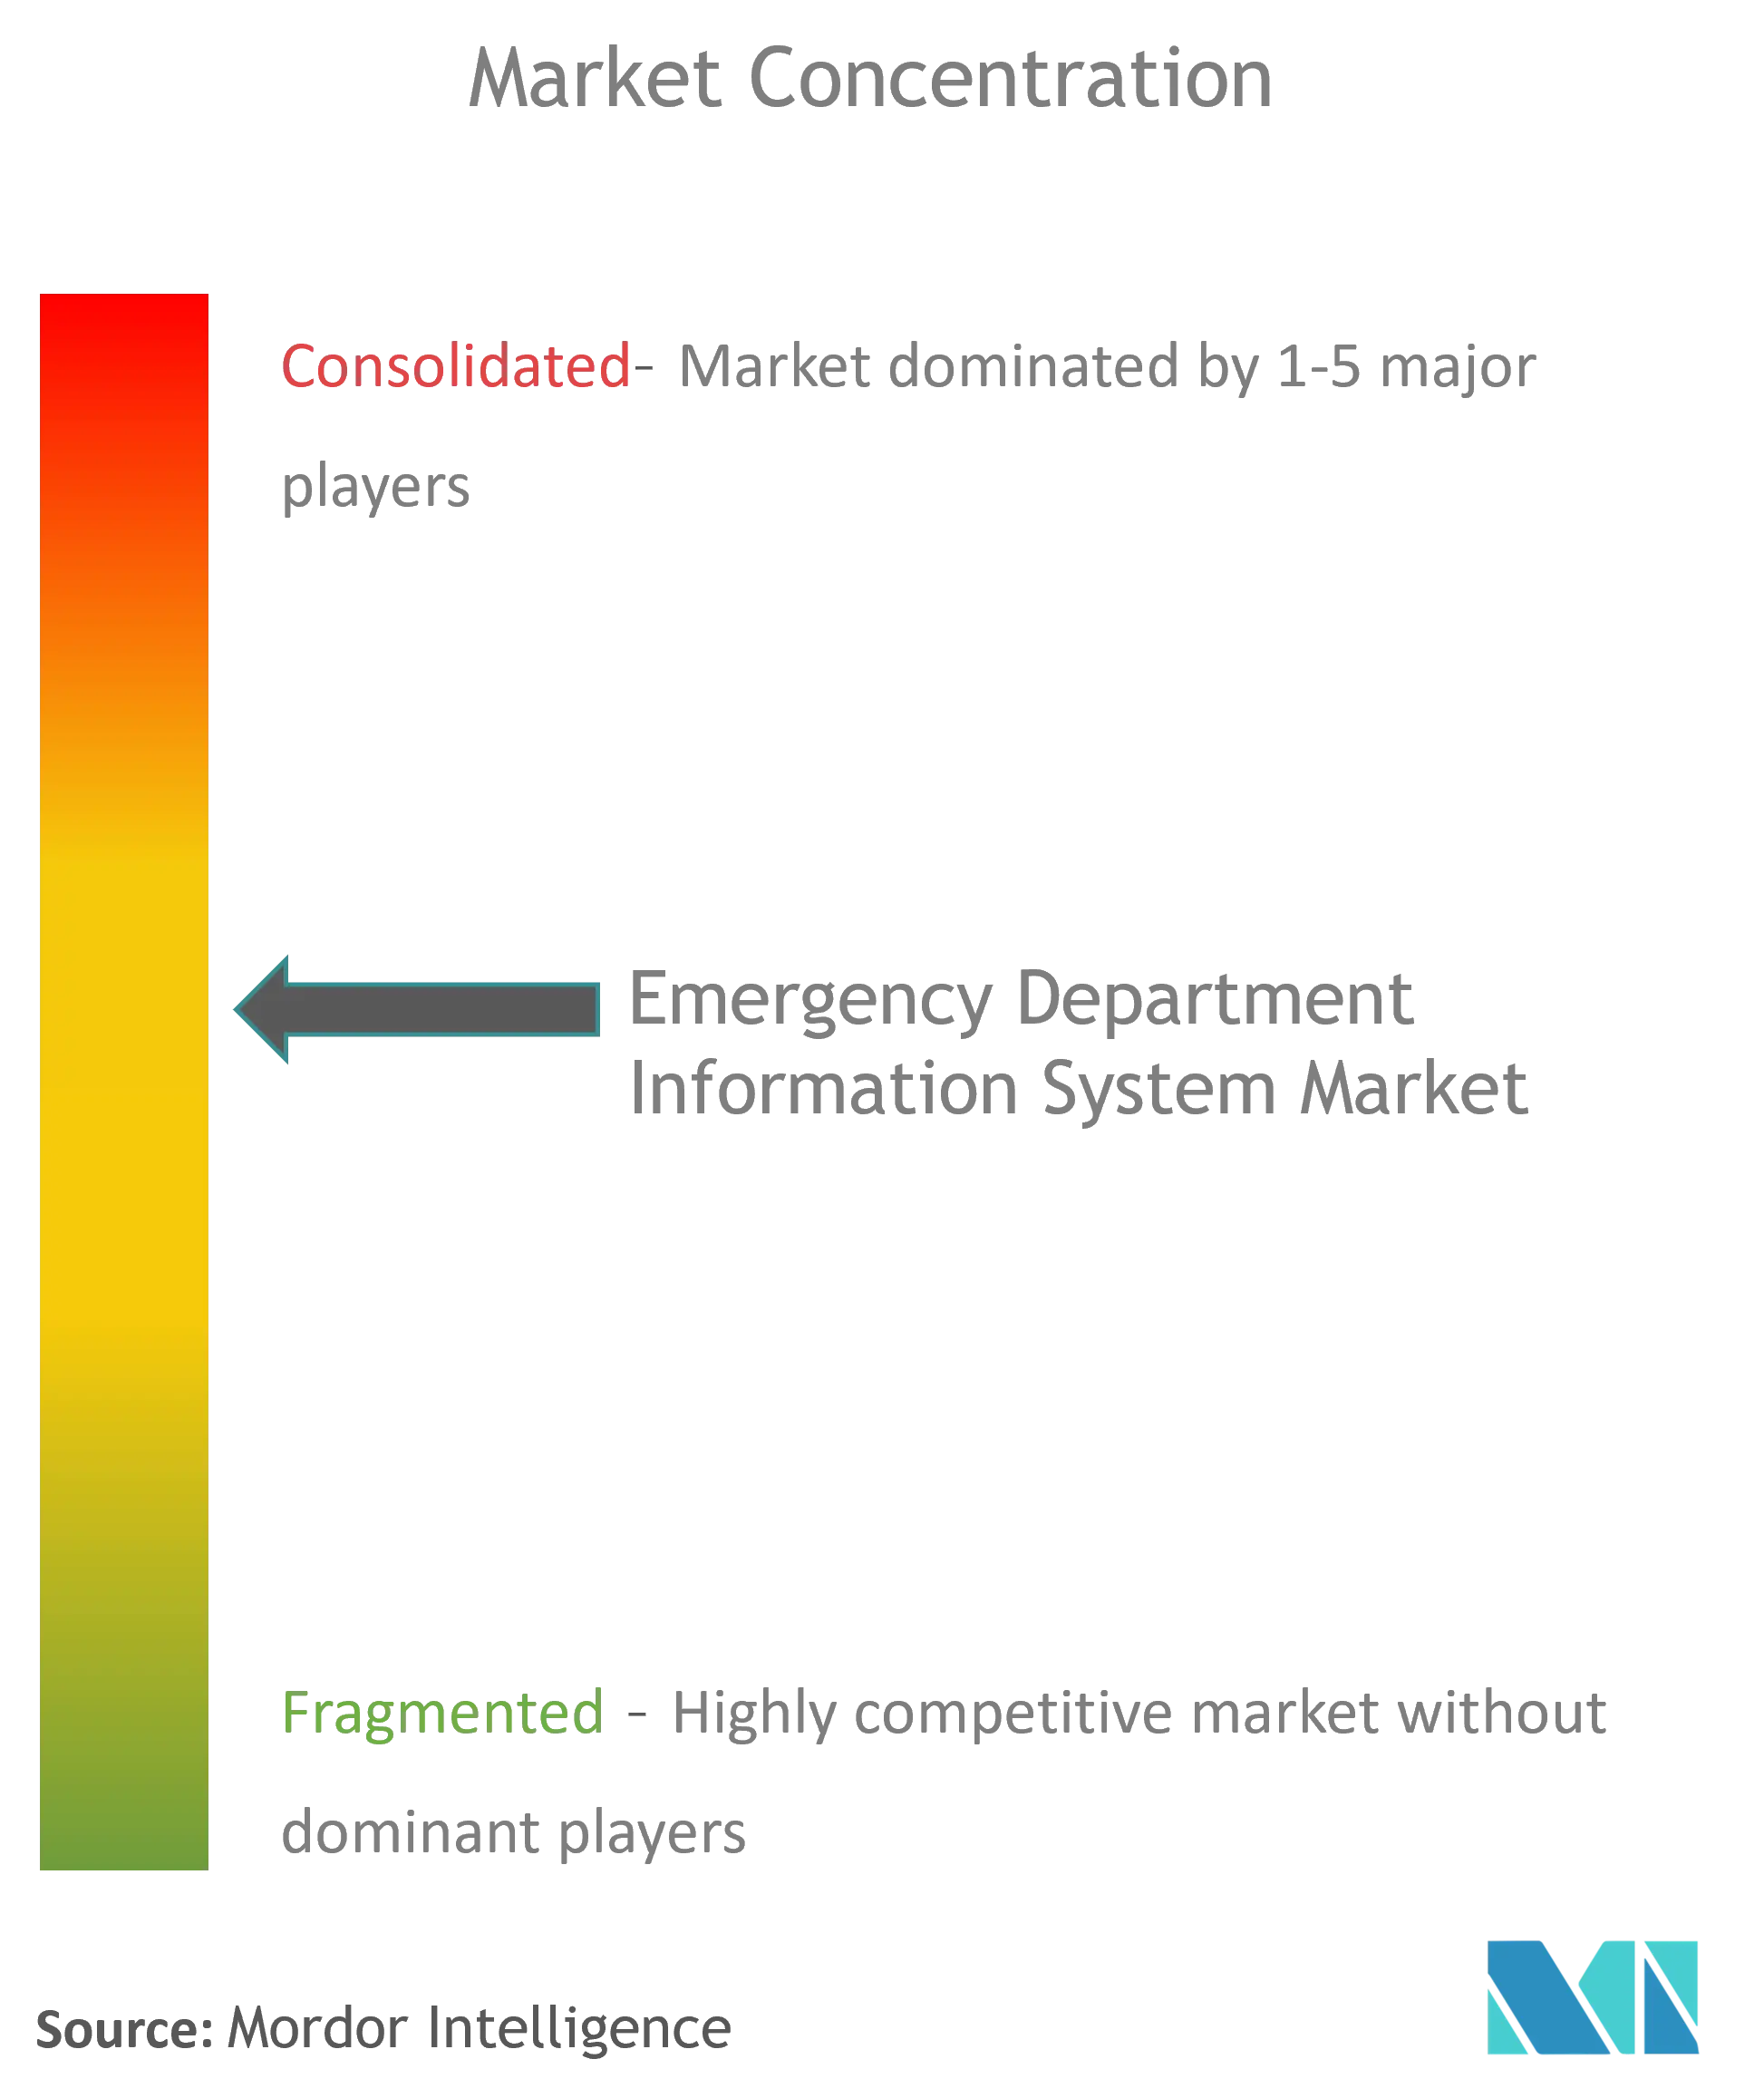
Competitive Landscape
The Emergency Department Information System market shows moderate consolidation following Oracle’s USD 28.4 billion purchase of Cerner. Post-acquisition integration issues cost Oracle 74 hospital customers in 2024 while Epic added 176 sites and 29,399 beds, illustrating the premium hospitals place on stability and product evolution. Epic continues to spotlight integrated data flow and intuitive dashboards. Oracle positions conversational AI to regain momentum, whereas MEDITECH relies on as-a-Service packaging to attract cost-sensitive community hospitals.
Niche specialists expand where incumbents falter. MEDHOST, now backed by Harris Computer, targets rural and community facilities with simplified workflows. Start-ups like Mednition insert AI triage engines that overlay existing systems and flag acuity outliers within seconds. HEALWELL’s purchase of Orion Health for USD 50 million pushes data-fabric capabilities across vendor boundaries, signaling fresh focus on interoperability. Meanwhile, cybersecurity firms partner with EDIS providers to embed threat analytics at the application layer, reflecting customer anxiety over breach costs.
Product road maps converge on ambient documentation, predictive wait-time displays, and FHIR-native APIs. Vendors invest in natural-language processing that trims physician clicks, and machine learning that predicts surge staffing. Integration pacts with ambulance tele-health platforms promise to collapse pre-hospital and in-house data silos. As budget scrutiny tightens, suppliers demonstrating measurable reductions in length of stay and left-without-being-seen rates will capture expanded share within the Emergency Department Information System market.
Global Emergency Department Information System Industry Leaders
EPOWERdoc, Inc.
MEDHOST, Inc.
Medsphere Systems Corporation
Oracle Health (Cerner)
T-Systems International
- *Disclaimer: Major Players sorted in no particular order
Global Emergency Department Information System Market Companies Covered in this Report
- Oracle Health (Cerner)
- Epic Systems
- MEDHOST Inc.
- Meditech
- Allscripts
- Mckesson
- UnitedHealth Group (Optum Insight)
- EPOWERdoc Inc.
- T-Systems International
- Evident (CPSI)
- Logibec Inc.
- Medsphere Systems
- Picis Clinical Solutions
- Wellsoft Corporation
- Dedalus Group
- Koninklijke Philips
- Ascom
- Cantata Health
- VitalHub Corp.
- Global Health Ltd (MasterCare)
Read Analysis of Global Emergency Department Information System Companies

Market Opportunities and Future Outlook
A clear whitespace is the conversion of paper-based ED observations and manual throughput documentation into integrated digital capture that feeds real-time dashboards, decision support, and reporting. In June 2026, University Hospitals Sussex NHS Foundation Trust completed the shift at Royal Sussex County Hospital emergency department from paper-based observations to digital systems, highlighting demand for digitizing high-frequency ED monitoring and linking it to safer escalation and operational visibility. Similar modernization is visible in emerging markets, where in March 2026 Kenyatta National Hospital rolled out the Afya Apex HMIS/ERP paperless program integrating A&E and triage functions, creating a pathway for EDIS vendors to attach ED-specific workflows, analytics, and interoperability modules to broader hospital digital transformations.
Interoperability and data-governance programs are also opening upgrade cycles that favor EDIS platforms with standards-conformant, extensible data models. In the United States, the USCDI evolution and SVAP mechanisms (with the 2026 SVAP cycle allowing voluntary standards adoption from August 29, 2026) reward vendors that can update certified modules without disruptive rebuilds, while the inclusion of an Emergency Department Note as a standardized data element supports more consistent cross-facility exchange. In Europe, EHDS implementation milestones (digital health authorities due by March 26, 2027) push vendors serving multi-country providers to align ED datasets and access controls with emerging governance. Separately, federated analytics models showcased by Germany's national emergency department data registry infrastructure, which has supported access authorization across millions of ED records, point to an opportunity for EDIS suppliers to offer privacy-preserving, network-ready data extraction and research-grade interoperability capabilities alongside core throughput workflows.
Recent Industry Developments in Global Emergency Department Information System Market
- March 2026: MEDHOST announced MEDHOSTone, positioning it as an enterprise EHR evolution built around a single, connected patient story. The roadmap highlights tighter linkage between emergency department workflows and enterprise records, supporting providers that want fewer handoffs between ED modules and the broader inpatient and ambulatory environment.
- August 2025: CareCloud closed its acquisition of Medsphere Systems Corporation, bringing Medsphere hospital IT assets, including the Wellsoft EDIS platform, into CareClouds portfolio. The deal broadens CareClouds reach into hospital and emergency-department workflows and adds scale to product development and cross-selling into small and mid-market hospitals.
- December 2024: ASTP/ONC made the HTI-2 final rule effective, updating information blocking policy and related exceptions that influence how certified health IT shares and discloses electronic health information. For EDIS vendors and hospital buyers, the change elevates the importance of auditable interoperability controls and policy-aligned API behavior across ED documentation and exchange workflows.


Global Emergency Department Information System Market Report Scope and Research Methodology
Market Definition and Coverage
This market covers software used inside hospital emergency departments to register patients, support triage, track flow, document care, and connect orders, results, and billing through discharge. Revenue is counted from licenses or SaaS subscriptions, plus implementation and ongoing support services tied to the ED workflow.
Scope exclusions: This sizing does not include urgent care clinic platforms, standalone patient monitoring hardware, or general EHR modules that do not actively run emergency department workflows.
Segments Covered in This Report
- By Application
- Computerized Physician Order Entry (CPOE)
- Clinical Documentation
- Patient Tracking & Triage
- E-Prescribing
- Others
- By Deployment
- On-Premise
- Software-as-a-Service (SaaS)
- By Software Type
- Enterprise Solutions
- Best-of-Breed (BoB) Solutions
- By End User
- Small Hospitals (≤100 beds)
- Medium-Sized Hospitals (101-299 beds)
- Large Hospitals (≥300 beds)
- By Geography
- North America
- United States
- Canada
- Mexico
- Europe
- Germany
- United Kingdom
- France
- Italy
- Spain
- Rest of Europe
- APAC
- China
- Japan
- India
- Australia
- South Korea
- Rest of APAC
- Middle East & Africa
- GCC
- South Africa
- Rest of Middle East & Africa
- South America
- Brazil
- Argentina
- Rest of South America
- North America
Data Sources, Market Sizing, and Validation
Desk Research
Desk research starts with public healthcare IT and emergency care signals that can be checked over time, such as CMS quality and throughput measures, CDC emergency care and utilization statistics, and OECD health system datasets. We also review sources such as WHO digital health publications, national health ministry releases, and peer-reviewed journals on ED crowding, triage practices, and clinical documentation patterns.
To translate these signals into market inputs, we cross-read hospital financial filings, investor presentations, reputable press, and association websites that discuss ED modernization and digital workflow needs. Where needed, analyst access to paid subscriptions is used for company financial intelligence, patent databases, and news plus financials to confirm product activity and timing. The sources listed here are illustrative only, and there are many other references we consulted for collection, validation, and clarification.
Primary Interviews and Surveys
Primary work focuses on interviews and structured surveys with hospital IT leaders, ED operations managers, clinical workflow owners, and implementation partners who share rollout timelines and budget cycles they see in practice. For a global market, we cover major demand centers across APAC, EMEA, and the Americas so regional procurement patterns, cloud readiness, and compliance expectations can be compared, and then applied back to the model.
Distribution of primary research fieldwork respondents
| Company type | Respondent position | Region |
|---|---|---|
| Top tier: 39% | CXOs: 15% | APAC: 50% |
| Mid tier: 44% | Functional/Unit leaders: 30% | EMEA: 31% |
| Smaller Players: 17% | Managers: 55% | Americas: 19% |
Market-Sizing & Forecasting
Sizing begins with a top-down build where hospital and emergency care activity indicators are used to reconstruct a realistic demand pool for ED workflow software across regions. The model is then checked with selective bottom-up approximations, such as sampled price ranges for subscriptions and implementations multiplied by likely site counts, followed by channel checks on rollout pace to adjust totals when adoption is uneven.
Inputs include emergency department visit volumes and crowding intensity, hospital digitization and cloud migration rates, typical ED software subscription and services mix, implementation cycle length, and policy pressure around time-to-treatment and documentation quality. When a variable is not consistently visible by country, we use proxy indicators like hospital bed capacity and acute care spend, and then tighten assumptions through interview feedback.
For forecasting, scenario analysis is used to reflect how SaaS penetration, cybersecurity requirements, and budget cycles can speed up or slow down new deployments. The scenarios are anchored to expert expectations on renewal behavior and pricing progression. Assumption gaps are handled by applying conservative ranges first and narrowing them only after the variance can be explained using external signals and primary inputs.
Data Validation & Update Cycle
Outputs are validated through cross checks against independent signals, including hospital IT spending direction, deployment announcements, and the implied number of sites needed to support the revenue total. When country or region values look out of line with ED utilization or provider funding patterns, we re-check the drivers and revise assumptions before internal sign-off.
A multi-step review is followed so the logic, inputs, and unit economics remain consistent across sections, and respondents can be recontacted if a key variable shifts or remains unclear. The report is refreshed annually, and interim updates are made when major regulatory, pricing, or technology changes materially affect adoption. Before delivery, the analysis is re-run with a final pass so clients receive the latest updated view.
Mordor Intelligence's Emergency Department Information System Market Size Measured Against Other Published Estimates
Published market sizes for emergency department information systems can differ even when the same topic name is used, because the assumed scope and timing rarely match perfectly. Differences usually come from how pricing is updated, how services are treated, and how strongly the final number is checked against real hospital deployment signals.
The refresh cadence and currency timing are aligned to the latest year inputs, and the ASP progression is rechecked with implementation and renewal feedback so the 2025 total stays tied to what buyers are paying now, which is how Mordor Intelligence keeps the model grounded for this market. Other estimates may lean more on older base years, blend urgent care or broader EHR functionality into the same bucket, or carry forward software prices without rechecking the services mix and cloud shift that can change revenue recognition.
Benchmark comparison
| Source | Market Size | Gaps in Research Methodology |
|---|---|---|
| Mordor Intelligence | USD 1.18 B (2025) | |
| Global Consultancy A | USD 1.20 B (2025) | Uses a broader offering lens and does not clearly separate ED specific workflow platforms from adjacent hospital digital systems, which can slightly lift the 2025 base. The method also appears to apply a longer cycle forecast that can smooth near term pricing and deployment timing. |
| Industry Publisher B | USD 0.99 B (2024) | Anchors the series to an earlier base year and presents a 2024 value, so the number is not directly comparable to a 2025 total without adjusting for currency year and price updates. Scope details on services and implementation revenue are limited, which can undercount total spend captured by ED deployments. |
Looking across the three figures, most of the spread can be explained by year alignment and what is counted around implementation and ongoing support, not just the software license itself. By keeping assumptions tied to ED visit driven demand signals and by checking price and mix changes at each refresh, we can present a value that is easier to trace back to clear inputs and repeatable steps.


Key Questions Answered in the Report
How big is the Global Emergency Department Information System Market?
The Global Emergency Department Information System Market size is expected to reach USD 1.35 billion in 2026 and grow at a CAGR of 14.19% to reach USD 2.62 billion by 2031.
Which application segment leads the market?
Patient Tracking & Triage holds the largest 35.78% revenue share as of 2025, reflecting the need for real-time patient-flow optimization.
Who are the key players in Global Emergency Department Information System Market?
Cerner Corporation, EPOWERdoc, Inc., T-Systems, Inc., MEDHOST, Inc. and Medsphere Systems Corporation are the major companies operating in the Global Emergency Department Information System Market.
Which is the fastest growing region in Global Emergency Department Information System Market?
Asia-Pacific is forecast to register a 15.53% CAGR through 2031 on the back of healthcare digitization initiatives and government infrastructure spending.
Which region has the biggest share in Global Emergency Department Information System Market?
In 2025, the North America accounts for the largest market share in Global Emergency Department Information System Market.
How are AI tools changing emergency care workflows?
AI-enabled clinical decision support now matches physician triage accuracy, shortens length of stay, and powers ambient documentation that reduces clinician screen time.
Page last updated on:


