Elevator And Escalator Market Size and Share
Market Overview
| Study Period | 2021 - 2031 |
|---|---|
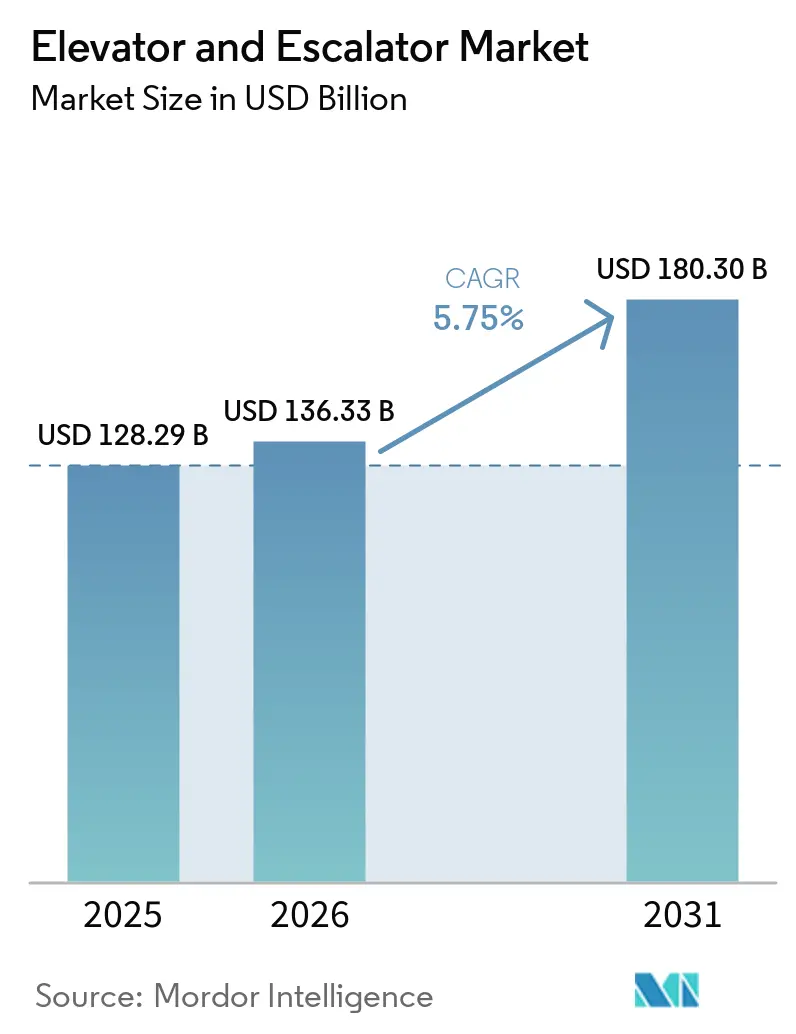
| Market Size (2026) | USD 136.33 Billion |
| Market Size (2031) | USD 180.30 Billion |
| Growth Rate (2026 - 2031) | 5.75% CAGR |
| Fastest Growing Market | Asia Pacific |
| Largest Market | Asia Pacific |
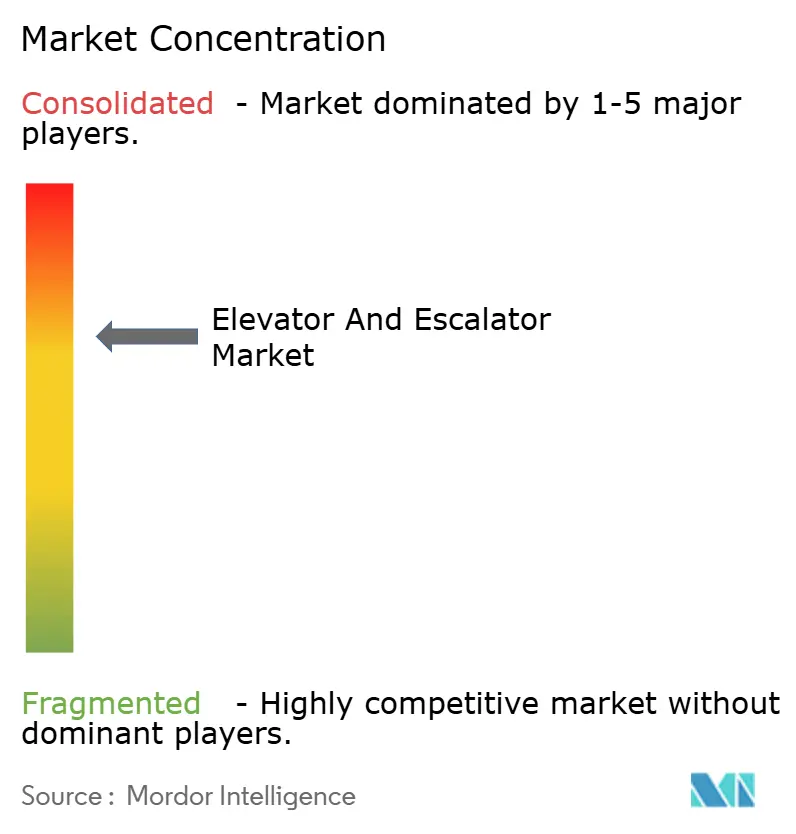
| Market Concentration | Medium |
Major Players
*Disclaimer: Major Players sorted in no particular order Image © Mordor Intelligence. Reuse requires attribution under CC BY 4.0. |
|
Elevator And Escalator Market Analysis by Mordor Intelligence
The Elevator And Escalator Market size is expected to increase from USD 128.29 billion in 2025 to USD 136.33 billion in 2026 and reach USD 180.30 billion by 2031, growing at a CAGR of 5.75% over 2026-2031.
Global high-rise project delays remain concentrated in China, with 193 of 259 global stalled high-rise sites recorded by late 2025, which signals that published pipelines can overstate near-term equipment demand in some submarkets.[1]Council on Tall Buildings and Urban Habitat, “CTBUH Tall Building Database and Project Status Insights,” CTBUH, ctbuh.org Growth momentum in the elevator and escalator market is supported by modernization needs in aging building stock, policy-driven energy performance thresholds, and service models that favor predictive maintenance outcomes.[2]European Commission, “Lift Safety and EN 81-80 Guidance for Existing Lifts,” European Commission, ec.europa.eu Technology transitions such as machine-room-less traction and regenerative drives reinforce developer priorities around usable floor area, lifecycle efficiency, and code compliance, which together shape purchase preferences in the elevator and escalator market.[3]International Organization for Standardization, “ISO 25745 Energy Performance of Lifts, Escalators and Moving Walks,” ISO, iso.org
Key Report Takeaways
- By product type, passenger elevators led with 64.1% of elevator & escalator market share in 2025, while moving walkways are projected to expand at a 7.4% CAGR to 2031.
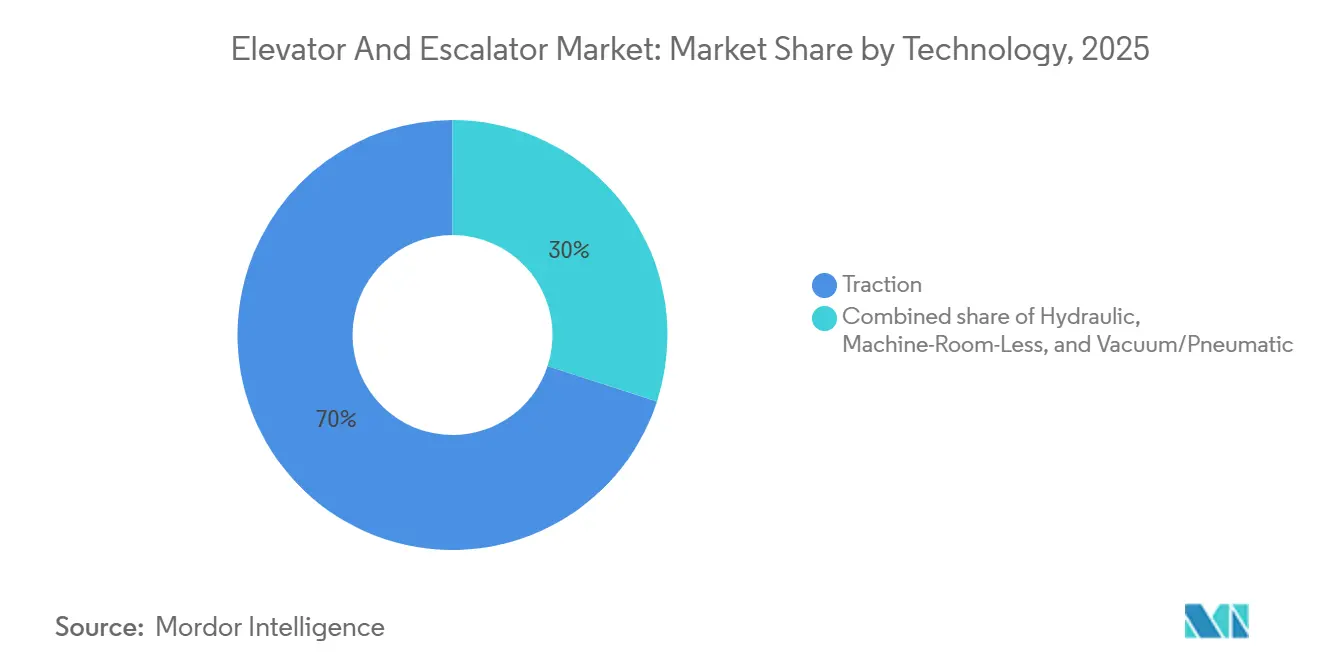
- By technology, traction systems accounted for 70% share of the elevator & escalator market size in 2025, and machine-room-less variants are expected to grow at a 7.8% CAGR through 2031.
- By service, new installations held 47.9% of 2025 revenue, whereas modernisation is expected to register an 8.0% CAGR between 2026-2031.
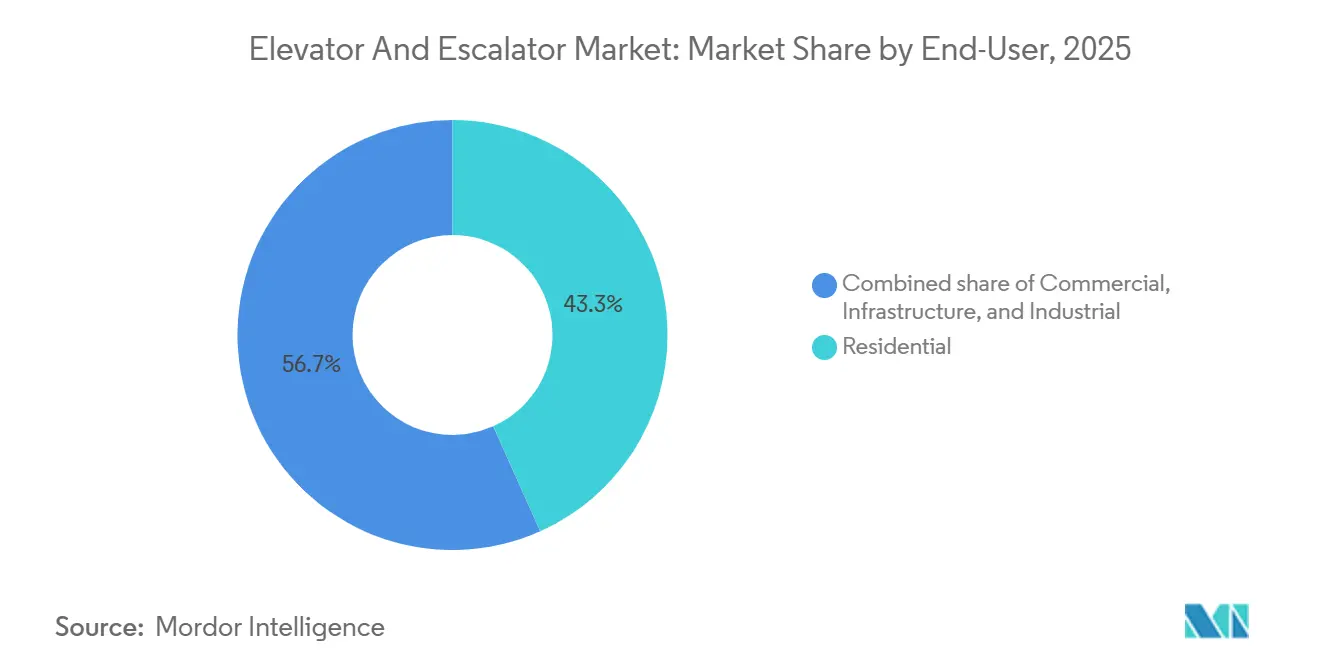
- By end-user, residential captured 43.3% share in 2025, while infrastructure applications are expected to advance at a 6.9% CAGR to 2031.
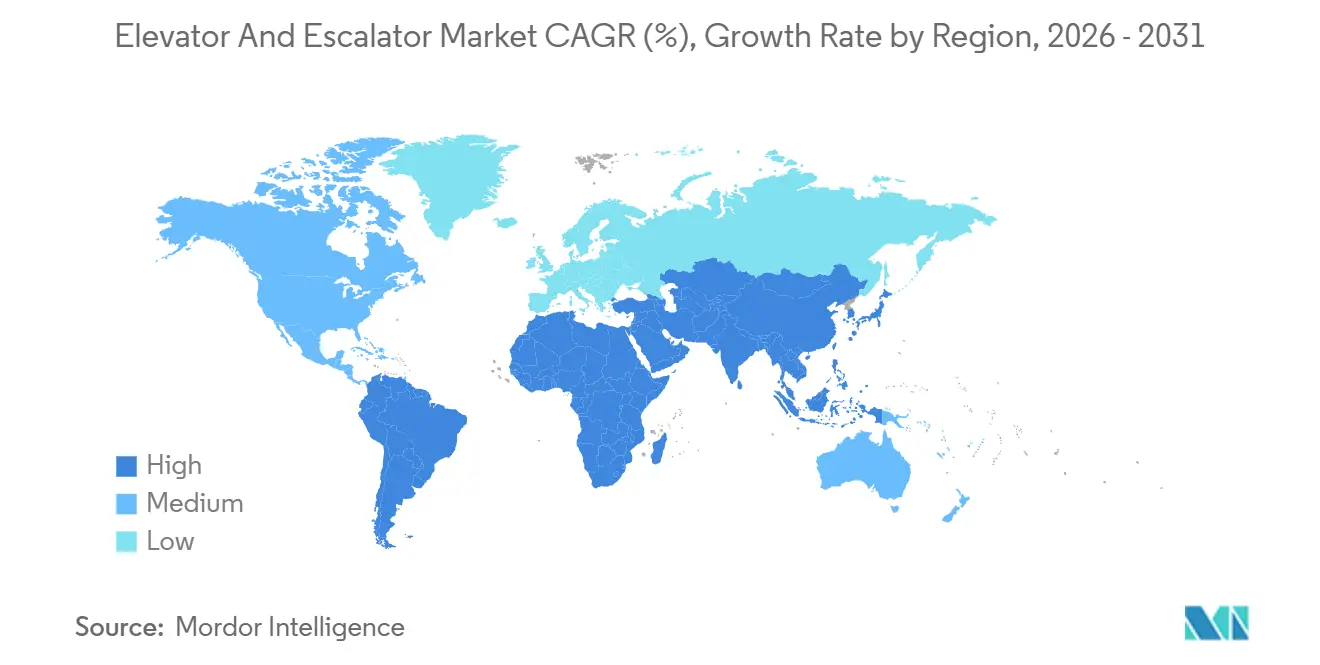
- By geography, Asia-Pacific commanded 62.8% of global revenue in 2025 and is expected to post a 6.2% CAGR during 2026-2031.
Note: Market size and forecast figures in this report are generated using Mordor Intelligence’s proprietary estimation framework, updated with the latest available data and insights as of 2026.
Global Elevator And Escalator Market Trends and Insights
Drivers Impact Analysis*
| Driver | (~) % Impact on CAGR Forecast | Geographic Relevance | Impact Timeline |
|---|---|---|---|
| Rapid Urbanization & High-Rise Construction Boom | 1.80% | Asia-Pacific core, spill-over to Middle East & Africa | Medium term (2-4 years) |
| Ageing Installed Base Requiring Modernisation | 1.50% | Europe & North America, emerging in Japan | Long term (≥ 4 years) |
| Stricter Safety Codes Accelerating Replacements | 1.00% | Global, early enforcement in EU & North America | Short term (≤ 2 years) |
| Escalating Demand for Green-Labelled Products | 0.90% | North America & EU, expanding to APAC urban centers | Medium term (2-4 years) |
| AI-Driven Predictive Maintenance Adoption | 0.70% | Global, led by commercial real-estate portfolios | Short term (≤ 2 years) |
| Touchless & Antimicrobial Interface Demand | 0.40% | Global, concentrated in hospitality & healthcare | Short term (≤ 2 years) |
| Source: Mordor Intelligence | |||
Rapid Urbanization & High-Rise Construction Boom
The Council on Tall Buildings and Urban Habitat counted 141 buildings over 200 m completed in 2025 and anticipates a similar tally for 2026 despite macro headwinds. China’s share is slipping as liquidity strains curb new starts, yet Gulf Cooperation Council mega-projects fill part of the gap, driving steady demand for the elevator & escalator market. Riyadh alone schedules 340,000 new homes and 4.8 million m² of offices by 2030, locking in future equipment orders. India installed 60,000 units in 2024 and now ranks second worldwide by volume, reflecting a nationwide pivot from suburban sprawl to vertical densification. However, 259 global stalled projects temper headline forecasts, underscoring near-term revenue visibility issues for OEMs.
Ageing Installed Base Requiring Modernisation
Otis estimates 7 million elevators surpassed 20 years of service in 2024 and projects 15 million by 2034, twice today’s pool. Europe’s 220 million-plus buildings, 85% of which pre-date 2001, face 74 safety deficiencies under EN 81-80 that trigger modernization. KONE positions its MonoSpace 500 as a drop-in upgrade offering 74% energy savings over 1990s models. Japan’s mandatory seismic retrofits for 30-year-old structures further spur replacements.[4]Japan Ministry of Land, Infrastructure, Transport and Tourism, "Building Code Seismic Upgrades," mlit.go.jp Modernization contracts bundle multi-year service, cementing recurring revenue for OEMs.
Stricter Safety Codes Accelerating Replacements
EN 81-80 lists specific non-compliance points such as door locks and emergency lighting, compelling immediate corrective action across the European Union. Switzerland’s SIA 370.080 assigns owner liability for injuries tied to deferred maintenance, tightening replacement timelines. ASME A17.1 and CSA B44 revisions in North America added mandatory load tests that many older hydraulic platforms cannot pass economically. ISO 25745 now underpins regional energy-performance mandates, disadvantaging outdated hydraulic systems. Insurance carriers are excluding claims linked to lifts that fail EN 81-80 audits, escalating financial pressure on landlords.
AI-Driven Predictive Maintenance Adoption
KONE’s 24/7 Connected Services resolved 70% of alerts proactively in 2024 by streaming vibration and door-cycle data to its analytics engine. Schindler’s Ahead suite cut mean repair time by one-third after learning from millions of service calls. TK Elevator’s MAX platform adds edge computing to monitor traffic and energy consumption, helping landlords honor uptime guarantees embedded in modern leases. IoT retrofits cost USD 2,000-5,000 per unit yet achieve 18-month payback through fewer emergency call-outs.
Restraints Impact Analysis*
| Restraint | (~) % Impact on CAGR Forecast | Geographic Relevance | Impact Timeline |
|---|---|---|---|
| High upfront capital expenditure | -0.8% | Emerging markets in South Asia, Sub-Saharan Africa, Latin America | Medium term (2-4 years) |
| Volatile raw-material prices (steel, chips) | -0.6% | Global, acute in Asia-Pacific manufacturing hubs | Short term (≤ 2 years) |
| Semiconductor-grade component shortages | -0.5% | Global, concentrated in markets demanding IoT-enabled systems | Short term (≤ 2 years) |
| Scarcity of certified technicians in Tier-2/3 cities | -0.4% | India, Southeast Asia, Sub-Saharan Africa, interior Latin America | Long term (≥ 4 years) |
| Source: Mordor Intelligence | |||
High Upfront Capital Expenditure
Mid-rise towers in India need 4-6 elevators costing USD 40,000-80,000 each, a bill often deferred when developers face funding gaps. Full controller replacements in Europe cost up to USD 300,000 per unit, stretching 20-year amortization schedules. In South America, multilateral lending bottlenecks delay disbursements, pushing elevator procurement to later project phases. Performance-based leasing converts CapEx into OpEx but burdens OEM balance sheets, a hurdle for smaller regional players.
Volatile Raw-Material Prices (Steel, Chips)
Steel represents up to 40% of elevator bill-of-materials; prices climbed from USD 650/t to USD 820/t between mid-2024 and early 2025 after Chinese mills cut output. Semiconductor shortages resurfaced in 2024, extending controller lead times 8-12 weeks. Rare-earth magnets essential for permanent-magnet motors jumped more than 20% in 2025 amid export curbs, elevating drive-system costs. Currency swings further squeeze local assemblers with thin margins.
*Our forecasts treat driver/restraint impacts as directional, not additive. The impact forecasts reflect baseline growth, mix effects, and variable interactions.
Segment Analysis
By Product Type: Passenger Elevators Dominate, Moving Walkways Accelerate
Passenger elevators captured 64.1% of the elevator & escalator market share in 2025. The segment benefits from residential high-rises and commercial towers, but moving walkways are forecast to post the fastest 7.4% CAGR, buoyed by airport expansions such as Sacramento International’s 2026 concourse upgrades. Freight elevators serve e-commerce warehouses, while home elevators gain traction in accessibility retrofits. High-speed units remain niche but strategic: KONE’s 10 m/s lifts for Jeddah Tower illustrate demand for ultra-tall applications.
Escalators, especially parallel layouts, dominate retail malls and metro stations. Inclined moving walkways see limited use outside hillside transits due to higher costs. Supertall buildings increasingly adopt express lifts and sky lobbies, reallocating budgets away from escalators toward high-speed passenger elevators. Moving walkways in airports like Miami International, which operates 96 units under a 2025 Otis contract, underscore the infrastructure segment’s tilt toward horizontal conveyance.
By Technology: Traction Leads, MRL Gains on Space and Energy Efficiency
Traction systems commanded 70% of the elevator & escalator market share in 2025. Machine-room-less traction units are projected to expand at a 7.8% CAGR, reclaiming 10-15 m² per shaft and winning Class A/B ISO 25745 ratings that hydraulic rivals cannot match. KONE’s MonoSpace 500 pairs permanent-magnet motors with regenerative drives, cutting annual electricity by up to 40%.
Hydraulic elevators retreat under tighter environmental rules that restrict mineral oils. Vacuum lifts occupy a residential niche, prized for minimal pit depth but limited to 3-4 passengers. Advanced ropes such as KONE’s carbon-fiber UltraRope reduce cable weight 90%, enabling >500 m travel heights and reinforcing traction’s dominance in supertall projects. Building‐code updates from the ICC allow in-hoistway controllers, accelerating global MRL adoption.


By Service: Modernisation Outpaces New Installation
New installations delivered 47.9% of the elevator & escalator market size in 2025, yet modernization is on track for the fastest 8.0% CAGR through 2031. Europe’s vast, aging building stock and EN 81-80 compliance deadlines fuel the replacement wave. Maintenance and repair revenue grows steadily--Otis derived 60% of Q3 2024 sales from service, highlighting its margin advantage.
Asia-Pacific still skews toward new installations; India alone installed 60,000 units in 2024. Predictive platforms such as KONE’s 24/7 Connected Services limit emergency downtime and bundle multi-year agreements, locking in recurring cash flows. OEMs increasingly finance modernization through leasing, converting CapEx into OpEx for owners.
By End-User: Residential Dominates, Infrastructure Accelerates
Residential accounted for 43.3% of the elevator & escalator market share in 2025, sustained by Asian high-rise housing and Western retrofits for aging populations. Infrastructure leads growth at a 6.9% CAGR as governments invest in metro extensions and airports; Riyadh’s USD 196 billion 2025 contract awards exemplify scale.
Commercial offices upgrade to touchless and energy-efficient systems to retain tenants, while retail malls in Asia install heavy-duty escalators to handle peak crowds. Industrial users, chiefly logistics warehouses, deploy freight elevators yet remain cost-sensitive, often choosing hydraulic units. Regulatory energy caps in California and New York incentivize machine-room-less upgrades across commercial and residential segments.
Geography Analysis
Asia-Pacific produced 62.8% of 2025 revenue for the elevator & escalator market and is forecast to grow 6.2% through 2031. India’s tier-2 and tier-3 cities now deliver half of domestic installations, while China’s modernization opportunity offsets new-build slowdowns linked to 193 stalled projects. ASEAN nations such as Vietnam and Indonesia attract manufacturing FDI that boosts mid-rise commercial demand.
North America and Europe grow mainly via modernization. EN 81-80 safety mandates and energy codes underpin steady replacement cycles in Europe, while California’s Title 24 and NYC’s Local Law 97 drive efficiency-based retrofits in the United States. The Middle East & Africa posts the highest regional CAGR, propelled by Saudi Vision 2030 mega-developments and UAE tourism infrastructure; NEOM alone envisions 382,500 homes and 3 million m² offices. South America is mixed: Chile invests in metro extensions, whereas Brazil’s currency volatility delays some projects.

Competitive Landscape
The top four players, Otis, KONE, Schindler, and TK Elevator, command a majority share, yet regional firms such as Fujitec and Hyundai Elevator win volume in ASEAN and the Middle East by localizing supply chains. Service revenue is pivotal: Otis generated 60% of Q3 2024 revenue from maintenance, rising 5.6% YoY. KONE’s predictive suite resolves 70% of faults proactively, creating customer stickiness. TK Elevator’s MAX platform provides real-time dashboards that help landlords avoid uptime penalties.
Technology differentiation hinges on energy-saving and digital capabilities. KONE’s carbon-fiber UltraRope cements its lead in supertall projects. Schindler’s Ahead uses ML to preload parts and cut repair time by one-third. Chinese brands such as Canny and Sigma undercut on price but face certification hurdles in Western markets. M&A activity is quiet; OEMs favor organic growth and targeted service-network acquisitions.
Elevator And Escalator Industry Leaders
-
Schindler Group
-
Otis Worldwide Corporation
-
Kone Oyj
-
Mitsubishi Electric Corporation
-
TK Elevator
- *Disclaimer: Major Players sorted in no particular order

Recent Industry Developments
- May 2026: KONE Corporation, a Finnish elevator manufacturer, has announced an agreement to acquire TK Elevator in a deal valued at approximately EUR 29.4 billion (USD 34.4 billion).
- May 2025: Mitsubishi Electric Building Solutions unveiled a new projection-type hall lantern for elevators, targeting overseas markets. This lightweight and compact design not only projects directional symbols in elevator halls but also eases the installation process. Beyond its functional benefits, the innovation elevates the aesthetic and value of buildings, catering to the growing demand for sustainable elevator display solutions.
- April 2025: Mitsubishi Electric, bolstering its elevator and escalator maintenance business in Europe, acquired the Irish firm Ascension Lifts. The acquisition, executed through its wholly owned subsidiary Motum AB and Mitsubishi Electric Building Solutions, not only amplifies technical capabilities but also broadens the network for multi-brand services.
- March 2025: Mitsubishi Electric Building Solutions Corporation (MEBS) introduced a new control renewal menu on March 19, 2025, tailored for elevators from other manufacturers in existing buildings. The menu boasts a control panel with an auto-tuning feature, seamlessly integrating with third-party traction machines.


Global Elevator And Escalator Market Report Scope
An elevator is a vertical transportation device that carries people or goods between different floors or levels in a building. It operates through an electric motor and a system of pulleys or hydraulic pistons, providing convenient and efficient access to various levels within a structure.
An escalator is a moving staircase designed to transport people between different building levels effortlessly. It consists of a continuous loop of steps that continuously move in a diagonal or vertical direction, allowing users to ascend or descend without needing to climb stairs manually.
The elevator and escalator market scope includes:
| Elevators (Passenger Elevators, Freight Elevators, Home Elevators and High-speed/High-rise Elevators) |
| Escalators (Parallel, Multi-Parallel and Criss-Cross) |
| Moving Walkways (Horizontal and Inclined) |
| Traction |
| Hydraulic |
| Machine-Room-Less (MRL) |
| Vacuum/Pneumatic |
| New Installation |
| Maintenance and Repair |
| Modernisation |
| Residential |
| Commercial (Offices, Retail and Malls and Hospitality) |
| Infrastructure (Airports and Metro and Rail) |
| Industrial |
| North America | United States |
| Canada | |
| Mexico | |
| Europe | Germany |
| United Kingdom | |
| France | |
| Italy | |
| NORDIC Countries | |
| Russia | |
| Rest of Europe | |
| Asia-Pacific | China |
| India | |
| Japan | |
| South Korea | |
| ASEAN Countries | |
| Rest of Asia-Pacific | |
| South America | Brazil |
| Argentina | |
| Chile | |
| Rest of South America | |
| Middle East and Africa | Saudi Arabia |
| United Arab Emirates | |
| South Africa | |
| Egypt | |
| Rest of Middle East and Africa |
| By Product Type | Elevators (Passenger Elevators, Freight Elevators, Home Elevators and High-speed/High-rise Elevators) | |
| Escalators (Parallel, Multi-Parallel and Criss-Cross) | ||
| Moving Walkways (Horizontal and Inclined) | ||
| By Technology | Traction | |
| Hydraulic | ||
| Machine-Room-Less (MRL) | ||
| Vacuum/Pneumatic | ||
| By Service | New Installation | |
| Maintenance and Repair | ||
| Modernisation | ||
| By End-user | Residential | |
| Commercial (Offices, Retail and Malls and Hospitality) | ||
| Infrastructure (Airports and Metro and Rail) | ||
| Industrial | ||
| By Geography | North America | United States |
| Canada | ||
| Mexico | ||
| Europe | Germany | |
| United Kingdom | ||
| France | ||
| Italy | ||
| NORDIC Countries | ||
| Russia | ||
| Rest of Europe | ||
| Asia-Pacific | China | |
| India | ||
| Japan | ||
| South Korea | ||
| ASEAN Countries | ||
| Rest of Asia-Pacific | ||
| South America | Brazil | |
| Argentina | ||
| Chile | ||
| Rest of South America | ||
| Middle East and Africa | Saudi Arabia | |
| United Arab Emirates | ||
| South Africa | ||
| Egypt | ||
| Rest of Middle East and Africa | ||


Key Questions Answered in the Report
How large will global demand be by 2031?
The elevator & escalator market size is forecast to reach USD 180.30 billion by 2031 at a 5.75% CAGR.
Which region provides the greatest growth momentum?
Asia-Pacific remains the largest and posts a healthy 6.2% CAGR, buoyed by India's rapid urbanization and ASEAN infrastructure projects.
Why is modernisation growing faster than new installations?
More than 7 million aging units already exceed 20 years of service and tightening safety codes such as EN 81-80 make replacement more economical than repair.
How are OEMs improving uptime for building owners?
Predictive-maintenance platforms like KONE's 24/7 Connected Services and TK Elevator's MAX stream real-time diagnostics that cut unplanned outages by up to 40%.
What technology trend is reshaping supertall projects?
Carbon-fiber hoisting ropes, exemplified by KONE's UltraRope, reduce cable weight 90% and enable elevator travel beyond 500 m.
Which end-user segment is accelerating fastest?
Infrastructure applications, including metros and airports, are projected to grow at a 6.9% CAGR through 2031 on the back of government stimulus pipelines.
Page last updated on:


